


Abstract
We measure the stellar mass–star formation rate (SFR) relation in star-forming disc galaxies at z ≤ 0.085, using Galaxy Zoo morphologies to examine different populations of spirals as classified by their kiloparsec-scale structure. We examine the number of spiral arms, their relative pitch angle, and the presence of a galactic bar in the disc, and show that both the slope and dispersion of the M⋆–SFR relation is constant when varying all the above parameters. We also show that mergers (both major and minor), which represent the strongest conditions for increases in star formation at a constant mass, only boost the SFR above the main relation by ∼0.3 dex; this is significantly smaller than the increase seen in merging systems at z > 1. Of the galaxies lying significantly above the M⋆–SFR relation in the local Universe, more than 50 per cent are mergers. We interpret this as evidence that the spiral arms, which are imperfect reflections of the galaxy's current gravitational potential, are either fully independent of the various quenching mechanisms or are completely overwhelmed by the combination of outflows and feedback. The arrangement of the star formation can be changed, but the system as a whole regulates itself even in the presence of strong dynamical forcing.
1 INTRODUCTION
Observations at a range of redshifts have established that the star formation rate (SFR) of a galaxy is strongly correlated to its stellar mass (M⋆). This ‘star-forming main sequence’ (SFMS) is nearly linear and has remarkably small scatter at low redshifts (Brinchmann et al. 2004; Salim et al. 2007). Recent observations of star-forming galaxies at high redshifts show that this main sequence remains out to high redshift, but the normalization shifts upwards so that galaxies of the same M⋆ have a higher SFR at high redshift (Daddi et al. 2007; Noeske et al. 2007). The main sequence has been interpreted by Bouché et al. (2010) and Lilly et al. (2013) as the result of the balancing of inflows of cosmological gas and outflows due the feedback. Galaxies self-regulate to remain in a state of homeostasis as they convert baryons from gas to stars. This relation is found in all models where the star formation history of star-forming galaxies is relatively flat over cosmic time, and is insensitive to the details of the feedback mechanism (Hopkins et al. 2014).
As star-forming galaxies may exhibit a wide range of physical appearances in optical images, the natural question can be asked whether the specifics of this morphology and its underlying dynamical processes have any effect on this homeostasis and therefore the galaxy's location relative to the SFMS. If the details of a galaxy's physical appearance are correlated with position relative to the main sequence, then the dynamical processes that give rise to them – such as bar formation and spiral arm pitch angle – are a fundamental aspect of the galaxy's regulatory mechanism. If, on the other hand, these features are not correlated, then there are two options: either galaxy substructure is simply not relevant to the overall M⋆–SFR relationship, or the regulatory mechanism overcomes the local effect of substructure in all circumstances. This ultimately relates to the physical processes that control the overall strength of the regulator in each galaxy.
The fact that star-forming galaxies live on the SFMS is one of the key observations that has been driving the development of new descriptions of how galaxies evolve (eg, Schiminovich et al. 2007). Peng et al. (2010, 2012) argue that galaxies grow in stellar mass during their life as star-forming galaxies on the main sequence before having their star formation quenched either by an external mechanism (‘environment quenching’) or by an internal mechanism (‘mass quenching’). However, De Lucia et al. (2012) point out that, because of a ‘history bias,’ galaxies of identical stellar mass may have different environmental histories that are difficult to disentangle, thus making the mass versus environment debate inherently ill-posed (see also van den Bosch et al. 2008). In addition, Galaxy Zoo data has shown that the environmental dependence of galaxy star formation and that of morphology are not equivalent, mainly because of the abundance of quenched spiral galaxies, a large fraction of which are satellite galaxies (Bamford et al. 2009; Skibba et al. 2009). In any case, life on the main sequence appears to be governed by the action of the regulator to balance gas inflows and outflows (Lilly et al. 2013), making the SFMS a central process in galaxy evolution.
In this paper, we use data from the Sloan Digital Sky Survey (SDSS; York et al. 2000; Strauss et al. 2002; Abazajian et al. 2009) in combination with Galaxy Zoo, the largest data base of visual classifications of galaxy structure and morphology ever assembled (Lintott et al. 2008, 2011; Willett et al. 2013), to test whether disc structure affects a galaxy's star formation properties. We use the Wilkinson Microwave Anisotropy Probe 9 cosmology parameters of |$(\Omega _{\rm m},\Omega _\Lambda ,h)=$| (0.258,0.718,0.697; Hinshaw et al. 2013).
2 DATA
Photometric and spectroscopic data for all galaxies in this paper comes from optical observations in the SDSS DR7. The morphological data is drawn from citizen science classifications in Galaxy Zoo. Detailed classifications of disc morphologies, including arm pitch angle, number of spiral arms, and presence of a galactic bar, are taken from the Galaxy Zoo 2 (GZ2) catalogue (Willett et al. 2013). Merging pairs of galaxies are taken from the catalogue of Darg et al. (2010a), all of which lie in the redshift range 0.005 < z < 0.1. Post-merger spheroidal galaxies without an obvious, separated companion are specifically excluded from our sample.
Stellar masses and SFRs are computed from optical diagnostics and taken from the MPA-JHU catalogue (Kauffmann et al. 2003a; Brinchmann et al. 2004; Salim et al. 2007). We use updated masses and activity classifications from the DR7 data base.1 We select only galaxies with M⋆ > 108 M⊙, for which Brinchmann et al. (2004) estimate that the MPA-JHU sample is complete. Star-forming galaxies are separated from other emission-line galaxies using the standard BPT classification (Baldwin, Phillips & Terlevich 1981) below the Kauffmann et al. (2003b) demarcation. Galaxies classified as star forming but with low signal-to-noise ratio (S/N > 3) are also excluded. Both M⋆ and SFR are measured using median values extracted from the probability distribution functions.
The spiral nature of the star-forming disc galaxies is identified according to the following thresholds in the GZ2 spectroscopic sample, where p is the debiased vote fraction and N the weighted number of total votes: pfeatures/disc > 0.430, pnot edgeon > 0.715, pspiral > 0.619, and Nspiral > 20. These cuts are chosen to ensure reliable identification and with enough data points such that spiral substructure has a reasonable estimate of the associated uncertainty. Subclasses of spiral structure are identified by weighting each galaxy according to the fraction of votes received in each morphological category.
The total sample analysed in this paper consists of 48 405 star-forming galaxies. These are selected from the GZ2 spectroscopic sample with z < 0.085 (the limit of reliable debiased morphological classification for GZ2) for galaxies classified as actively star forming (BPT = 1) from the MPA-JHU emission line measurements. The average colour for the star-forming galaxies is relatively blue, with (u − r) = 1.6 ± 0.4.
Basic properties of the M⋆–SFR linear fit for GZ2 star-forming galaxies. N is the number of galaxies with plurality classifications for spiral arm multiplicity and pitch angles, and at a cutoff of pbar = 0.4 for barred/unbarred galaxies. α and β are fit according to equation (1) to data weighted by morphological vote fractions for spiral arm multiplicity and pitch angle, and to subsamples split by morphology for barred/unbarred and merging galaxies.
| Sample | N | α | β | σα | σβ |
|---|---|---|---|---|---|
| SF galaxies | 48 405 | 0.72 | −7.08 | 7.13 × 10⁻⁶ | 6.98 × 10⁻⁴ |
| 1 arm | 288 | 0.74 | −7.18 | 2.70 × 10⁻⁵ | 2.69 × 10⁻³ |
| 2 arms | 5635 | 0.78 | −7.69 | 3.70 × 10⁻⁵ | 3.78 × 10⁻³ |
| 3 arms | 995 | 0.71 | −6.99 | 4.49 × 10⁻⁵ | 4.65 × 10⁻³ |
| 4 arms | 283 | 0.71 | −7.05 | 4.80 × 10⁻⁵ | 4.93 × 10⁻³ |
| 5+ arms | 286 | 0.80 | −8.11 | 7.54 × 10⁻⁵ | 7.53 × 10⁻³ |
| can't tell | 2002 | 0.77 | −7.72 | 4.53 × 10⁻⁵ | 4.54 × 10⁻³ |
| Tight arms | 3239 | 0.78 | −7.74 | 5.50 × 10⁻⁵ | 5.66 × 10⁻³ |
| Medium arms | 4564 | 0.78 | −7.68 | 4.16 × 10⁻⁵ | 4.21 × 10⁻³ |
| Loose arms | 1672 | 0.78 | −7.64 | 3.21 × 10⁻⁵ | 3.20 × 10⁻³ |
| Barred | 3185 | 0.76 | −7.54 | 8.97 × 10⁻⁵ | 8.88 × 10⁻³ |
| Unbarred | 11 746 | 0.71 | −6.99 | 3.39 × 10⁻⁵ | 3.38 × 10⁻³ |
| Merger | 2951 | – | −6.79 | – | – |
The sample of galaxies examined here is not explicitly constructed to be volume-limited (although Brinchmann et al. 2004 estimate that SFR and M⋆ are essentially complete for the mass and S/N limits employed). The main reason for this is that we are comparing effects between subsamples of galaxies using the same selection functions. One possibility is that volume-limiting would deal with galaxies in which the dust content is high enough to obscure all emission lines, even in the presence of significant star formation. Such galaxies, typically ultraluminous infrared galaxies, have very low space-densities at z < 0.1, and typically lack the regular disc structure needed to categorize it for the morphologies considered here.
In order to address volume-limiting, we have performed a detailed analysis using a series of volume-limits with upper redshift limits out to z < 0.085 and Mr < 20.17. All results discussed in this paper agree with data in the volume-limited group. However, the significance of fits is smaller in the volume-limited data due to the restricted range in stellar mass (M⋆ ≳ 109), which affects the accuracy of a linear fit to the SFMS. For these reasons, we present results from the full sample of star-forming discs, which increases the sensitivity of our method to potentially small shifts between the morphologically selected subsamples.
3 RESULTS
We analyse the dependence of the SFMS for three different sets of disc galaxies: splitting the sample by the observed number (multiplicity) of spiral arms, the relative pitch angle (tightness or winding) of the spiral arms, and the presence of a galactic bar. Both spiral arms and galactic bars can have significant effects on the local properties of a galaxy. Dynamical effects concentrate gas in spiral arms and redistribute star formation (Elmegreen & Elmegreen 1986; Foyle et al. 2010), while longer galactic bars have redder colours and less star formation than the rest of the disc (Hoyle et al. 2011; Masters et al. 2012). We examine whether these kpc–scale effects can be seen long term in the galaxy's SFR–mass relationship.
As a control sample, we also analyse the fits to the underlying SFMS relation for star-forming discs as measured in a sample of local SDSS galaxies (Figs 1– 4, 6). As previously demonstrated with SDSS data (e.g. Brinchmann et al. 2004), there is a tight correlation between M⋆ and SFR, with galaxies in the process of quenching lowering their SFR and falling below the trend. The relationship extends over at least three orders of magnitude in both M⋆ and SFR. Fits to the SFMS for all subsamples in this paper are listed in Table 1.
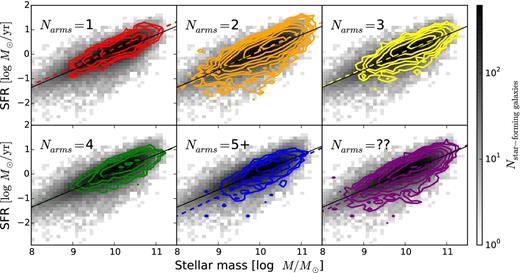
Total SFR as a function of stellar mass; grey-scale colours are the distribution of all star-forming galaxies in SDSS from the MPA-JHU DR7 catalogue. Coloured contours in each panel show spiral galaxies weighted by the GZ2 likelihoods of hosting 1, 2, 3, 4, more than four, or ‘uncertain’ numbers of spiral arms, respectively. Dotted lines show the weighted least-squares linear fit to each population as split by arm multiplicity; the solid line is the fit to all star-forming galaxies.
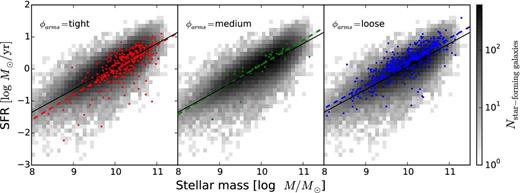
Total SFR as a function of stellar mass; grey-scale colours are the same as in Fig. 1. From left to right: red, green, and blue points are spiral galaxies with ‘tight’, ‘medium’, and ‘loose’ winding spiral arms as identified by GZ2 morphology flags. Dotted lines show the weighted least-squares linear fit as split by pitch angle; the solid line is the fit to all star-forming galaxies. The slight positive offset in SFR for loosely wound spiral arms is interpreted as contamination by merging pairs of galaxies (Section 4).
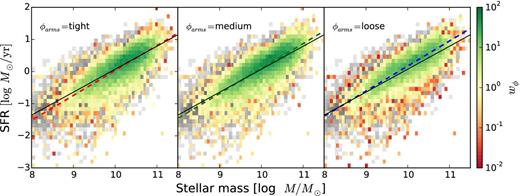
Same as Fig. 2, but with colourmaps showing all spiral galaxies weighted by the GZ2 vote fractions for ‘tight’, ‘medium’, and ‘loose’ winding spiral arms.
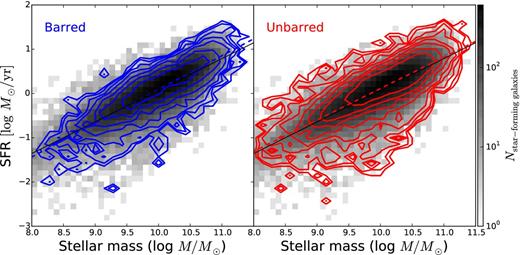
Total SFR as a function of stellar mass; grey-scale colours are the same as in Fig. 1. Left: blue contours show the distribution of barred galaxies (pbar ≥ 0.4 for previously-identified discs) from GZ2. Right: red contours are the distribution of remaining disc galaxy population with no evidence for a strong bar (pbar < 0.4). Dotted lines show the weighted least-squares linear fit to the barred/unbarred population; the solid line is the fit to all star-forming galaxies.
Fig. 1 shows the SFR as a function of M⋆ for disc galaxies separated by their arm multiplicity. The GZ2 data separates disc galaxies with visible spiral arms into categories of 1, 2, 3, 4, or more than four spiral arms; there is also an additional option if the number of spiral arms cannot be accurately determined. For this analysis, galaxies in each mass/SFR bin is weighted by the vote fraction for the morphology being tested. The fit to the SFMS for all six subsamples of spiral galaxies split by arm multiplicity tightly follows that of the total star-forming disc population. Both the slopes and offsets of each linear fit are consistent within the formal fitting errors in Table 1.
One-armed spiral galaxies present an interesting case, with the fit to the weighted population lying slightly above that of all star-forming spirals. This is consistent with the work of Casteels et al. (2013), who showed that one-armed spirals in GZ2 are robust indicators of close interactions at projected distances of rp < 50h−1 kpc. The underlying reason is that many ‘one-armed spirals’ are in fact caused by bridges or tidal tails from interactions with a nearby companion instead of secular processes. We discuss the likely role of merging/interacting galaxies in Section 4 (also see Fig. 6).
The only morphologies that extend slightly below the SFMS are those with the highest level of multiplicity (five or more arms). The best-fitting line for this population has a steeper slope, driven by the galaxies with relatively low SFR at 109 < M/M⋆ < 1010. This is a new and unusual result; one possible explanation is that stellar discs in the process of quenching will have fewer bright H ii regions and the contrast between the arm and interarm regions is increased. This could result in better visibility for older (and potentially overlapping) spatial modes in the galaxy's disc, increasing the measured multiplicity. It should be emphasized, though, that 5+−arm spirals represent the smallest morphological group in the sample, and that the associated fit errors in Table 1 are the largest for any multiplicity; simple statistical variance cannot be ruled out as an explanation for the best-fitting line to the SFMS.
We have repeated the analysis above for the subsample of disc galaxies for which the spiral multiplicity is determined with high confidence (parms number > 0.8) by GZ2, thus eliminating ‘intermediate’ galaxies for which the morphology is uncertain. These galaxies (N = 10 035) are dominated by two-armed spirals, which are the only spiral multiplicity for which significant numbers of galaxies at M⋆ < 109 M⊙ are detected. The results for the SFMS are qualitatively the same as when using the weighting scheme, although we note that there are too few examples (N < 10) of either three- or four-armed spirals for a reliable fit. The offset of the one-armed spirals above the SFMS is also significantly more pronounced when using high-confidence morphologies.
The pitch angle of the spiral arms also has no significant change on the SFMS relation (Fig. 2). We separate galaxies by their relative pitch angles (defined as ‘tight’, ‘medium’, and ‘loose’); the pitch angle is typically used as one of the primary parameters for separating galaxies along the Hubble tuning fork. Willett et al. (2013) show, however, that pitch angle only weakly correlates with Hubble type from expert visual classifications, and that the bulge-to-disc ratio is a more important driver. There is no significant shift with respect to the SFMS as a function of pitch angle for spiral galaxies. The small increase above the main sequence for loosely wound galaxies is also consistent with Casteels et al. (2013), who show that this morphology also correlates with close pairs and interactions.
It should also be noted that the galaxies in GZ2 flagged as a function of pitch angle are not representative of the true vote distribution. The points in Fig. 2 would suggest that there are relatively few spiral galaxies overall, and that most are either tightly or loosely wound. In fact, the plurality classification for most galaxies is for medium-winding; the spread in votes is typically large, though, and so users rarely agree on the ‘medium’ option at the 80 per cent level which sets the flag. An alternative method is to analyse the morphology of spiral galaxies by directly weighting them as a function of the pitch angle categories (Fig. 3), which has the advantage of including all spiral galaxies. This shows an even tighter agreement between the samples separated by pitch angle and that of the full star-forming sample.
Finally, we examine the effect of a large-scale galactic bar on the SFMS. This sample has significantly more galaxies than those including spiral arm morphology, since the classification is at a higher level in the GZ2 tree and has only two choices. This results in a higher percentage of consensus classifications in the GZ2 catalogue. Fig. 4 shows the SFMS for both barred and unbarred galaxies. Although the fraction of barred galaxies varies as a function of stellar mass (Sheth et al. 2008; Cameron et al. 2010; Masters et al. 2011; Cheung et al. 2013), both the linear fits and ranges of the subpopulations are consistent with all star-forming galaxies. In other words, the presence of a bar does not affect a star-forming galaxy's position on the SFMS.
The agreement of all subvarieties of star-forming galaxies is supported by the close agreement to the linear fits to the data for all well-sampled categories (Table 1). This tracks only the slope and offset of the distribution, however, and not its width. We thus also compare the sample standard deviation (σSFR) to the star-forming galaxy population over its various morphological subsamples. The value of σSFR monotonically decreases with increasing mass over the range 8.0 < log (M/M⊙) < 11.5. For all morphological populations examined in this paper, the widths of their distributions are consistent with the broader population (Fig. 5).
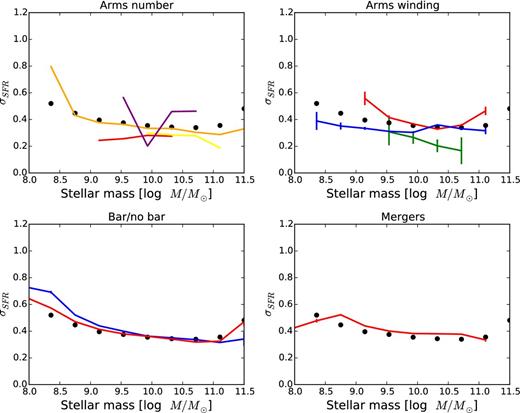
Width of the SFMS (σSFR) as a function of stellar mass, as measured by the sample standard deviation. Black points represent the entire star-forming population. Disc subsamples are overplotted as solid lines; colours are the same as the respective plots in Figs 1, 2, 4, and 6. Morphological categories or mass ranges with fewer than 10 galaxies/bin are not plotted; this includes all galaxies with 3, 4, and 5+ spiral arms.
We have also examined all the populations of galaxies described above (bars, arm pitch angle, arm multiplicity) and measured the differences when using specific star formation rate (sSFR ≡ SFR/M⋆) instead of SFR. There is no significant change in any of the morphologically selected categories as compared to the general SFMS.
4 DISCUSSION
Our results show that the SFMS is remarkably robust to the details of the spatial distribution of star formation within galaxies. Testing for a wide range of morphological subtypes of star-forming disc galaxies yields no statistically significant difference in the relative position of these subtypes vis-á-vis the main sequence. Neither the number or pitch angle of spiral arms, or the presence of a large-scale bar are correlated with any detectable increase or decrease in the efficiency of star formation. The system which regulates star formation in galaxies is thus either not affected by the details of the spatial distribution of star formation, or its regulatory effect is so strong that it wipes out any such effect in a short time.
Abramson et al. (2014) found that by normalizing galaxies by the stellar mass of the disc alone, the slope of the SFMS is consistent with only a linear trend (removing any dependence on mass). Although this correction to the disc stellar mass homogenizes the SFMS for discs with a range of B/T, the intrinsic dispersion (σSFR) of the sequence must be a result of contributions by bars, disc dynamics, halo heating, AGN activity, environment and/or gas accretion history, among other factors (Dutton, van den Bosch & Dekel 2010). Our results show that the neither of the first two factors play dominant roles in controlling σSFR, at least as far as major dynamical drivers (such as strong bars or additional arms) are concerned. Thus while the overall bulge strength does affect the position of a galaxy on the SFMS (Martig et al. 2009; Cheung et al. 2012; Fang et al. 2013; Kaviraj 2014; Lang et al. 2014; Omand, Balogh & Poggianti 2014), the structure of the disc itself does not. This is also consistent with recent models in which details of the feedback, which also relate strongly to the galaxy properties, have little effect on the SFMS (Hopkins et al. 2014). Alternatively, this also agrees with models in which the SFMS is the result of stochastic processes, rather than deterministic physics related to galaxy evolution (Kelson 2014).
The lack of any difference in SFR as a function of mass for barred versus unbarred galaxies is in general agreement with Ellison et al. (2011), who find an increase of ΔSFR ∼ 0.15 dex, but only for galaxies with M⋆ > 1010.7 M⊙. This is at the very upper end of the mass range probed in our analysis of barred versus unbarred star-forming discs (Fig. 4). If the increase in star formation is limited to the central kiloparsec of the disc (as demonstrated using fibre SFR measurements), an increase in possible bar-driven SFR increase is seen down to M⋆ = 1010 M⊙.
The absence of an apparent influence of the bar on the SFMS is still at apparent odds with the anticorrelation between atomic gas mass fraction and the presence of a bar (Masters et al. 2012). One possible explanation is that strong bars are driven by spiral modes with star formation proceeding radially outwards from the centre; in that case, the influence of the bar may not be seen in star formation diagnostics averaged over the entire disc of the galaxy (as used in this paper). It is also important to note that the selection of only star-forming disc galaxies for this study excludes passive discs, which are known to be significantly redder and more massive than their star-forming counterparts (Masters et al. 2010; Cortese 2012).
Amongst individual galaxies that lie significantly off the SFMS, compact starburst galaxies show the largest increase in SFR at a given mass (Elbaz et al. 2011). In the local Universe, these include optically identified ‘green pea’ galaxies, which have unusually high sSFR and can lie more than 1 dex above the SFMS (Cardamone et al. 2009). While few green pea galaxies have detailed imaging available, their most common morphology is in a clumpy arrangement with knots of bright star formation. There is thus little evidence for a dynamically settled disc (in any arrangement) for galaxies in the local Universe lying significantly above the SFMS.
As a comparison to the kpc-scale structures discussed above, we analyse the impact of the most significant forcing event to a galaxy system known – a major galaxy merger (Fig. 6). In these systems, which are in various stages of coalescence, SFRs are increased by only an average of 0.29 dex (less than a factor of 2). Darg et al. (2010b) showed that at z < 0.1, galaxies with intense bursts of star formation are limited to only the spiral (disc) galaxies. This increase in star formation for mergers does show a strong evolution in redshift out to at least 1.5 < z < 2.5, likely due to the higher gas fractions involved (Daddi et al. 2010; Rodighiero et al. 2011). The projected separation between galaxies in which this occurs, based on both the observed merger fraction and sSFR is ∼0.1 Mpc h−1 (Skibba et al. 2009). Our measurements are consistent with observations of galaxies at z ≃ 2 (Kaviraj et al. 2013), which support a merger-driven increase of only a factor of ∼2 in sSFR.

Total SFR as a function of stellar mass; grey-scale colours are the same as in Fig. 1. Left: coloured points show 2978 merging galaxies from Darg et al. (2010a). Mergers are colour-coded by the mass ratio of the primary and secondary galaxies; there is no clear difference in the merging populations with regard to the SFMS when comparing major to minor mergers. When fixing the slope of the SFMS and allowing the offset to vary, mergers (dotted line) have higher SFRs by ∼0.3 dex compared to all star-forming galaxies (solid line). Right: star-forming galaxies binned and colour-coded by merger fraction (Nmergers/Nstar-forming galaxies). Overplotted lines are the same as left-hand plot. Of the galaxies that lie furthest above the SFMS, more than 50 per cent are unambiguous mergers.
The location of mergers on the present-day SFMS shows just how stable the regulatory system in galaxies really is. Almost all simulations of galaxy mergers predict a steep increase in the SFR during both first passage and final coalescence (e.g. Hopkins et al. 2008). The magnitude of this increase often depends on the details of the simulation, but can range from factors of 10 to 100. Observations of mergers in Stripe 82 data, however, limit this increase to between factors of 2 and 6 (Kaviraj 2014). In the low-redshift Universe sampled by SDSS and Galaxy Zoo, we find no evidence for an enhancement more than an order of magnitude. This in turn suggests that the current generation of galaxy merger simulations misses critical feedback mechanisms that prevent runaway peaks in SFRs during mergers.
5 CONCLUSIONS
We analyse for the first time the detailed structure of discs in large samples of star-forming galaxies in the local Universe as related to their position on the M⋆–SFR relation. This analysis is made possible by using morphological classifications from the GZ2 project. We find that neither the slope nor the dispersion of the star-forming galaxies are affected when splitting the sample into different categories of discs, including barred/unbarred galaxies, the pitch angle of spiral arms, or the number of spiral arms.
The uniformity of disc galaxies along the SFMS, regardless of their kpc-scale structure, argues for the system as a whole being strongly self-regulated. While smaller regions of the galaxy can experience (likely temporary) increases in star formation, the amount of star formation in the disc as a whole is conserved. This is preserved even for the strongest forcing events, including major mergers; the physics governing the SFMS are primarily driven by the overall mass of the system. This means that simulations of galaxy evolution must be able to meet the challenge of reproducing the wide range of disc morphologies observed along the Hubble sequence (and in various merger stages) while simultaneously managing feedback so that all disc types maintain the same tight relationship to the SFMS.
The data in this paper are the result of the efforts of the Galaxy Zoo volunteers, without whom none of this work would be possible. Their efforts are individually acknowledged at http://authors.galaxyzoo.org.
We thank Rory Smith, Lucio Mayer, and Bruce Elmegreen for useful discussions. This research made use of topcat, an interactive graphical viewer and editor for tabular data (Taylor 2005) and Astropy, a community-developed core python package for astronomy (Astropy Collaboration et al. 2013). The development of GZ2 was supported by The Leverhulme Trust. KWW and LFF are supported by the US National Science Foundation under grant DRL-0941610. KS gratefully acknowledges support from Swiss National Science Foundation Grant PP00P2_138979/1.
Funding for the SDSS and SDSS-II has been provided by the Alfred P. Sloan Foundation, the Participating Institutions, the National Science Foundation, the US Department of Energy, the National Aeronautics and Space Administration, the Japanese Monbukagakusho, the Max Planck Society, and the Higher Education Funding Council for England. The SDSS website is http://www.sdss.org/.
The SDSS is managed by the Astrophysical Research Consortium for the Participating Institutions. The Participating Institutions are the American Museum of Natural History, Astrophysical Institute Potsdam, University of Basel, University of Cambridge, Case Western Reserve University, University of Chicago, Drexel University, Fermilab, the Institute for Advanced Study, the Japan Participation Group, Johns Hopkins University, the Joint Institute for Nuclear Astrophysics, the Kavli Institute for Particle Astrophysics and Cosmology, the Korean Scientist Group, the Chinese Academy of Sciences (LAMOST), Los Alamos National Laboratory, the Max-Planck-Institute for Astronomy (MPIA), the Max-Planck-Institute for Astrophysics (MPA), New Mexico State University, Ohio State University, University of Pittsburgh, University of Portsmouth, Princeton University, the United States Naval Observatory, and the University of Washington.
