


Abstract
We refined a simulation model of dust scattering for the ρ Ophiuchi cloud complex, which was previously studied by Lee et al., by allowing multiple scatterings through clouds of varying distances and thicknesses. Whereas the optical parameters obtained in the present model are similar to the previous estimations, with 0.35 for the albedo and 0.6 for the g-factor, the present model gives a more realistic result for the clouds’ location at ∼110–130 pc with a thickness of ∼30–40 pc, in the diffuse background that is situated beyond ∼160 pc. We have also performed photodissociation simulations for the region of enhanced H2 fluorescence emission seen around the dark clouds facing the OB associations, and determined the column density of molecular hydrogen to be 1017.0 cm−2, smaller than the value given by Lee et al. by three orders of magnitude. This is due to the much higher intensity of the interstellar radiation field, which was verified by direct calculations based on a star catalogue.
1 Introduction
Among various components of Galactic diffuse far-ultraviolet (FUV) emissions in the wavelengths of 900–1750 Å, scattered starlight from interstellar dust is believed to be the dominant source (Seon et al. 2011a,b), while H2 fluorescent emissions can also contribute significantly to the FUV emissions in the photodissociation regions (PDRs). Hence, FUV observations provide valuable data regarding cool components of the interstellar medium (ISM), such as molecular clouds and dust. They are also the main source of information for hot (T ∼ 104.5–105.5 K) interstellar gas, with many important cooling emission lines such as C iii λ977, O vi λλ1032, 1038 and C iv λλ1548, 1551 (Landini & Monsignori Fossi 1990). For example, the data of the Far Ultraviolet Spectroscopic Explorer (FUSE) have been used to study molecular hydrogen in translucent clouds (Snow et al. 2000), in high-velocity clouds (Richter et al. 2001; Sembach et al. 2001), and in the Galactic high-latitude regions (Gillmon et al. 2006; Wakker 2006). The data from various observations including Voyager, FUSE and the Galaxy Evolution Explorer (GALEX) have been used to obtain the scattering properties of dust grains in a number of astrophysical objects (Sujatha et al. 2005, 2007, 2009; Shalima et al. 2006). Furthermore, recent observations made with the Far-ultraviolet Imaging Spectrograph (FIMS; Edelstein et al. 2006b) have been analysed extensively in the context of dust scattering as well as the fluorescent emissions of molecular hydrogen for a variety of targets (Ryu et al. 2006; Lee et al. 2008; Jo et al. 2012; Choi et al. 2013; Lim, Min & Seon 2013.
The optical properties of interstellar dust grains are generally characterized by the albedo and the phase function asymmetry factor while they, being intrinsic properties of dust, are coupled to each other and cannot be independently determined (Li 2009). For example, Draine (2003) estimated the albedo and the g-factor for the carbonaceous-silicate grains to be ∼0.39 and ∼0.66 at 1550 Å, respectively, implying that the interstellar grains cause strong forward scattering in the FUV, with a moderate albedo. These theoretical values are in good agreement with the results of recent observations (Jo et al. 2012; Choi et al. 2013; Lim et al. 2013), but there have also been reports that differ significantly from the theoretical estimations (Gordon et al. 1994; Calzetti et al. 1995; Gibson & Nordsieck 2003). However, the discrepancies in these observations may partly be due to the uncertainties associated with the scattering geometries and the photon sources.
The property of strong forward scattering of interstellar grains has been utilized in distance estimations of the clouds involved in the scattering processes, with an assumed distribution of stellar photon sources (Sujatha et al. 2005; Shalima et al. 2006; Lim et al. 2013). For example, Lim et al. (2013) applied a Monte Carlo simulation to the region of the Taurus–Auriga–Perseus complex and obtained geometrical structures of the four prominent clouds in this broad region, assuming a single slab model for each cloud. When the cloud geometry was believed to be simple, the result was in good agreement with those based on other methods such as star counting or colour excess of field stars, and in the case of multicomponent clouds the result gave distances and thicknesses encompassing the entire cloud structures. It was also found that the relative location between the target clouds and the bright stars used as photon sources was the most important factor in the estimation of geometrical structures. The results were not very sensitive to the exact values of the albedo and the phase function asymmetry factor.
Electrons in hydrogen molecules, when excited by absorbing FUV photons in the Lyman and Werner bands, decay back to the ground states, resulting in the emission of FUV lines, and these electrons may cascade down to the lower vibration–rotation levels by emitting near-infrared lines (Black & van Dishoeck 1987; Luhman et al. 1997). H2 fluorescence in the FUV band was detected not only in the region under an intense FUV radiation field of a nearby bright star (Witt et al. 1989) but also in the diffuse ISM excited by a general interstellar radiation field (Martin, Hurwitz & Bowyer 1990). In fact, recent observations have revealed that molecular hydrogen fluorescence is ubiquitous in our Galaxy (Korpela et al. 2006; Kregenow et al. 2006; Lim et al. 2013). Observations of molecular hydrogen fluorescence in FUV play an important role in determining the physical conditions of the corresponding regions. For example, Ryu et al. (2006) compared molecular hydrogen fluorescence intensity with Hα emissions for the Eridanus superbubble and found a correlation between the two, indicating that the fluorescence and the recombination emissions are excited by similar physical source. They also compared the intensities of two fluorescent emission line complexes from molecular hydrogen centred at 1580 and 1610 Å, and argued that the high line ratio of the intensity at 1580 Å to that of 1610 Å might imply the existence of molecular clouds with high excitation temperature (∼1000 K) in the region.
The ρ Ophiuchi cloud complex, a dark nebula located just below the star ρ Ophiuchi in the constellation of Ophiuchus with an estimated distance of ∼120–130 pc, is believed to be one of the closest star-forming regions to the Sun (Wilking & Lada 1983; Mamajek 2008). While harbouring star-forming regions and filaments of clouds of dense gas and dust, the complex also resides in the strong radiation field produced by the neighbouring Sco OB2 association. Hence, the region is ideally suited for the study of dust scattering and molecular hydrogen fluorescence and in fact, the FUV data obtained for this and nearby regions have been analysed in these contexts. Sujatha et al. (2005) performed a Monte Carlo simulation for dust scattering for a broad region of the Ophiuchus clouds complex, and determined the albedo (a) and the asymmetry factor (g) to be ∼0.40 and ∼0.55 at ∼1100 Å, by comparing the simulation results with the Voyager archival data. They further argued that scattering occurred at two places: one situated close to the Sun with a distance of d ≤ 60 pc and the other, which contributed dominantly to the observed scattering, located between 100 and 125 pc from the Sun. Lee et al. (2008) studied the region more specific to the ρ Ophiuchi cloud using the FIMS data of 1370–1670 Å and obtained ∼0.36 and ∼0.52 for a and g, respectively, and 120–130 pc for the distance to the cloud. However, both Sujatha et al. (2005) and Lee et al. (2008) used a single scattering model and the cloud was assumed to be infinitely thin, which can hardly be justified and resulted in erroneous results in the optically thick regions.
In this paper, we would like to report the results of our new dust scattering simulations, in which multiple scattering was allowed and the thickness of, as well as the distance to, the clouds was varied from pixel to pixel. We employed the archival data of the same FIMS observations used by Lee et al. (2008), but the analysis region is extended to include the prominent H ii regions located nearby. We will also discuss the results of our new PDR simulations, which adopted a more realistic interstellar radiation field than those used in Lee et al. (2008) and yielded a much lower estimation for the column density of molecular hydrogen.
2 Observations and Results
We adopted the data set from the observations made by FIMS, an imaging spectrograph with a moderate resolving power of λ/Δλ ∼ 550, which was optimized for the observation of diffuse emissions in two wavelength channels, λλ900–1150 Å and λλ1350–1700 Å. FIMS was launched on 2003 September 27 on board the Korean microsatellite STSAT-1 and operated for a year and a half. We analysed only the data of the long-wavelength channel (λλ1350–1700 Å) in the present study since the short-wavelength channel (λλ900–1150 Å) was contaminated by many airglow lines.
The field of view of the long-wavelength channel is 7| $_{.}^{\circ}$|4 × 4.3 arcmin, with a 5–10 arcmin imaging resolution along the slit. More on the instrument, its in-orbit performance, and the data analysis procedures are explained in Edelstein et al. (2006a,b). We selected the region of 340°–360° in Galactic longitude and 8°–28° in Galactic latitude, which includes the ρ Ophiuchi cloud complex and the Upper Scorpius subgroup of the Sco OB2 association. This is the brightest region in FUV outside the Galactic plane (Seon et al. 2011a). The FIMS data set consists of 302 orbits of observations made during the sky survey towards this region. The average exposure time is ∼4.2 s pixel−1, on average. The data were merged and the image was constructed by spatially binning the data with a square bin of 0| $_{.}^{\circ}$|2 × 0| $_{.}^{\circ}$|2, after removing the pixels suspected of contamination by bright stellar sources.
The final FUV map is shown in Fig. 1(a), in which only the data from 1370 to 1710 Å, excluding the intense O i airglow line at 1356 Å, was used. Also shown in Fig. 1 are (b) the Hα emission map, (c) the dust extinction map and (d) the FIMS spectrum of the whole region for the wavelength range of 1400–1650 Å. The Hα map was obtained from Finkbeiner (2003) and the dust extinction map is based on the Schlegel et al. (SFD) Dust Survey map (Schlegel, Finkbeiner & Davis 1998). The FUV intensities in (a) and (d) are given in Continuum Units (photons s−1 cm−2 sr−1 Å−1, henceforth CU); the Hα intensity in (b) is given in Rayleigh (R); and the dust extinction level in (c) is shown in the unit of colour excess, E(B − V). The grey regions in Fig. 1(a) indicate where data were missing. We also see a streak of weak emissions extending to the southwest near the right boundary, which is an artefact due to low exposure time. Dust extinction contours are overlaid in (a) and (c), with levels of 0.14, 0.28, 0.56, 0.84 and 1.40, which correspond to the optical depths of 1, 2, 4, 6 and 10, respectively, at 1565 Å. Prominent H ii regions are indicated in (b), and the asterisk in (c) represents the star ρ Ophiuchi located at (l, b) = (353| $_{.}^{\circ}$|7, 17| $_{.}^{\circ}$|7).
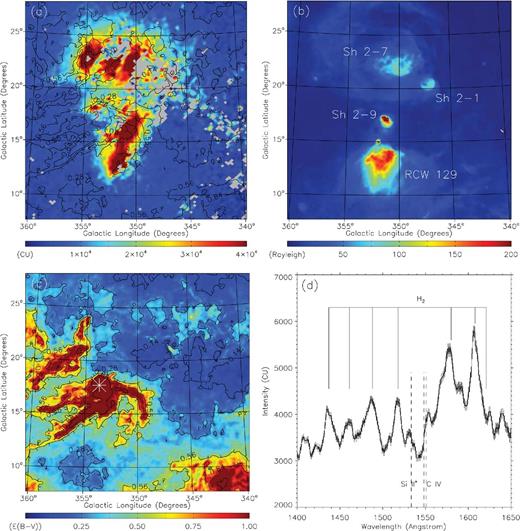
(a) FUV map observed by FIMS, (b) Hα emission map, (c) Schlegel et al. (SFD) Dust Survey map and (d) FIMS spectrum of the whole region in consideration. The FUV intensities in (a) and (d) are given in Continuum Units (photons s−1 cm−2 sr−1 Å−1); the Hα intensity in (b) is given in Rayleigh; and the dust extinction level in (c) is shown in colour excess, E(B − V). The grey regions in Fig. 1(a) indicate where data are missing. The E(B − V) contours are overlaid in (a) and (c), with the levels of 0.14, 0.28, 0.56, 0.84 and 1.40, which correspond to the optical depths of 1, 2, 4, 6 and 10, respectively, at 1565 Å.
The overall shape of the FIMS FUV map in Fig. 1(a) is very similar to the image of fig. 1 in Gordon et al. (1994), which was taken from the FUV Cameras experiment on STS-39 at the wavelength band of 1650–2000 Å, while the bright regions in the FIMS image are seen to be elongated a little bit in the longitudinal direction: this is an artefact caused by the instrumental scattering along the slit. When compared with the Hα image of Fig. 1(b), it may be seen that the FUV emission intensity is not proportional to the Hα intensity, but all of the H ii regions indicated in Fig. 1(b) do show bright FUV emissions. It should be noted that bright stars that do not accompany H ii regions can also contribute to FUV intensity through dust scattering. The eastern boundaries of the bright FUV emission feature in Fig. 1(a) are generally shaped by the thick ρ Ophiuchi molecular cloud complex shown in Fig. 1(c). However, the dust extinction level of this boundary is still high with the value of ∼0.28, which corresponds to the optical depth of ∼2 at 1565 Å, implying that a significant fraction of dust seen in Fig. 1(c) could be located beyond the bright stars that could produce the scattered emissions seen in this region. Fig. 1(d) shows the FUV spectrum of the whole region in consideration: while we may see a hint of ion emission lines such as Si ii* and C iv, the spectrum is dominated by molecular hydrogen fluorescence lines. The intensity of the molecular hydrogen fluorescence emission adds up to ∼17 per cent of the total intensity. We will see later that the molecular hydrogen fluorescence emission is most enhanced in the region around the dark clouds facing the OB associations.
As mentioned previously, the FUV emission seems to be affected by the thick molecular clouds complex on its eastern side, and hence it should be interesting to see the relationship between the FUV intensity and dust extinction. The result is shown in Fig. 2 as a scatter plot. We can see weak but positive correlation between the FUV intensity and dust extinction for E(B − V) less than ∼0.25, while clear negative correlation is seen for E(B − V) larger than ∼0.25. The region of positive correlation mainly corresponds to the blue and the sky blue regions in Fig. 1(c). We note that the regions of bright FUV emission also reside in this interval of E(B − V), implying the FUV emission in this region should be associated with dust scattering of stellar and interstellar photons. As we see the minimum E(B − V) value is ∼0.1 from Fig. 2, we may consider that to be the background. Then, the background-subtracted maximum E(B − V) for positive correlation becomes 0.15, which corresponds to the optical depth of ∼1 at 1565 Å with the conversion factor of RV = 3.1. This is in good agreement with previous observations that FUV intensity increases with dust extinction level in the optically thin region (Hurwitz 1994; Luhman & Jaffe 1996; Seon et al. 2011a). The region of negative correlation, corresponding to E(B − V) larger than 0.25, generally coincides with the ρ Ophiuchi molecular cloud complex.
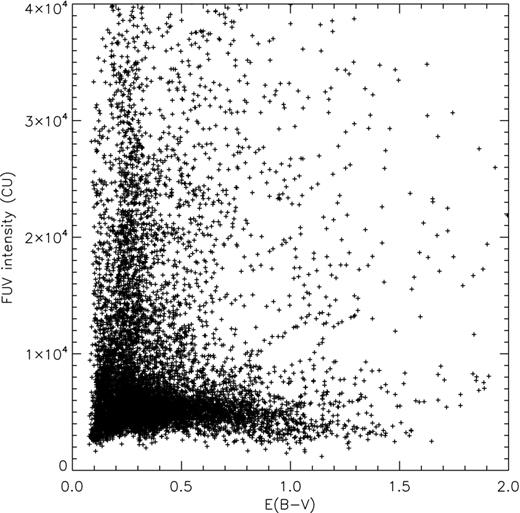
Scatter plot of FUV intensity against dust extinction for the whole region in consideration.
As the spectrum of the present region in Fig. 1(d) shows prominent molecular hydrogen fluorescence lines, it should be interesting to see where these lines originate. We constructed a molecular hydrogen fluorescence image using the emission line at 1608 Å. We took the portion of the spectrum from 1598 to 1618 Å, and made a Gaussian fit around 1608 Å with the line width of 3 Å, assuming the continuum to be the minimum intensity in the spectral interval. The result is shown in Fig. 3: the pixel size of the figure is 1°× 1°, and smoothing was made over a circle of radius of 2° to ensure that the remaining features were reliable since small scale variations in the original 0| $_{.}^{\circ}$|2 × 0| $_{.}^{\circ}$|2 map could be due to short exposure time. The missing area in Fig. 3 corresponds to pixels with a signal-to-noise (S/N) ratio less than 1, again partly due to short exposure time. The S/N ratios of the brightest areas are over 4. One can immediately notice from the figure that there are two regions of bright intensity reaching ∼4×10⁴ LU, both of them being at the outer boundaries of the dark clouds. The regions are ideal places for photodissociation: they are under the intense UV radiation fields produced by the nearby Sco OB2 associations and rich in molecular hydrogen. Being located at the boundaries of molecular clouds, they are not optically thick enough to block the external radiation fields. We will model the whole region including the region around (l, b) = (353°, 23°) using PDR simulations.
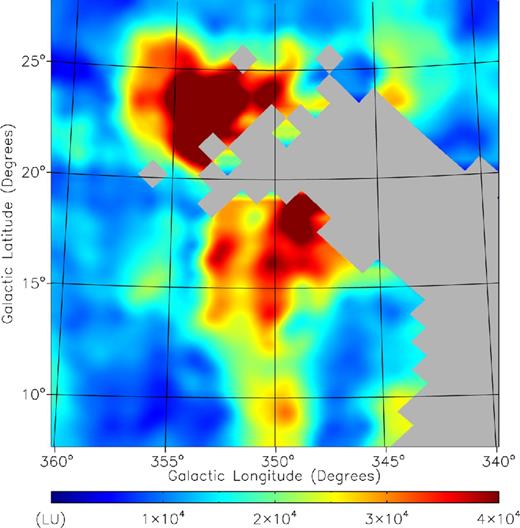
Spectral image for molecular hydrogen fluorescence constructed using the 1608 Å line. The missing area corresponds to those whose pixels have a signal-to-noise (S/N) ratio less than 1, while the S/N ratios of the brightest areas are over 4.
3 ModelLing and Discussion
As most of the FUV emission seen in Fig. 1(a) is believed to be from dust scattering of the photons of nearby stars, especially in the cloud regions, we have conducted dust scattering simulations using a Monte Carlo technique to constrain the scattering geometries of the clouds. We adopted a Monte Carlo radiative transfer code, which has been applied previously to several targets including dust clouds (Jo et al. 2012; Lim et al. 2013; Seon & Witt 2013; Seon et al. 2014). In this code, each scattering is modelled by the Henyey–Greenstein function with albedo (a) and phase function asymmetry factor (g) taken as free parameters to be fitted (Henyey & Greenstein 1941). Multiple scattering is fully taken into accounts and the peeling-off method is adopted for simulation efficiency (Yusef-Zadeh, Morris & White 1984).
In the present simulations, the albedo a was varied from 0.3 to 0.5 and the phase function asymmetry factor g was varied from 0.4 to 0.75, both with 0.05 steps. We took the cloud region of (352° < l < 360°, 12° < b < 22°), which is binned with 32 × 40 pixels to have an angular resolution of 0| $_{.}^{\circ}$|25, as shown in Fig. 4(a). For the simulations, the region was divided into 150 × 150 rectangular cells with a cell size of 1 pc. The third dimension of the simulation box consisted of 300 cells, encompassing the distance of 300 pc with a cell size of 1 pc, and the Sun was assumed to be located at the centre of the front face of the simulation box. A total of 1285 stars based on the TD-1 and Hipparcos catalogues were distributed in the simulation box as photon sources: a total number of 108 photons were assigned to the stars according to their intrinsic luminosities. The integrated E(B − V) values of the map along the sightlines, based on the SFD dust survey map, were distributed with the distance and thickness as free parameters to be fitted for each pixel of the simulation region.
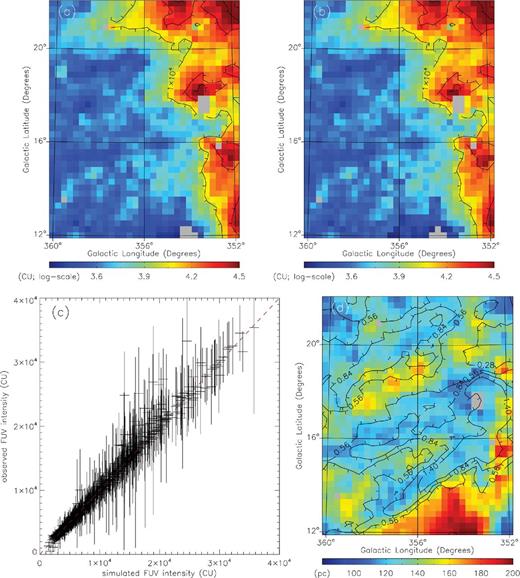
(a) Cloud region of the observed FUV map, (b) simulated FUV map for the cloud region, (c) pixel-to-pixel scatter plot of the observed and the simulated FUV intensities for the cloud region and (d) distance map based on the dust scattering simulation. In (a) and (b), the intensity colour is shown in logarithmic scale.
The best-fitting simulation result was obtained with a = 0.35 and g = 0.6, and is given in Fig. 4(b): the corresponding pixel-to-pixel scatter plot of the observed and the simulated FUV intensities is shown in Fig. 4(c). As can be seen, the fit was remarkably successful, though the extremely small reduced chi-square value (0.11) is partly due to the coarse binning of the observed FUV map. The distance map of Fig. 4(d) shows distinct features of the thick clouds with their front faces located at ∼110–130 pc, the lower clouds being a bit closer than the upper clouds, in the diffuse background located beyond ∼160 pc. The clouds were found to be ∼30–40 pc thick, with the dense regions a bit thicker than the diffuse regions. The albedo value (a) of 0.35 derived in the present study is situated between those of the core–mantle dust model (Li & Greenberg 1997) and the silicate–graphite–PHA model (Li & Draine 2001), which are ∼0.32 and ∼0.39, respectively, at the wavelength of 1565 Å. Ideally, the derived optical properties may be able to give constraints on the dust models. Practically, however, it is difficult to identify the nature of dust based on the simulations such as the one carried out in this work because of the large uncertainties in observations as well as in the models. For example, both of the models proposed by Henyey & Greenstein (1941) and Draine (2003) underestimate the effect of forward scattering at FUV wavelengths, as can be seen in fig. 7 of Draine (2003). In this regard, we note here that, as mentioned previously, the distance estimations are not very sensitive to the exact values of the albedo and the phase function asymmetry factor but rather sensitive to the relative location between the target clouds and the bright stars. The distances estimated in the present simulation are a bit different from those obtained by Lee et al. (2008), who based theirs on a single scattering model with a thin slab. For example, Lee et al. (2008) estimated the distance of the upper cloud region to be beyond ∼150 pc whereas the lower cloud region was estimated to be at ∼110–120 pc. Lee et al. (2008) attributed the inconsistent distance of the upper cloud to the inability of the single-scattering model to fit the optically thick regions. The present model also reveals that the background is located farther away, beyond ∼160 pc, than the distance estimation of ∼130–140 pc obtained in the model by Lee et al. (2008).
Since Fig. 1(d) shows prominent emission lines of molecular hydrogen fluorescence, we wished to model it to obtain the physical characteristics of this region using PDR simulations. We adopted the simulation code cloud (van Dishoeck & Black 1986; Black & van Dishoeck 1987) to constrain the physical condition of this PDR, with free parameters of nH (hydrogen density), T (cloud temperature), N(H2) (molecular hydrogen column density) and IUV (external FUV radiation field), which could be determined by comparing the simulated emission intensities with those of the observations. The hydrogen density nH was chosen from a set of log nH = [1, 2, 3], the temperature T from log T = [1, 2, 3], the molecular hydrogen column density from log N(H2) = 14–22 with a step of 0.5. The interstellar radiation field was varied in a range of log IUV = 0–2.0 with a step of 0.1. We note that Lee et al. (2008) assumed the radiation filed to be a much smaller range of IUV = 0.01–3. The continuum background was chosen to generally follow the minimum data points of the spectrum, as shown with a blue dashed line in Fig. 5(a), and the resulting best-fitting model is shown as a solid red line in the same figure, corresponding to the set of parameters of nH = 1000 cm−3, T = 100 K, N(H2)= 1017.0 cm−2 and IUV = 8 with a reduced χ2 value of 3.34. 1σ confidence ranges of N(H2) and IUV were 1015.0 − 18.5 cm−2 and 2–20, respectively, for the range of nH > 100 cm−3 and 100 K < T < 1000 K.
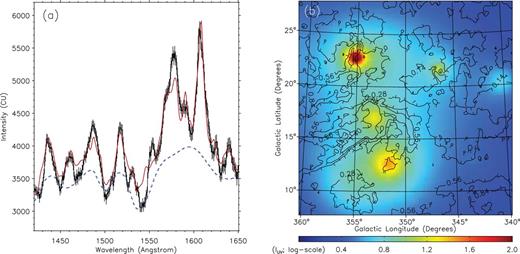
(a) PDR modelling of the spectrum of Fig. 1(d), and (b) the simulated FUV radiation fields of the present region at 134 pc from the Sun. In (a), the blue dashed line is a model continuum and the red solid line is the best-fitting result of the PDR simulation. The radiation field strength is shown in logarithmic scale (log IUV).
While the high temperature of 1000 K has been obtained in previous simulations for PDRs (Ryu et al. 2006; Jo et al. 2011), the value of IUV = 8 is relatively high, as it was generally assumed to be ∼1 in previous PDR simulations (Jo et al. 2011). Hence, we calculated the interstellar FUV intensity at 1550 Å directly from the Hipparcos catalogue (Perryman et al. 1997) to verify it, using model stellar fluxes corresponding to the spectral types (Castelli & Kurucz 2003). Fig. 5(b) shows the calculated radiation fields at a distance of 134 pc, near the mid-plane of the model dust slab obtained from the dust scattering simulation. We can see the radiation intensity is high, with its value generally above IUV = 10, reaching IUV = 100 in the bright regions. While the effect of dust extinction is not taken into account in Fig. 5(b), we can estimate it roughly using the dust slab model based on the present dust scattering simulation: for example, the E(B − V) value around the region of (l, b) = (353°, 23°), where H2 fluorescence emission is most enhanced in Fig. 3, is seen to be ∼0.28, which becomes 0.09 at the mid-plane of the slab after subtraction of the background value of 0.1. With this value of E(B − V) = 0.09, the radiation intensity of IUV = 13 around (l, b) = (353°, 23°) is reduced by ∼50 per cent at the mid-plane of the model dust slab to become IUV = ∼7, similar to the value obtained from the PDR simulation. As the estimation of N(H2) is very sensitive to the value of IUV, the present result of N(H2) = 1017.0 cm−2 is much lower than the value of (2–3) × 1020 cm−2 obtained previously by Lee et al. (2008). The difference in the present best-fitting value of IUV from the value of Lee et al. (2008) is mainly due to that they varied IUV from 0.01 only up to 3.
4 Conclusions
With a refined simulation model of dust scattering in the FUV wavelengths, we revisited the region of the ρ Ophiuchi cloud complex, which was studied previously by Lee et al. (2008). The new model incorporates multiple scatterings through clouds of finite thickness while the previous models assumed an infinitely thin layer. We reproduced the observed FUV intensities with reliable estimations of distance and thickness even for optically thick regions: the clouds were found to be located at ∼110–130 pc with a thickness of ∼30–40 pc, in the diffuse background situated beyond ∼160 pc. The optical parameters obtained in the present model were similar to those of previous estimations, with 0.35 for the albedo and 0.6 for the g-factor. We have also found enhanced H2 fluorescence emission around the dark clouds facing the OB associations, which was modelled with photodissociation simulations: the column density of molecular hydrogen was estimated to be ∼1017.0 cm−2 under a very high interstellar radiation field of IUV = ∼8, as verified by direct calculations based on a star catalogue, which is smaller by three orders of magnitude than the value of Lee et al. (2008), in which IUV = (1–3) was assumed.
FIMS/SPEAR is a joint project of KAIST, KASI (Korea), and UC Berkeley (USA), funded by the Korea MOST and NASA grant NAG5-5355. This research was supported by Basic Science Research Program (2010-0023909) and National Space Laboratory Program (2008-2003226) through the National Research Foundation of Korea (NRF) funded by the Ministry of Education, Science and Technology.
