-
PDF
- Split View
-
Views
-
Cite
Cite
Eduardo Balbinot, B. X. Santiago, L. Girardi, A. Pieres, L. N. da Costa, M. A. G. Maia, R. A. Gruendl, A. R. Walker, B. Yanny, A. Drlica-Wagner, A. Benoit-Levy, T. M. C. Abbott, S. S. Allam, J. Annis, J. P. Bernstein, R. A. Bernstein, E. Bertin, D. Brooks, E. Buckley-Geer, A. Carnero Rosell, C. E. Cunha, D. L. DePoy, S. Desai, H. T. Diehl, P. Doel, J. Estrada, A. E. Evrard, A. Fausti Neto, D. A. Finley, B. Flaugher, J. A. Frieman, D. Gruen, K. Honscheid, D. James, K. Kuehn, N. Kuropatkin, O. Lahav, M. March, J. L. Marshall, C. Miller, R. Miquel, R. Ogando, J. Peoples, A. Plazas, V. Scarpine, M. Schubnell, I. Sevilla-Noarbe, R. C. Smith, M. Soares-Santos, E. Suchyta, M. E. C. Swanson, G. Tarle, D. L. Tucker, R. Wechsler, J. Zuntz, The LMC geometry and outer stellar populations from early DES data, Monthly Notices of the Royal Astronomical Society, Volume 449, Issue 1, 1 May 2015, Pages 1129–1145, https://doi.org/10.1093/mnras/stv356
Close - Share Icon Share
Abstract
The Dark Energy Camera has captured a large set of images as part of Science Verification (SV) for the Dark Energy Survey (DES). The SV footprint covers a large portion of the outer Large Magellanic Cloud (LMC), providing photometry 1.5 mag fainter than the main sequence turn-off of the oldest LMC stellar population. We derive geometrical and structural parameters for various stellar populations in the LMC disc. For the distribution of all LMC stars, we find an inclination of i = −38| $_{.}^{\circ}$|14 ± 0| $_{.}^{\circ}$|08 (near side in the north) and a position angle for the line of nodes of θ0 = 129| $_{.}^{\circ}$|51 ± 0| $_{.}^{\circ}$|17. We find that stars younger than ∼4 Gyr are more centrally concentrated than older stars. Fitting a projected exponential disc shows that the scale radius of the old populations is R>4 Gyr = 1.41 ± 0.01 kpc, while the younger population has R<4 Gyr = 0.72 ± 0.01 kpc. However, the spatial distribution of the younger population deviates significantly from the projected exponential disc model. The distribution of old stars suggests a large truncation radius of Rt = 13.5 ± 0.8 kpc. If this truncation is dominated by the tidal field of the Galaxy, we find that the LMC is |${\simeq } 24^{+9}_{-6}$| times less massive than the encircled Galactic mass. By measuring the Red Clump peak magnitude and comparing with the best-fitting LMC disc model, we find that the LMC disc is warped and thicker in the outer regions north of the LMC centre. Our findings may either be interpreted as a warped and flared disc in the LMC outskirts, or as evidence of a spheroidal halo component.
1 INTRODUCTION
The Milky Way (MW) satellite system offers a variety of examples of dwarf galaxies. Most of its members are essentially gas-free and contain mainly old stars (McConnachie 2012). The evolution of these systems is closely related to the formation of the Galaxy and the process of mass assembly of the large-scale structures in the Universe (Klypin et al. 1999; Moore et al. 1999; Stewart et al. 2008). On the other hand, the Large and Small Magellanic Clouds (LMC and SMC, respectively) are the closest low-mass, gas-rich (Grcevich & Putman 2009) interacting systems. The main features tracing the interaction history of the clouds are the H i Magellanic Stream (Mathewson, Cleary & Murray 1974), and Bridge (Hindman, Kerr & McGee 1963). A counterpart of the Stream was found and named the Leading Arm (Putman et al. 1998). The formation of these structures is a subject of great debate. Recent simulations favour a scenario where the Stream, Bridge, and Leading Arm are remains from the close interaction between the LMC and SMC before falling into the MW potential (Besla et al. 2012; Kallivayalil et al. 2013).
The Clouds’ star formation history (SFH) also reflects their close interaction history. It is possible to identify multiple periods of enhanced star formation that are arguably correlated with close encounter between the Clouds (Holtzman et al. 1999; Javiel, Santiago & Kerber 2005; Rubele et al. 2012; Meschin et al. 2014). Evidence of such events is imprinted in the stellar population which, due to the proximity of the Magellanic System, is resolved into individual stars with medium sized ground-based telescopes. Enhanced star formation is also demonstrated by the extensive star cluster system throughout the Magellanic Clouds (MCs). The clusters in this system span a very broad range in age and metallicity (Kerber & Santiago 2009). Evidence of an age-gap (Jensen, Mould & Reid 1988) may support a relationship between the formation/disruption rate of star clusters and the intergalactic interaction history. In this sense, the star clusters in the LMC may give hints to how the intergalactic interaction affects the evolution of star cluster systems (Renaud & Gieles 2013).
Despite being the nearest interacting system of galaxies, the Magellanic System still has only a small angular fraction observed to the photometric depth of its old main sequence turn-off (MSTO). Deep observations suggest that the LMC stellar populations extend beyond an angular distance of 15° from its centre (Majewski et al. 2009). There is also kinematic evidence for a dynamically warm stellar component consistent with a halo (Minniti et al. 2003) that has its major axis oriented with the disc (Alves 2004).
Very few studies are available in the outskirts of the LMC. Weinberg & Nikolaev (2001) report an exponential scalelength of Rs ∼ 1.4 kpc with no significant distinction between a young and old disc; however, their sample is from the 2 Micron All-Sky Survey (2MASS; Skrutskie et al. 2006), which is very shallow and does not allow for a clear age selection. Saha et al. (2010) report a smaller scalelength of Rs = 1.15 kpc based on an optical survey. They argue in favour of a truncation radius of Rt ∼ 14 kpc. Their sample is limited to only a few fields and their analysis does not use age selected stellar samples.
A new generation of photometric surveys is now coming to the Southern hemisphere, allowing for the first time a complete view of the Magellanic System. One of them is the Dark Energy Survey (DES)1, which will observe the outskirts of the LMC, SMC, and most of the Magellanic Stream over the course of five years. DES is a photometric survey with the primary goal of measuring the dark energy equation of state. To achieve this goal, the survey will employ four independent cosmological probes: galaxy clusters, baryon acoustic oscillations, weak lensing, and Type Ia supernovae (Flaugher 2005). The total survey area is ∼5000 deg2 reaching a magnitude limit of i ∼ 24. The photometric system adopted for DES comprises the filters g, r, i, z, which are similar to the ones used in the Sloan Digital Sky Survey (Fukugita et al. 1996), with the addition of the Y passband, which provides synergy with the VISTA Hemisphere Survey (McMahon 2012) and the VISTA Magellanic Clouds survey (Cioni et al. 2011). The DES footprint will overlap with several other surveys in the Southern hemisphere allowing a multiwavelength approach to various astrophysical problems.
An early release of DES Science Verification (SV) data was made available to the DES collaboration recently. The data cover ∼200 deg2 of the southern sky and sample regions as close as 4° north from the LMC centre. The photometric catalogue from this release reaches ∼1.5 mag fainter than the old MSTO of the LMC (which is at g ∼ 22), allowing for a detailed study of the resolved stellar population of this galaxy.
In this paper, we use the DES SV data to study the LMC geometry and density profile as traced by stellar components with a characteristic age range. We model the distribution of stars using a simple projected exponential disc and perform a formal fit. We discuss the presence of a possible truncation radius and its implication for the LMC mass. As an alternative probe of the LMC geometry we use Red Clump (RC) stars as a distance indicator and a ruler for the LMC thickness. This paper is organized as follows. In Section 2, we present a brief introduction to the DES SV data. In Section 3, we discuss the quality of the photometry and address issues due to completeness and survey coverage. In Section 4, we describe the disc model and the fitting procedure used to find the geometrical parameters of the LMC. Section 5 shows our efforts to use the RC as a distance and thickness estimator. In Section 6, we summarize and discuss the implications of the results found in this paper.
2 DECam AND DES SCIENCE VERIFICATION
The Dark Energy Camera (DECam) (Flaugher et al. 2010) was constructed in order to carry out the DES. This instrument has a focal plane comprised of 74 CCDs: 62 2k × 4k CCDs dedicated to science imaging and 12 2k × 2k CCDs for guiding, focus, and alignment. The camera is also equipped with a five element optical corrector and a sophisticated cryogenic cooling system. DECam is installed at the prime focus of the Cerro Tololo Inter-American Observatory (CTIO) 4 m Blanco telescope. In this configuration, DECam has a 2.2 degree-wide field-of-view (FoV) and a central pixel scale of 0.263 pixel−1. In typical site conditions, the Blanco telescope plus DECam yield an imaging point spread function with full-width half-maximum (FWHM) of 0.9 parsec, which is adequately sampled by the pixel scale.
DECam was commissioned in 2012 September and began operations in 2012 November, with the DES SV campaign covering a period of three months. The DES SV data are intended to test capabilities of the camera, the data transfer infrastructure, and the data processing. All images taken during SV are public; however, the catalogues generated by the collaboration are proprietary.
2.1 Data reduction
The DES data management (DESDM) team was responsible for the reduction of the SV images. Here, we will give a brief description of the reduction process. For a complete description, we refer to Sevilla et al. (2011), Desai et al. (2012), and Mohr et al. (2012).
The DESDM data reduction pipeline consists of the following steps.
Image detrending: this step includes correction for cross-talk between CCD amplifier electronics, bias level correction, correction for pixel-to-pixel sensitivity variation (flat-fielding), as well as corrections for non-linearity, fringing, pupil, and illumination.
Astrometric calibration: in this step, bright known stars are identified in a given image using SExtractor (Bertin & Arnouts 1996). The position of these stars in the focal plane is used to find the astrometric solution with the aid of the software scamp (Bertin 2006) through comparison to UCAC-4 (Zacharias et al. 2013).
Nightly photometric calibration: several reference stars are observed each night, and a photometric equation is derived for that night. This equation takes into account a zero-point, a colour term, and an airmass term for each of the DECam science CCDs.
Global calibration: relative photometric calibration of the DES survey area is done with repeated observations of the same star in overlapping DECam exposures using a method similar to that described in Glazebrook et al. (1994). The relative magnitudes are anchored to a small set of absolutely calibrated reference stars within the same area called tertiary standards which come from observations on photometric nights. They are then calibrated relative to known equatorial belt standards observed on the same night with the same filter set (Tucker et al. 2007). The current accuracy of the relative and absolute systems is a few per cent, and is expected to improve as the DES survey covers larger contiguous areas. DES calibration was checked using the Star Locus Regression technique (Kelly et al. 2014). This analysis revealed that zero-point offsets are typically less than 0.05 mag in g, r, i, and z across the DES footprint observed so far.
Coaddition: in order to increase the signal-to-noise ratio, exposures are combined. This has the advantage of mitigating transient objects, such as cosmic rays and satellite trails. This step requires the placement of the images in a common reference projection. The software swarp (Bertin et al. 2002) was used and the co-addition process was done in segments of the sky called tiles. At this stage the flux is corrected according to the photometric calibration described above.
Cataloging: for each co-added tile source detection and model-fitting photometry is performed using psfex and SExtractor (Bertin & Arnouts 1996; Bertin 2011) on a combined r, i, and z image. Object fluxes and many other characteristics are calculated in the individual g, r, i, z, Y frames. These catalogues are ingested into a high-performance data base system.
The final catalogue is available for the DES collaboration through a data base query client. There are approximately 900 parameters measured for each source identified by SExtractor. In Table 1, we list a few parameters relevant to this work. In the same table, we also list any comments about the parameter and the quality cuts applied.
Here, we show a subset of the SExtractor parameters measured for the co-added DECam SV data. We also show any selection criteria that were made.
| Parameter name . | Selection . |
|---|---|
| RA | – |
| DEC | – |
| MAG_AUTO_* | ≤ 26.0 in g and r |
| MAGERR_AUTO_* | – |
| SPREAD_MODEL_* | |SPREAD_MODEL_I| ≤ 0.002 |
| FLAGS_* | ≤ 3 in g and r |
| Parameter name . | Selection . |
|---|---|
| RA | – |
| DEC | – |
| MAG_AUTO_* | ≤ 26.0 in g and r |
| MAGERR_AUTO_* | – |
| SPREAD_MODEL_* | |SPREAD_MODEL_I| ≤ 0.002 |
| FLAGS_* | ≤ 3 in g and r |
Note. The * symbol refers to all passbands available.
3 THE SV DATA
By the end of the SV campaign, DECam had obtained images in five passbands of a region with roughly 300 deg2, for which 200 deg2 are contiguous. The contiguous region covers the northern outskirts of the LMC. This region overlaps an eastern portion of the South Pole Telescope (SPT) footprint (Carlstrom et al. 2011). Hence, we call it SPT-E for simplicity.
In this section, we will discuss several aspects of the SV data and how it is suitable for the analysis we propose.
3.1 Photometry
Currently, the deepest and most homogeneous magnitude measurement resulting from the DESDM pipeline is MAG_AUTO, which is computed using the flux inside a Kron radius (Kron 1980). The Kron radius is dependent on how extended a source is, hence the aperture is variable, but it is essentially the same for all stars, given that there are no significant spatial dependence in the image quality, which is the case for DES observations. Thus, MAG_AUTO is roughly equivalent to a simple aperture magnitude but less sensitive to seeing variations. We adopt the following notation throughout the paper: g is the MAG_AUTO magnitude measured for the g passband. This also applies for the magnitudes measured in r, i, z, Y.
The raw DESDM catalogue has approximately 108 sources with g ≤ 24.6. This list includes spurious detections like satellite trails, star wings, cosmic rays, etc. To exclude such detections from our catalogue, we adopt a simple cut in the FLAGS parameter. We select only sources that simultaneously have FLAGS_G and FLAGS_R ≤ 3, which selects objects that are not saturated and do not contain any bad pixel. The FLAGS code is the same as the one adopted by SExtractor. The number of sources left after this cut is ∼9 × 10⁷.
We check the stability of the photometric calibration provided by DESDM by comparing the RC peak colour at different points of the SPT-E that contain LMC stars. For all bands, we found a maximum scatter of 0.02 mags around the RC peak colour.
By fitting the above equation to a sample of 0.01 per cent randomly chosen stars from the SPT-E region, we find the error curves shown in Fig. 1. The coefficients for each curve are given on Table 2, where we also show the 10 per cent uncertainty magnitude for each band. Along with these values, we also give some basic information about the filter central wavelength and extinction coefficients at those wavelengths from Cardelli, Clayton & Mathis (1989).
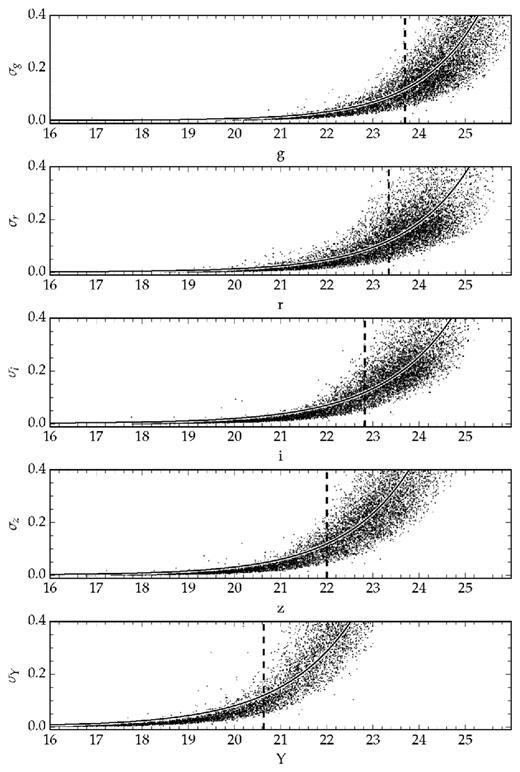
Magnitude versus uncertainty for a sample of 0.01 per cent of the total number of stars in the DECam SV region. The solid curve shows the best-fitting error model. The coefficients are given in Table 2. The dashed line shows the 10 per cent uncertainty magnitude.
Some general photometric system information: the central wavelength (λc) in nanometres, the extinction as a fraction of the extinction in the Johnson V passband (assuming RV = 3.1 and a Cardelli et al. (1989) extinction curve for the MW), and the value of the magnitude corresponding to a typical signal-to-noise ratio of 10. In the last three columns, the coefficients of the best-fitting error model are shown.
| Filter . | λc . | Aλ/AV . | m10 per cent . | (a, b, c) . |
|---|---|---|---|---|
| . | (nm) . | . | . | . |
| g | 479 | 1.199 | 23.94 | (0.001, 26.41, 1.25) |
| r | 641 | 0.837 | 23.76 | (0.001, 26.34, 1.27) |
| i | 781 | 0.635 | 22.75 | (0.003, 25.52, 1.34) |
| z | 924 | 0.462 | 22.03 | (0.003, 24.75, 1.43) |
| Y | 1008 | 0.400 | 20.50 | (0.009, 23.45, 1.40) |
3.2 Star/Galaxy separation
The DES collaboration has generated several data sets for validating and testing the DESDM system (Mohr et al. 2012). These data sets were simulations of the actual observations. To create these mock observations, input catalogues of artificial galaxies and stars were generated (Rossetto et al. 2011; Balbinot et al. 2012; Busha, in preparation). The mock observations included a time varying seeing, realistic shapes for the galaxies, and variations to the focal plane of DECam. These images were fed into the DESDM reduction pipeline and an output catalogue was generated, which was then released to the collaboration to perform tests of their scientific algorithms.
Tests with a set of such simulations, called Data Challenge 5 (DC5) by the collaboration, have been carried out in order to assess how different star–galaxy classification parameters perform. A summary of this comparison is shown in Rossetto et al. (2011). The main conclusion is that SPREAD_MODEL (Desai et al. 2012; Bouy et al. 2013) performs better in terms of purity and completeness than other typically employed classifiers such as CLASS_STAR and FLUX_RADIUS (Bertin & Arnouts 1996). Later, Soumagnac et al. (2013) developed a more sophisticated star–galaxy separation algorithm; however, this algorithm must be trained on a data set where true stars and galaxies are known. Implementation of such methods is being considered collaboration wide. For simplicity, we choose to use SPREAD_MODEL measured in the i band as the star–galaxy separator. The cut-off criterion for selecting stars is |SPREAD_MODEL_I| ≤ 0.002. From test on DC5, this cut is found to correspond to a simultaneous stellar completeness and purity of ≃80 per cent for objects with g < 23 (Rossetto et al. 2011). From this point further we call objects that match this cut-off criteria stars. It is worth mentioning that at g = 23 we expect ∼20 per cent of contamination from galaxies in our sample. However, the large-scale distribution of these objects is homogeneous and is unlikely to significantly affect the findings of this paper.
3.3 Completeness
To independently assess the completeness of the DESDM catalogue, we conducted a few experiments using daophot (Stetson 1987). This photometry code is known to perform very well in extremely crowded regions such as the cores of globular clusters (Balbinot et al. 2009). Hence, at the typical density of LMC field stars it should yield a fairly complete catalogue. This daophot catalogue may be compared to the one produced by DESDM as an approximation to a complete catalogue and giving an estimate of the completeness as function of magnitude. This is not the most accurate approach to this problem; however, it is much simpler than performing artificial star experiments across several hundred squared degrees.
We performed daophot photometry on 51 fields, 50 of which contained an LMC star cluster in its centre. The 51st field was selected as far away as available in the SPT-E data in order to sample a region where there are few or no LMC stars. The fields selected are subregions of the co-added images encompassing 6.75 arcmin × 6.75 arcmin each, with the exception of the 51st field, which has 18 arcmin × 36 arcmin. The first 50 fields were selected in order to assess the completeness not only in regions with a density of stars typical of the LMC, but also with varying density, such as the inner regions of a star cluster. A broader discussion about this subject will be presented in a future paper. The 51st field was selected in order to compare the performance of the DESDM reduction pipeline in a region with little or no crowding. The position of each of the all 51 fields is marked on Fig. 2. On average DESDM and daophot photometry agree within 0.02 in g and r.

Top panel: Gnomonic projection of the number of 2MASS stars that are consistent with AGB and RGB stars according to Yang et al. (2007). The projection is centred in the LMC centre. Part of the SMC is visible in the lower-right corner. The solid contour shows an approximate footprint of the southern part of the SPT-E region of the DES SV data. Bottom panel: Gnomonic projection of a Nside = 4096 healpix map of the g magnitude limit mangle mask for the SPT-E region quoted above. Holes and unobserved regions are masked and shown in white. Red circles mark the position of the fields selected for assessing the survey completeness.
To compare the number of stars as a function of magnitude, we cut both the DESDM and daophot catalogues at the 3 per cent photometric uncertainty level. This cut happens at g ≃ 23.5. To separate stars from galaxies in daophot, we adopted a cut in the sharpness parameter which behaves similarly to SPREAD_MODEL.
In Fig. 3 top panel, we show the ratio between the number of stars detected by DESDM and daophot (NDES/NDAOPHOT) averaged in magnitude bins for the 51 fields discussed above. The solid line shows the average value at a given magnitude bin. The shaded region shows the standard deviation. In the two bottom panels in the same figure, we show the value of NDES/NDAOPHOT as a function of angular separation to the LMC centre. We show this for two magnitude bins: 21.8 < g ≤ 22.6 and 22.6 < g ≤ 23.3 (also indicated in the figure). From Fig. 3, we notice that the average completeness drops as a function of increasing magnitude, as expected. The completeness remains roughly constant as a function of angular separation to the LMC centre with a spread of the same order as the one shown in the shaded region of the top panel. We conclude that the completeness has little spatial dependence at least up to magnitudes as faint as g ∼ 23.
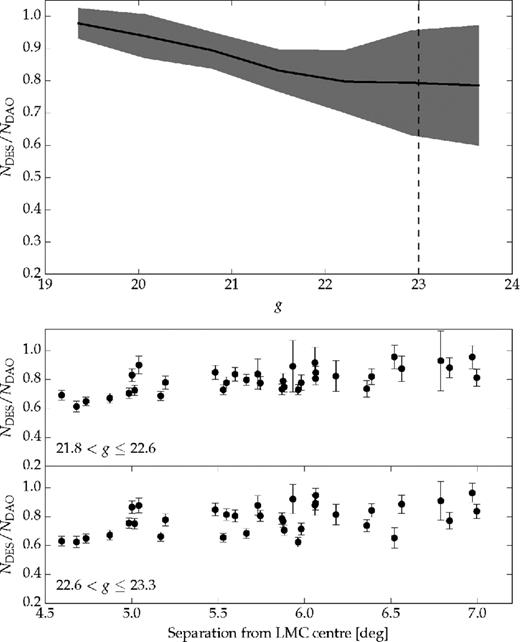
Top panel: we show the ratio of stars detected by DESDM and daophot as a function of g magnitude. The solid line shows the average for the 51 fields analysed. The shaded region shows the standard deviation for the 51 fields. The dashed vertical line shows the faintest magnitude limit used in this work. Bottom panels: black circles show the same ratio as in the top panel but now as a function of angular separation to the LMC centre for two magnitude bins (indicated in the captions). The error bars are computed using the Poisson uncertainty.
Despite the good performance in moderately crowded fields (i.e. LMC field population), we observed that in the inner regions of star clusters the DESDM sample is highly incomplete reaching less than 40 per cent completeness for g = 19 and dropping to zero for fainter magnitudes. This will be further explored in future publications.
We note that where the completeness is most important to our results regarding truncation radii and scalelengths, i.e. at distances farther away from the centre of the LMC, the star density is low enough that crowding effects do not affect the sample selection as shown in Fig. 3.
From the completeness analysis described above, we conclude that in the DESDM catalogue completeness does not depend strongly on source density, except in extremely crowded environments such as the central parts of stars clusters. From visual inspection and through comparison with state-of-the-art crowded field photometry methods we find no strong evidence for large-scale variations in the stellar completeness in the SPT-E region, thus allowing us to properly access the spatial distribution of stars across its footprint, either from the LMC or from the MW.
3.4 Mangle masks
We use the mangle software (Swanson et al. 2008) to track the survey coverage and limiting magnitude. Along with the release of the DESDM catalogues, a set of mangle masks was also provided. These masks contain information about the limiting magnitude in each patch of the sky, as well as other key information about data quality. The magnitude limit is computed as the detection limit of a point source with signal-to-noise ratio S/N = 10. The noise is estimated from the variance and level of the sky on a patch of the sky. To measure the flux an aperture of 1 arcsec radius is used; this yields a magnitude measurement called MAG_APER_4. For a complete description of the masks, we refer to Swanson et al. (2012).
In Fig. 2, we show the number of asymptotic giant branch (AGB) and red giant branch (RGB) stars found in 2MASS according to Yang et al. (2007) with the southern limits of the SPT-E region overplotted (top panel). We also show an approximation of the magnitude limit mangle mask for the SPT-E region (bottom panel). It is an approximation in the sense that it uses the value of the mangle mask at the central position of each pixel in the sky. The grey-scale represents the magnitude limit at each point of the footprint. Holes caused by bright stars or other image imperfections are displayed as well. These regions have a magnitude limit of zero, hence going out of the grey-scale range. The white colour in the figure represents regions that were not observed. The figure uses a healpix pixelization (Górski et al. 2005) with Nside = 4096 and a Gnomonic projection centred at (α, δ) = (75°, −55°).
The approximate mask discussed above allows us to deal with the full SPT-E mask in a much faster way and at the same time to provide a very good approximation of the general properties of the survey, such as coverage and magnitude limits. The coverage mask is simply a healpix map with the value of 1 for pixels that were observed and 0 for those that were not or were masked for some reason. The coverage mask originally did not contain holes due to star clusters. To mask these regions, we conducted a visual search for star clusters in the SPT-E and used the position of each cluster to add a hole in the mask (i.e. a region with coverage equals to zero).
The approximated masks were used to remove stars residing in regions where the following criteria were met: (i) a limiting g or r magnitude brighter than 23; (ii) coverage value equal to 0. The additional trimming for zero mask values was necessary because the original catalogue was limited by the exact masks, not the approximated ones.
The above section outlines the process of trimming the catalogue to select objects that are likely stars and to keep only regions with deep photometry that were not affected by artefacts in the survey. This catalogue, as well as the mask associated with it, will be used in the remainder of this paper.
4 THE LMC GEOMETRY
Classically, the LMC is classified as an Irregular Dwarf Galaxy, although it has several major components of a spiral galaxy such as a disc and a bar. It is, perhaps, more appropriate to classify this galaxy as a highly perturbed spiral galaxy. Its morphology departs so much from a classical Irregular Dwarf that it has been established that the LMC is the prototype of a class of dwarf galaxies called Magellanic Irregular (de Vaucouleurs & Freeman 1972). These galaxies are characterized by being gas-rich, one-armed spirals with off-centre bars.
The SMC is the closest neighbour to the LMC. Together they form the Magellanic System. Recent dynamical modelling (Besla et al. 2012) and high precision tangential velocity measurements (Kallivayalil et al. 2013) point to the need for updated thinking with regard to the origins of the Magellanic System. The centre of mass spatial velocity of these galaxies is very close to the escape velocity of the MW, thus suggesting that the system is not gravitationally bound to the MW. The same models also predict the formation of the Magellanic Bridge and Stream as a result of the interaction of the LMC with the SMC, generating long arms of debris in the same fashion as the Antennae system.
Despite the growing number of simulations and high precision velocity measurements, a few aspects of the LMC geometry, such as the presence of a spheroidal halo (Majewski et al. 2009), and the warping and flaring of the disc (Subramaniam & Subramanian 2009) remain uncertain to some degree. New large area surveys in the Southern hemisphere are beginning to shed light on these uncertainties.
Five parameters are used to model the disc geometry: the LMC central coordinates (α0, δ0), its distance to the Sun (RLMC), the inclination i, and the PA θ. Additionally, three parameters describe the density of stars along this disc: the central density ρ0, the scale radius Rs, and the density scale of background stars ρBG.
To simplify the problem and to better accommodate the fact that the observations are all on the northern side of the MCs, we make a few assumptions. The LMC centre is kept fixed at the Nikolaev et al. (2004) value of (α0, δ0) = (79| $_{.}^{\circ}$|40, −69| $_{.}^{\circ}$|03). The heliocentric distance to the LMC centre RLMC = 49.9 kpc is adopted from the most recent review about the subject (de Grijs, Wicker & Bono 2014).
With the machinery to produce LMC disc models, we proceed to a formal fit to the observed distribution of stars in the SPT-E region. This fit was performed on three samples of stars. The selections were made based on parsec (Bressan et al. 2012) stellar evolution models. The first is made only of stars older than 4 Gyr, selected using a colour–magnitude cut shown in Fig. 4. The second sample selects only stars younger than 4 Gyr. The third sample is made of stars that fall within the limits 17 < g < 23 and −0.5 < g − r < 1.0. We name these samples old, young, and all for simplicity. In Fig. 5, we show the ratio of old (young) and all stars for a simulated LMC stellar population that assumes a constant star formation rate (SFR) and a Piatti & Geisler (2013) age–metallicity relation (AMR). Photometric errors were simulated according to equation (1) and Table 2. We observe that the colour–magnitude cuts chosen are able to create two samples with virtually no age overlap.
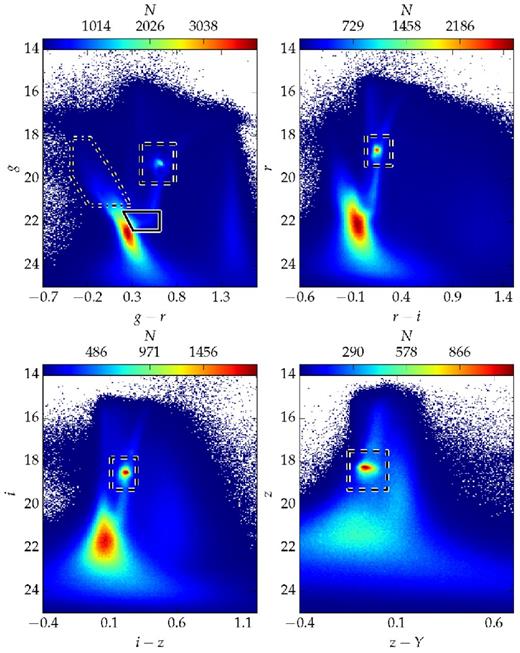
The Hess diagrams in each set of colour and magnitude available in the DES photometric system. In the top-left panel, we also show the colour–magnitude polygons used to select stars consistent with a young/intermediate (dot–dashed polygon) and old (solid polygon) stellar population. The boxes (dashed) used for the selection of RC stars are shown in all panels.
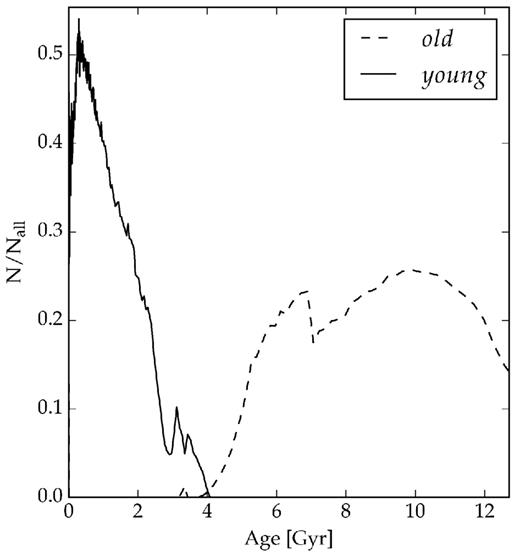
Ratio of the number of young ( old) to all stars as a function of age. The ratio was computed using a constant SFR and a Piatti & Geisler (2013) AMR.
Using a trilegal (Girardi et al. 2005) simulation, we modelled the expected MW stellar population in the SPT-E region. Assuming the same colour cuts as the ones used to select the three stellar populations quoted above, we fit the density of stars as a function of RA and Dec using a third-order polynomial, f(α, δ). The best-fitting polynomial for each of the stellar populations cuts is later used to account for foreground contamination while fitting the LMC disc. This polynomial is scaled by ρBG since the colour–magnitude cuts are not perfectly consistent with the theoretical prediction of trilegal.
To count stars in the sky plane, we adopt the healpix pixelization scheme with Nside = 512 which yields a constant pixel area across the sky of ∼0.013 deg2. The maps built in this scheme for each stellar sample described above are shown in the left-hand panel of Figs 6 –8.
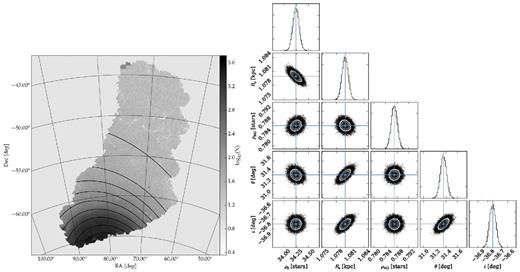
Left-hand panel: map showing the number of stars from the all sample in grey-scale. The stars used to build this map are those that fall inside a simple colour cut of −0.5 < g − r < 1.0 and g < 23. The solid isodensity contours show the best exponential disc model. The contours start at log10(N) = 3.3 and progress in steps of 0.3 dex. Right-hand panels: the marginalization for the different disc model pairs of parameters. The solid blue cross-hair shows the position of the best solution. The contours show the 1σ, 2σ, and 3σ confidence levels. The histograms in the diagonal panels show the marginalization over each single parameter. Again the blue line shows the point of maximum likelihood.
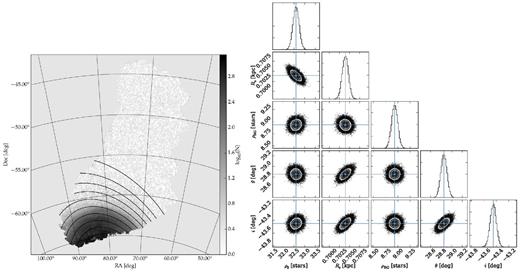
Similar to Fig. 6 but for the young stellar population. The isodensity contours start at log10(N) = 2.9 and progress in steps of 0.4 dex.
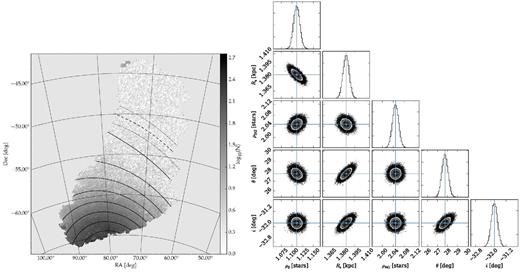
Similar to Fig. 6 but for the old stellar population. The isodensity contours start at log10(N) = 2.5 and progress in steps of 0.35 dex. In the left-hand panel, we also show the truncation radius (Rt) position as the dashed contour, and the dotted contours show the uncertainty in Rt.
The best-fitting disc model was obtained through a Markov Chain Monte Carlo (MCMC) technique. We used the code emcee (Foreman-Mackey et al. 2013) in its version 2.0.0. The test statistics chosen is a binned Poisson log-likelihood model (Dolphin 2002). We refer the reader to these authors for details on the MCMC and statistics used. This is the most appropriate test statistics for data-model comparison since we are dealing with counts that are subject to shot noise, especially in the outermost regions of the LMC. Our MCMC run uses a total of 30 walkers that make 1000 steps each for the burn-in phase. After the burn-in, we let the walkers advance 5000 more steps each, sufficient to well sample the parameter space and converge to the maxima.
This fitting procedure was repeated for each stellar population (all, old and young), yielding the parameters shown on Table 3. In this table, we chose to present the PA of the line of nodes θ0 = θ + 90°. This is the quantity most often presented in the literature.
A summary of the best-fitting disc models parameters for each stellar population. The uncertainties are the 3σ confidence level that arises from the MCMC analysis. The uncertainties in parenthesis are obtained from the difference between the fit with and without correcting the magnitudes by the heliocentric distance to each point of the LMC disc. NOTE: our definition of inclination (i) has the opposite sign than what is typically found in the literature.
| Population . | Age . | θ0 . | i . | Rs . | ρ0 . | ρBG . |
|---|---|---|---|---|---|---|
| . | (Gyr) . | (deg) . | (deg) . | (kpc) . | (stars pixel−1 kpc−2) . | . |
| All | – | 129.51 ± 0.17(±1.08) | −38.14 ± 0.08(±1.59) | 1.09 ± 0.01(±0.02) | 26.41 ± 0.14(±0.59) | 0.80 ± 0.03(±0.67) |
| Young | 0–4 | 125.93 ± 0.20(±0.09) | −44.19 ± 0.14(±1.80) | 0.72 ± 0.01(±0.00) | 22.86 ± 0.28(±1.33) | 9.06 ± 0.18(±0.00) |
| Old | 4–13 | 127.40 ± 1.02(±0.59) | −32.94 ± 0.39(±1.25) | 1.41 ± 0.01(±0.00) | 0.89 ± 0.02(±0.05) | 2.08 ± 0.04(±0.01) |
The boxes chosen to select a given stellar population in the colour–magnitude diagram (CMD) assume that the stars are all at the same distance to us. This is not strictly the case for the LMC stars, which are spread across a disc plane inclined relative to the sky plane. To test how this distance spread affects our disc fit, we correct the magnitude of each star using the best-fitting disc models so as to bring the stars to a common distance. This common distance is chosen as the mean distance to the disc in the SPT-E. Using these distance corrected magnitudes we perform the CMD box selections again. For all the CMD based selections an increase of <1 per cent in the number of stars inside the CMD box is observed. Using this distance corrected sample we rerun the fitting procedure and find that the largest change in the parameters is a 5 per cent increase in the inclination. The remaining disc parameters are more stable. We adopt the difference on the parameters found in this experiment as the systematic uncertainty in our parameter estimation. We show these variations as the uncertainties in parenthesis in Table 3.
The left-hand panel of Fig. 6 a healpix map in Gnomonic projection shows the logarithm of the number of stars for the all stellar population. Overplotted we show the best-fitting disc model as isodensity lines. On the right-hand side of the figure, we show the sampled probability distribution function for each parameter after marginalization. In light blue we mark the point of maximum probability density, which indicates the maximum likelihood solution. Note that the samples are distributed in a fairly symmetric way around the maxima, yielding symmetric error bars. Figs 7 and 8 are similar to the figure described above, but showing different age-selected populations.
We notice that the old population spreads out to declinations of ∼−55°, while the young population is much more abruptly truncated at ∼−60°. This points to different scale radii for these populations. In Table 3, we give a summary of the parameters that best fit each case. Here, we see that the distributions have significantly different values of Rs while retaining similar values for the purely geometrical parameters θ0 and i.
The difference in the scalelength is much more obvious in Fig. 9 where we show, for each stellar population, the average number of stars per healpix pixel in bins of distance along the LMC disc. We also show the best-fitting disc model for each of the stellar populations, this model includes the MW foreground stars (i.e. the term ρBGf(α, δ) in equation 2). We notice that the old (triangles and dot–dashed line) profile is much more extended than the young one (crosses and dotted line). It is also remarkable that the LMC old density profile is well fit without the need for other components such as a spheroidal halo. However, the young profile is not very well described by the disc model. This could also account for the value found for its inclination, which is not in good agreement with the literature (van der Marel & Cioni 2001; Nikolaev et al. 2004; Rubele et al. 2012). In the same figure, the solid line shows the contribution of MW stars, we notice that the slope in the number of stars at the outskirts of the LMC can be accounted by for the spatial variation in the number of MW field stars. Due to the large number of stars in each radial bin, the Poisson uncertainty is very low. These uncertainties are only visible, as error bars, on the inset plot, where the outer parts of the old population profile is shown.
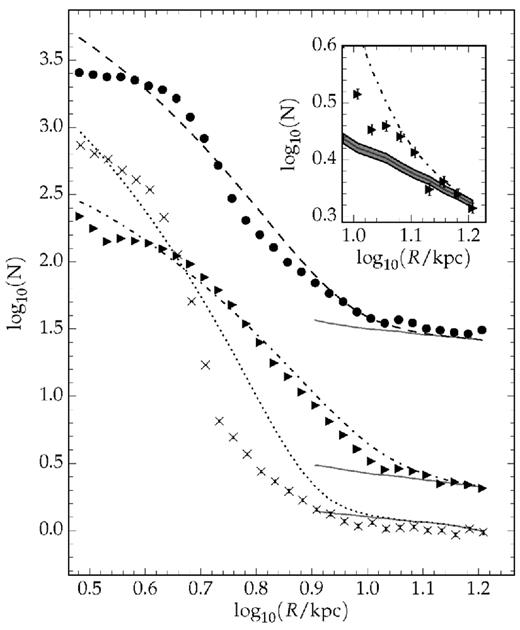
The black circles show the averaged number of stars from the all sample per healpix pixel in different bins of distances along the LMC disc. The triangles (crosses) show the same but for the old (young) sample. The dashed, dot–dashed, and dotted lines show the best-fitting disc model for the all, old, and young populations, including the term ρBGf(α, δ) that accounts for the contamination of MW stars. In the inset plot, we show the outer tail of the old profile. The solid line shows the MW contribution and the shaded region shows its uncertainty, propagated from the uncertainty in ρBG. The error bar represents the Poission uncertainty on the number of counts per bin.
We notice from Table 3 that the statistical uncertainties in the disc parameters are quite small. This is caused by the relatively poor description that our disc model gives of the LMC stellar population, especially the young population. In Fig. 9 this becomes apparent where we observe that the models deviate significantly from the observations, even when the uncertainties are considered. This can point to the case where there are other systematic effects that were not taken into account. One cause of such effects might be the spatial variation of the star–galaxy classifier. However, the classifier adopted here is very stable especially at bright magnitudes (g < 22.5), thus being improbable to be a significant source of error. Also, spatial changes in the completeness of the survey are unlikely to cause a large change in the number of stars per healpix pixel (see Section 3.3). Evidence indicates that the deviations from the fitted disc model are real features of the LMC structure. These features are more apparent for the young stellar population, which is most likely to hold signs of disc perturbations such as spiral arms.
We use the old population profile to probe the total extent of the LMC. We define the truncation radius as the radius where the observed density profile reaches becomes indistinguishable from the MW foreground population. In the inset plot of Fig. 9, we observe that for log (R/kpc) > 1.13 the profile can be explained solely by the MW contribution. The uncertainty on this truncation radius (Rt) is taken as the size of the radial bin, which is 0.8 kpc. This yields a Rt = 13.5 ± 0.8 kpc.
To further support our claim that there are very few LMC stars beyond 13 kpc, we show in Fig. 10 the Hess diagrams at different bins of angular separation from the LMC centre. The upper and lower bound of each bin is indicated in each panel. We apply a simple decontamination algorithm in order to remove the contribution of MW stars. The decontamination was done by selecting a region with angular distance greater than θ = 20°. A Hess diagram of this region was constructed. These Hess diagrams were area weighted and subtracted from the Hess diagram of each angular separation bin shown in Fig. 10. This process assumes that the contribution of LMC stars at angular distances larger than 20° is negligible. We again assume that the MW stellar population varies very little throughout the SPT-E.
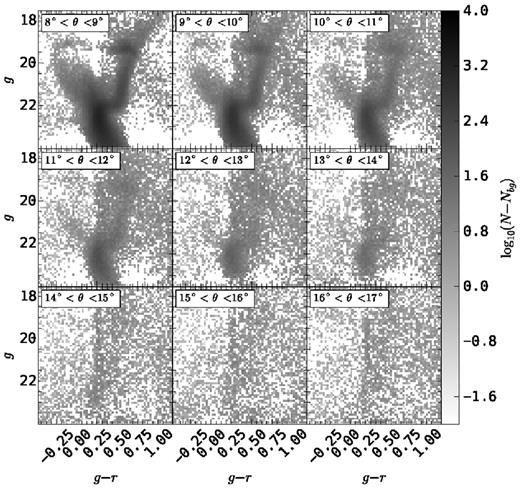
Hess diagrams in g − r versus g for different angular distance ranges (indicated in the top-left of each panel). The contribution from MW stars has been removed as described in the text.
In Fig. 10 we note, from visual inspection, that the LMC population in the bottom central panel is indistinguishable from the noise in the Hess diagram. This panel corresponds to angular separations between 15° and 16°. This range corresponds to distances from 10.5 to 11.2 kpc along the disc plane, which are intermediate between the truncations radius of the old and young population. This does not mean the complete absence of LMC stars. However, it shows that at this range of distances the LMC populations is too low in number to be distinguishable by eye from the MW foreground stars.
With the aid of the galpy2 (Bovy 2010) suite for galactic dynamics, we compute a three component MW potential with an NFW halo (Navarro, Frenk & White 1996), a Miyamoto–Nagai disc (Miyamoto & Nagai 1975), and a Hernquist bulge (Hernquist 1990) following the same recipe as in Bovy et al. (2012). This potential was normalized such as to yield a Solar circular velocity of 220 km s−1 at the Galactocentric distance of 8 kpc. We obtain that the enclosed MW mass inside a sphere centred in the MW with radius dLMC is 5.6 × 10¹¹ M⊙. Using the result from equation (5) and propagating the uncertainties in Rt, we obtain an LMC mass of |$M_{{\rm LMC}} = 2.3^{+0.8}_{-0.6}\times 10^{10} \,\mathrm{M}_{{\odot }}$|.
According to the set of simulations by Kallivayalil et al. (2013), the combination of MW and LMC masses found in this work would favour a scenario where the Magellanic System is in its first pericentric passage. However, it is not clear if there is enough time for the LMC to develop a truncation radius without finishing a complete orbit around the MW and if this truncation would affect its luminous component. We would like to stress that the calculations presented in our work are subject to many uncertainties, especially with respect to our knowledge of the MW mass profile at large distances.
5 THE LMC RC AS A DISTANCE ESTIMATOR
The peak magnitude of the RC is used widely in astronomy as a standard candle to determine distances of old and intermediate age star clusters. RC stars are He-burning stars of mass M ≲ 2 M⊙; they develop an electron degenerate core after the main sequence, and as a consequence have to increase their core up to a critical mass of ∼0.46 M⊙ before helium can be ignited. The almost-constancy of their helium-core masses determines that they all share similar (but not constant) luminosities in their central helium burning phase.
If one is to determine μ0, the terms Aλ and |$\Delta M_{\lambda }^{{\rm RC}}$| must be inferred. Here, we choose to correct the magnitudes for extinction using the Schlegel, Finkbeiner & Davis (1998) dust maps. For the time being we will assume that |$\Delta M_{\lambda }^{{\rm RC}}$| is zero. This assumption will be addressed in more detail later.
To probe μ0 as a function of position in the LMC, we subdivided the sky in healpix pixels using the pixelization scheme with Nside = 128. This gives a pixel area of ∼0.21 deg2. We choose a larger pixel than the previous section since the RC is much less populated than the main sequence. To measure the peak apparent magnitude of the RC in a given passband (|$m_{\lambda }^{{\rm RC}}$|), we compute the number count of stars as a function of magnitude (N(mλ)) for stars that have colours and magnitudes limited by the dashed boxes in Fig. 4. The CMD region occupied by RC stars was selected visually.
The uncertainty on |$m_{\lambda }^{{\rm RC}}$| is taken from the covariance matrix of the least-square fit.
It is convenient to define the heliocentric distance to points in the LMC disc as a function of the so called line of maximum distance gradient. This line connects points on the disc plane with the most rapidly varying distance from us, hence its name. The distance along this line is the deprojected distance between a point in the disc to the line of nodes. The distances along this line are given by the y component of equation (A3) of Weinberg & Nikolaev (2001). The line of maximum distance gradient has a PA given by θ (equation 2) and it is oriented approximately in the NE–SW direction. Showing the heliocentric distance to points in the LMC disc as a function of the position in the line of maximum distance gradient is the equivalent of showing an edge-on view of the LMC.
To infer the absolute magnitude of the RC |$(M_{\lambda }^{{\rm RC}}),$| we could adopt the prediction from synthetic stellar populations based on stellar evolution models. However, simulations using parsec (Bressan et al. 2012) models agree well with the disc models found in this work. A small magnitude offset can be seen in Fig. 11, where the solid black line shows the best-fitting disc model and the grey points are the inferred distance modulus based on theoretical values of |$M_{\lambda }^{{\rm RC}}$|.
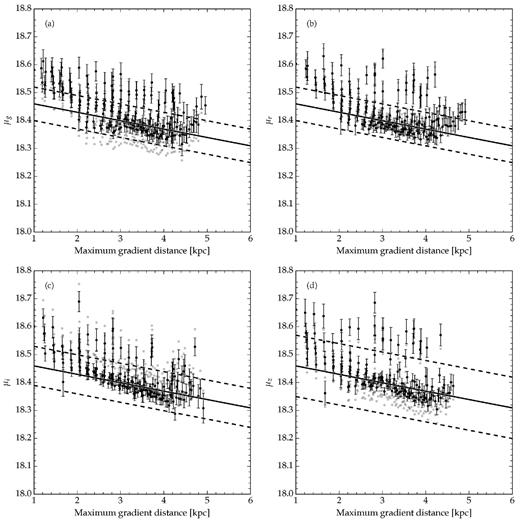
The distance modulus as a function of the distance along the maximum gradient line (∼ NE–SW). The black circles are the measured distance modulus in each healpix pixel, as describe in the text. The error bars shows the 1 σm for each measured point. The solid line shows the behaviour expected from the best-fitting disc model for the all population. The dashed line shows the maximum magnitude variation expected from populations mixing effects. The grey points are the distance modulus inferred using the theoretical RC absolute magnitude. Panels a, b, c, and d show the distance modulus determination using the filters g, r, i, and z, respectively.
Despite the small offset in the theoretical value of |$M_{\lambda }^{{\rm RC}}$|, we chose to determine |$M_{\lambda }^{{\rm RC}}$| by matching the expected distance modulus from our best-fitting disc model to the observed values of the RC peak magnitude. This matching was done using stars that are between 3 and 4 kpc along the LMC line of maximum distance gradient. We compute the median value of mλ in this distance range and subtract from that the heliocentric distance expected from the disc model at 3.5 kpc from the LMC centre. This offset is determined for all passbands. The value obtained is then used to compute the RC-based distances consistently with our disc model. These distances are shown as the black points in Fig. 11 and the error bars are propagated from the RC peak fit.
In Fig. 12, we show the distributions of |$m_{\lambda }^{{\rm RC}}$| on the sky, for λ = g, r, i, z. The lines show the direction of maximum gradient and the line of nodes obtained from our best disc model fit using the all stellar population. We notice that the entire sampled region in this work is on the same side (near side) of the LMC disc major axis. There is a global trend in the sense that for all passbands the nearest points to us are located in the north-east edge of the LMC. Another remarkable feature present in all maps is that the north edge of the LMC is systematically more distant than what is expected for the disc model. This effect is noticeable in all passbands.
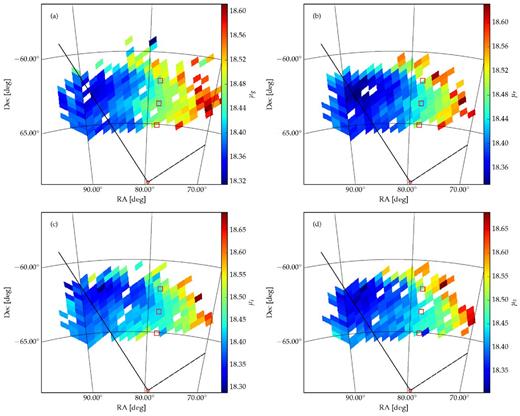
Gnomonic projection of Nside = 128 maps showing the distance modulus measured in each the g, r, i,and z passband. On every panel the solid line shows the direction of the maximum distance gradient (θ) and the dashed line the direction of the line of nodes (θ0) expected from the best-fitting disc model for the all population. The red squares are the fields studied by Meschin et al. (2014). The red circle is the LMC centre adopted in this work. Panels a, b, c, and d show the distance modulus determination using the filters g, r, i, and z, respectively.
The discrepancies observed in the maps described above may be due to population mixing in RC stars. The RC luminosity depends slightly on the age and metallicity of the stars (Girardi 1999; Girardi & Salaris 2001). This fact makes the RC of a stellar population older than ∼3 Gyr dimmer as a function of age. The exact amount of dimming depends on the metallicity and on the passband used. A detailed discussion about how the RC magnitude of simple stellar populations varies with age and metallicity may be found in Girardi & Salaris (2001).
In the case of the LMC, we would like to know how the RC magnitude changes as a function of the SFH, therefore mapping |$\Delta M_{\lambda }^{{\rm RC}}$| at different positions in the LMC. However, it is known that the LMC SFH is very complex and varies spatially (Meschin et al. 2014), therefore rendering this a very difficult task.
To assess the amplitude of the populations mixing effect over the RC magnitudes, we conducted a series of synthetic stellar population experiments. These simulations assume that the LMC follows an AMR given by Piatti & Geisler (2013) with a spread of 0.15 dex in [Fe/H]. We also assume that stars in the LMC follow a Kroupa initial mass function (Kroupa 2001). To generate synthetic magnitudes for a set of simulated stars we adopt the parsec (Bressan et al. 2012) isochrones in the DES photometric system. Our grid of models has a step of 0.01 in log10(age/yr) and 0.0002 in Z in the range [0.0002, 0.001] and 0.001 for Z in the range [0.001, 0.020]. Photometric uncertainties were included according to equation (1) and Table 2. The simulations were made in the framework of the open-source code gencmd.3
We adopt three SFHs that are modelled according to what has been found by Meschin et al. (2014) for the outer regions of the LMC (red squares in Fig. 12). The simulated SFHs contain two events of star formation that were modelled as Gaussian peaks in SFR. The young peak is centred on an age of 2.5 Gyr with a width of 1 Gyr, while the second is centred on 9 Gyr with a width of 1.5 Gyr. The first adopted SFH gives equal amplitude to each star forming event, the second gives twice the amplitude to the older event, and the third gives twice the amplitude to the younger event. The largest difference for the RC peak magnitude was observed between the models with asymmetric peaks in the SFH. We use this difference to estimate the maximum value for |$\Delta M_{\lambda }^{{\rm RC}}$| which was found to be 0.06, 0.06, 0.07, and 0.11 for g, r, i, z, respectively. The dashed lines in Fig. 11 show the maximum expected deviations due to populations mixing effects.
We notice that the RC distance variations are very similar to the one expected from the best-fitting disc model. However, there are very discrepant points that the disc model cannot account for, even when population mixing effects are considered. We also notice that the distance moduli determined using different passbands are consistent.
In Fig. 13, we show σdepth as a function of the distance along the LMC disc. The error bars are taken from the covariance matrix obtained on the least-square fit of the RC distribution as given by equation (7). We took averages of σdepth in bins of 0.5 kpc, which are shown as the black circles. The error bar is the standard deviation of the values of σdepth in each distance bin. For distances less than ∼4.5 kpc, we observe a constant depth of ∼0.08 mag (1.8 kpc) measured in r, i, and z while the g band yields a value of 0.12 mag (2.8 kpc). The depth in r, i, and z passbands tends to increase by ∼0.02 mag (∼0.5 kpc) towards the edge of the LMC. The slight difference in the g band depth might be due to the underestimate of the intrinsic RC magnitude spread. This effect may be due to changes in the metallicity of the LMC field populations torwards its edge (Majewski et al. 2009), leading to the formation of a horizontal branch instead of a RC. The g band is more affected since it is more sensitive to hotter stars.
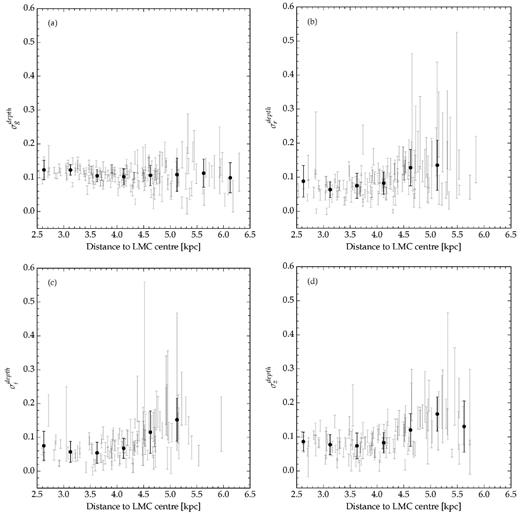
Disc depth as a function of distance to the LMC centre. The grey error bars show the σdepth measured for each healpix pixel shown on Fig. 12. The dark circles are the average over 0.5 kpc and the error bar the standard deviation. Panels a,b,c, and d are for determinations using the filters g, r, i, and, z respectively.
6 DISCUSSION AND SUMMARY
To the best of our knowledge, this paper is the first to show a clear distinction in the structure of the LMC disc for stellar populations of different ages. Meschin et al. (2014) report signs of an age gradient, but did not derive the structural properties for different age components of the LMC. Previous studies, based on large spectroscopic samples, reported a clear kinematic distinction between different stellar types and attributed that to an age difference in their samples (van der Marel, Kallivayalil & Besla 2009, and references therein). Here, we confirm this distinction based only on stellar photometry alone.
The disc models obtained in this work are in agreement with what has been reported in the literature (e.g. Weinberg & Nikolaev 2001; Nikolaev et al. 2004; Saha et al. 2010; Rubele et al. 2012). We observe a significant difference between disc models fitted using stars younger and older than 4 Gyr. The most striking difference is found in the scalelength (Rs), which suggests a star formation that follows the outside-in paradigm. The summary of the disc models parameters can be found in Table 3.
The young population is poorly described by an exponential disc model. It presents a prominent feature that strongly deviates from an exponential profile truncated at ∼8 kpc. The young and old LMC disc have a clear distinction in the level of substructures. The younger stars are known to have peculiar spiral arms that have most likely been formed in the last SMC–LMC encounter (Staveley-Smith et al. 2003; Olsen & Massey 2007; Bekki 2009). This could explain why the young disc cannot be well described by our disc model.
On the other hand, the old disc extends over ∼13 scalelengths. Our results for the scalelength and truncation radius are similar to what Saha et al. (2010) found. The authors report Rs ≃ 1.15 and a truncation radius that is ∼12 times this value, which is very similar to our determination. If we assume that the truncation radius of the old disc is caused by the tidal field of the MW, we obtain an LMC mass that is |$M_{{\rm LMC}} = 2.3^{+0.8}_{-0.6} \times 10^{10} \,\mathrm{M}_{{\odot }}$|. This mass is strongly dependent on the efficiency with which the MW potential tidally truncates the LMC stellar distribution. Even if the Clouds are in their first pericentric passage, their orbit is predicted to be past the pericentre, which could allow the formation of a tidal limit (Besla, private communication). Also, (Gan et al. 2010) showed that subhaloes in their first pericentric passage may undergo substantial mass loss. We also point out that in the case where the MW tidal field efficiently strips the dark matter and luminous components, our estimate of the LMC mass is reliable. However, in the case where dark matter is still present in an extended halo, our estimate of the LMC mass sets only a lower limit. The absolute mass value is also dependent on the MW mass profile, but the relative LMC to MW encircled mass is not. New more precise determinations of the MW mass in its outer regions will help to more accurately constrain the LMC mass.
The dynamical mass determination by van der Marel & Kallivayalil (2014) suggests MLMC(R < 8.7 kpc) = (1.7 ± 0.7) × 1010 M⊙ that can be extrapolated to the mass inside our truncation radius of MLMC(R < Rt) = (3.5 ± 1.4) × 1010 M⊙ assuming a flat rotation curve. This value is within the error bars of our mass determination, suggesting that the truncation radius found in this work has a tidal origin.
Through the fit of the RC peak magnitude, we observe that a few regions coherently grouped in the north of the LMC are systematically more distant than what is expected by an inclined circular disc model. While Olsen & Salyk (2002) found that regions of the south-east LMC are systematically closer, we find that the northern LMC disc behaves in the opposite sense. This is the classic case for a galaxy with warped disc. We demonstrate, through the use of synthetic stellar population models, that the offsets from the disc model are larger than what is expected from population mixing effects.
Using the same synthetic stellar populations quoted above, we are able to compute the theoretical magnitude scatter of RC stars. This allows us to disentangle the contribution of the intrinsic scatter from the one caused by the disc thickness. We measure a thickness ranging from 1.8 to 2.8 kpc in the inner parts of the LMC and which increases by 0.5 kpc in its outer parts. If we assume that the disc follows an exponential profile in height, we obtain that the scaleheight ranges from 1.3 to 1.9 kpc, increasing by 0.3 kpc in the outer parts. This slight increase towards the outskirts can be interpreted as the flaring of the disc. van der Marel & Cioni (2001) argue that this kind of behaviour is expected if the LMC disc is tidally perturbed by the MW potential. The disc thickening may also be explained solely by LMC dynamical models (Besla et al. 2012), where the old stellar component is expected to form a dynamically hotter component. The fact that we only observe it on the edge of the LMC may be due to the steep truncation of the young disc, allowing us to measure a thickness that is dominated by the old population only in the LMC outskirts.
The analysis presented in this work points to a scenario where there are two distinct disc components in the LMC. One is composed of old stars (>4 Gyr) and possesses a smooth, extended profile out to dozens of scalelengths. The second component is composed of younger stars (<4 Gyr) and appears to be perturbed and much less extended. We find signs of warp and flare towards the outskirts of the LMC, both of which have been reported previously (Olsen & Salyk 2002; Subramaniam & Subramanian 2009).
An alternative scenario for the disc warp and flare is the existence of a hot halo composed of old stars, while the disc could contain both populations. Because the old population is more spatially extended, this scenario would explain the outward increase in the thickness of the RC as the young disc fades, therefore accounting for the ‘flare’ signal. Besides the flaring, the old spheroidal component would lead to a systematic variation on the heliocentric distances across the LMC in the sense of bringing them closer to the heliocentric distance of the LMC centre on both sides of the galaxy, also mimicking a warp effect.
The fact that the old disc is well fitted by a single exponential disc favours the scenario where there is no detectable stellar halo and older stars form a thicker disc. Also the fact that the hot halo has only been possibly detected in the central regions of the LMC (Minniti et al. 2003) raises doubts about the existence of such a stellar component. To investigate the existence of a halo component, a more detailed study must be carried out in the LMC outskirts in order to isolate its extremely sparse stellar population. This kind of study should employ more sophisticated CMD decontamination methods such as the ones used to detect streams and tidal tails (Rockosi et al. 2002).
The upcoming years promise to greatly increase our understanding of the Magellanic system. With the data already observed during the DES SV campaign, we have the ability to study a vast number of LMC star clusters and their three-dimensional distribution in the galaxy. The field LMC population may also be used to infer a very detailed, and spatially dependent SFH.
Upcoming DES observations will cover a large portion of the Magellanic Stream allowing for the discovery and characterization of its stellar component, if it exists. Additionally, DES will continue to map the outskirts of the LMC and SMC. This novel data set will certainly reveal some of the many puzzles of the Magellanic system.
This paper has gone through internal review by the DES collaboration.
We are grateful for the extraordinary contributions of our CTIO colleagues and the DECam, Commissioning and Science Verification teams in achieving the excellent instrument and telescope conditions that have made this work possible. The success of this project also relies critically on the expertise and dedication of the DES Data Management group.
Funding for the DES Projects has been provided by the US Department of Energy, the US National Science Foundation, the Ministry of Science and Education of Spain, the Science and Technology Facilities Council of the United Kingdom, the Higher Education Funding Council for England, the National Center for Supercomputing Applications at the University of Illinois at Urbana-Champaign, the Kavli Institute of Cosmological Physics at the University of Chicago, Financiadora de Estudos e Projetos, Fundação Carlos Chagas Filho de Amparo à Pesquisa do Estado do Rio de Janeiro, Conselho Nacional de Desenvolvimento Científico e Tecnológico and the Ministério da Ciência e Tecnologia, the Deutsche Forschungsgemeinschaft and the Collaborating Institutions in the Dark Energy Survey.
The Collaborating Institutions are Argonne National Laboratory, the University of California at Santa Cruz, the University of Cambridge, Centro de Investigaciones Energeticas, Medioambientales y Tecnologicas-Madrid, the University of Chicago, University College London, the DES-Brazil Consortium, the Eidgenössische Technische Hochschule (ETH) Zürich, Fermi National Accelerator Laboratory, the University of Edinburgh, the University of Illinois at Urbana-Champaign, the Institut de Ciencies de l'Espai (IEEC/CSIC), the Institut de Fisica d'Altes Energies, Lawrence Berkeley National Laboratory, the Ludwig-Maximilians Universität and the associated Excellence Cluster Universe, the University of Michigan, the National Optical Astronomy Observatory, the University of Nottingham, The Ohio State University, the University of Pennsylvania, the University of Portsmouth, SLAC National Accelerator Laboratory, Stanford University, the University of Sussex, and Texas A&M University.
The DES participants from Spanish institutions are partially supported by MINECO under grants AYA2009-13936, AYA2012-39559, AYA2012-39620, and FPA2012-39684, which include FEDER funds from the European Union.
DG was supported by SFB-Transregio 33 ‘The Dark Universe’ by the Deutsche Forschungsgemeinschaft (DFG) and the DFG cluster of excellence ‘Origin and Structure of the Universe’.
JZ acknowledges support from the European Research Council in the form of a Starting Grant with number 240672.


