


Abstract
We have developed and implemented an iterative algorithm of flux calibration for the LAMOST Spectroscopic Survey of the Galactic anticentre (LSS-GAC). For a given LSS-GAC plate, the spectra are first processed with a set of nominal spectral response curves (SRCs) and used to derive initial stellar atmospheric parameters (effective temperature Teff, surface gravity log g and metallicity [Fe/H]) as well as dust reddening E(B − V) of all targeted stars. For each of the 16 spectrographs, several F-type stars with good signal-to-noise ratios are selected as flux standard stars for further, iterative spectral flux calibration. Comparison of spectrophotometric colours, deduced from the flux-calibrated spectra, with the photometric measurements yield average differences of 0.02 ± 0.07 and −0.04 ± 0.09 mag for (g − r) and (g − i), respectively. The relatively large negative offset in (g − i) is because we have opted not to correct for the telluric bands, most notably the atmospheric A band in the wavelength range of the i band. Comparison of LSS-GAC multi-epoch observations of duplicate targets indicates that the algorithm has achieved an accuracy of about 10 per cent in relative flux calibration for the wavelength range 4000–9000 Å. The shapes of SRCs deduced for individual LAMOST spectrographs vary by up to 30 per cent for a given night, and larger for different nights, indicating that the derivation of SRCs for the individual plates is essential to achieve accurate flux calibration for the LAMOST spectra.
1 INTRODUCTION
The LAMOST Spectroscopic Survey of the Galactic anticentre (LSS-GAC; Liu et al. 2014) is a major component of the ongoing Galactic spectroscopic surveys with the Large Sky Area Multi-Object Fibre Spectroscopic Telescope (LAMOST, also named the Guo Shoujing Telescope; Cui et al. 2012). LSS-GAC will collect millions of spectra of Galactic stars of all colours in a contiguous sky area of about 3400 square degrees centred on the Galactic anticentre (GAC), from Galactic longitude 150° to 210° and latitude from −30° to +30°. It will yield a statistically complete sample of stars with accurate stellar parameters, including radial velocity (Vr), effective temperature (Teff), surface gravity (log g) and metallicity ([Fe/H]), to an unprecedented sampling depth and density to reveal the formation and evolution history of the Milky Way. Preceded by one-year-long Pilot Surveys, the LAMOST Regular Surveys were initiated in 2012 October.
Obtaining an accurate calibration of the stellar spectral energy distribution (SED) is a prerequisite for robust stellar spectral classification and reliable stellar (atmospheric) parameter determination, and is thus an essential step to the fulfilment of the scientific goals of LSS-GAC. The recorded spectral signal as a function of wavelength for a star is affected by a number of processes that occur between the star and observer, including the interstellar and Earth atmospheric extinction and the spectral throughput of the telescope and instruments. The purpose of the so-called spectral flux calibration is to obtain accurate stellar SEDs above the Earth atmosphere, and this involves the characterization and removal of the atmospheric and instrumental effects as a function of wavelength. The effects of extinction by the interstellar dust grains are typically left to a later stage of the analysis, as they vary from star to star (Chen et al. 2014a; Yuan et al. 2014).
In astronomical spectroscopy, spectral flux calibration of target objects is generally achieved by obtaining separate measurements of spectrophotometric standard stars (e.g. Oke 1990; Hamuy et al. 1992, 1994) on the same night with the same instrumental set-up. For modern large-scale multiplex spectroscopic surveys employing multiple spectrographs and hundreds of fibres, obtaining separate measurements of standard stars for each night and each spectrograph and fibre is extremely costly in terms of observing time and essentially impossible, and a different strategy has to be adopted. For the Sloan Digital Sky Survey (SDSS; York et al. 2000), which primarily targets extragalactic objects at high Galactic latitudes that suffer from relatively small interstellar extinction, F turn-off stars within the field of view (FoV), preselected based on the photometric colours and observed simultaneously with the targets, are used to calibrate the spectra (Stoughton et al. 2002; Yanny et al. 2009), assuming that the intrinsic SEDs of F turn-off stars are well determined by the theoretical stellar atmospheric models and the effects of the interstellar extinction can be characterized and removed using the all-sky extinction map of Schlegel, Finkbeiner & Davis (1998; SFD98 hereafter). For LAMOST, Song et al. (2012) have proposed a method to calibrate the spectra. However, their method does not incorporate dereddening of the flux-calibration standard stars, thus cannot be applied to high extinction regions. For LSS-GAC, since the majority of targets are disk stars at low Galactic latitudes in the direction of GAC, the targets are subject to significant unknown amounts of interstellar extinction. As such, it is difficult to preselect flux-calibration standard stars based on the photometric colours alone. Ideally, one can use the spectral response curves (SRCs) deduced from high Galactic latitude fields observed on the same night. However, as we shall show later in the current work, the SRCs of the individual LAMOST spectrographs vary significantly not only from night to night, but also in a given night.
Fortunately, one primary goal of LSS-GAC is to sample stars of all colours (spectral types). For this purpose, a simple yet non-trivial target selection algorithm is developed where sample stars are uniformly selected spatially as well as on the (r, g − r) and (r, r − i) Hess diagrams (Liu et al. 2014; Yuan et al. 2015). Thus, for each FoV observed, there are always some stars targeted that are suitable for spectral flux calibration, including F turn-off stars, in spite of the fact that they cannot be easily identified photometrically due to the effects of interstellar reddening.
In this work, we have developed and implemented an iterative algorithm to derive SRCs and calibrate the flux of the LSS-GAC spectra. We start with wavelength-calibrated, flat-fielded and sky-subtracted one-dimensional (1D) spectra processed with the LAMOST two-dimensional (2D) pipeline (Luo et al. 2012; Bai et al. 2015), and aim to obtain accurately flux-calibrated spectra recorded in both the blue and red arms of spectrographs. We concentrate on the relative rather than absolute flux calibration. Given good relative spectral flux calibration, absolute calibration can be achieved by scaling the spectra to broad-band photometric measurements. We estimate the accuracy of our method by comparing with the results from multi-epoch observations of duplicate targets, as well as by comparing stellar colours yielded by the calibrated spectra with those from the photometric measurements. SRCs deduced for individual plates observed on different nights are compared to investigate the possible variation of SRCs with time, which is useful for improving the flux calibration of LAMOST spectra. LSS-GAC spectra calibrated with our method are used by the LAMOST Stellar Parameter Pipeline at Peking University (LSP3; Xiang et al. 2015, hereafter XLYH15) for determinig stellar parameters. The spectra have also been used to search for white dwarfs and white dwarf/main sequence binaries (Rebassa-Mansergas et al. 2015 ; Ren et al. 2014). Following the data policy of LAMOST surveys, the calibrated spectra in FITS format will be publicly available as value-added products along with the first data release of LAMOST (LAMOST DR1; Bai et al. 2015), currently scheduled for 2014 December. This can be accessed via http://lamost973.pku.edu.cn/site/node/4, along with a description file.
The paper is organized as follows. In Section 2, we present our flux-calibration algorithm. The results and discussions are presented in Section 3. Section 4 is the summary.
2 METHODOLOGY
LAMOST,1 also known as the Wang-Su Reflecting Schmidt Telescope or Guo Shoujing Telescope, is a new type of wide-field telescope with a large aperture. It has an effective aperture of ∼4 m and a (circular) FoV of 5° in diameter (Wang et al. 1996; Cui et al. 2012). At the focal plane, 4000 robotic optical fibres with an entrance aperture of 3.3 arcsec projected on the sky, relay the light to 16 low-resolution spectrographs, 250 fibres each. To increase the spectral resolution, slit marks of width two-thirds the fibre diameter are used, yielding a resolving power of R ∼ 1800 (Deng et al. 2012; Liu et al. 2014). Each spectrograph has two arms to collect the collimated light beam. The wavelength coverage is 3700–5900 Å in the blue arm and 5700–9000 Å in the red arm. The final spectra cover the wavelength range from 3700 to 9000 Å. In each arm of a given spectrograph, a 4K × 4K CCD, with a squared pixel size of 12 μm, is used to record the light signal (Cui et al. 2012). One CCD pixel corresponds to about 0.56 Å in the blue, and about 0.82 Å in the red.
Raw data from LSS-GAC are first processed with the LAMOST 2D pipeline (Bai et al. 2015), which includes fibre tracing, wavelength calibration, flat-fielding and sky subtraction, to produce wavelength-calibrated, flat-fielded and sky-subtracted 1D spectra. The flux of the spectra are then calibrated via the process introduced in the current work. Note that in both the default LAMOST 2D pipeline and in the flux-calibration algorithm presented here, the data are reduced spectrograph by spectrograph.
2.1 Overview
The flux calibration of LSS-GAC spectra is implemented with an iterative process. As mentioned above, we start with the wavelength-calibrated, flat-fielded and sky-subtracted 1D spectra. A flowchart of the flux calibration is illustrated in Fig. 1. For a given plate, which includes data collected from 32 CCDs of the 16 spectrographs, the uncalibrated 1D spectra are first processed with a set of nominal SRCs, deduced from observations of high Galactic latitude fields adopting F turn-off stars as standards, following the practice of SDSS. The resultant spectra are then used to derive first estimates of the stellar parameters (Vr, Teff, log g and [Fe/H]) for all stars targeted by the plate using LSP3 (XLYH15). Based on the deduced stellar parameters, for each of the 16 spectrographs, several F-type stars with good spectral signal-to-noise ratios (SNRs) and well-determined parameters are selected as flux-calibration standards, which are then used to derive an updated set of SRCs by comparing their observed spectra with synthetic ones interpolated to the corresponding parameters using the spectral library of Munari et al. (2005). In deriving the SRCs, piecewise low-order polynomials are used to fit the ratios of the observed and synthetic spectra, with the latter reddened with a colour excess E(B − V) estimated by comparing the measured and synthetic photometric colours, assuming the Fitzpatrick (1999) extinction law for a total to selective extinction ratio RV = 3.1. Once calibrated, the blue- and red-arm spectra are pieced together, and spectra from consecutive individual exposures are co-added. Spectra thus reprocessed using the newly derived SRCs are then used to update the stellar parameter estimates, and the above process is repeated. Typically, the results (e.g. as represented by the stellar parameters yielded by the processed spectra) converge after two or three iterations. Note that since each spectrograph covers a FoV of approximately 1 deg only, we have ignored the small differences of atmospheric extinction for individual stars within the FoV of the spectrograph. The errors thus introduced to the SEDs are less than ∼2 per cent for the whole spectral wavelength range even for a zenith distance of 60 deg (airmass ∼2.0).
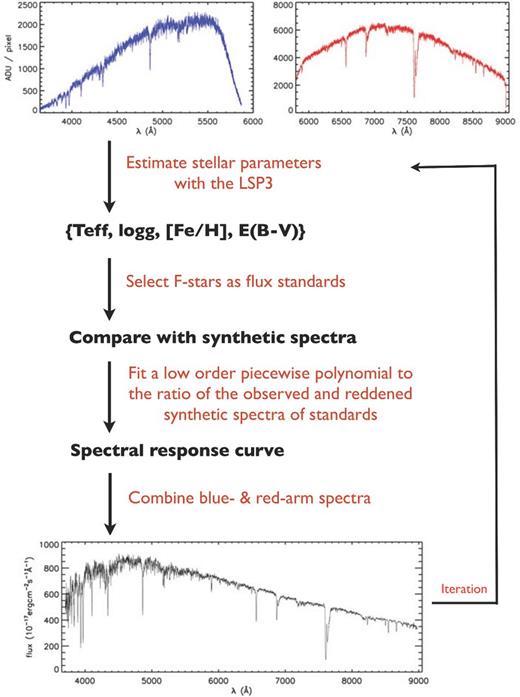
Flowchart of flux calibration.
2.2 Stellar atmospheric parameters
As outlined above, we calculate the intrinsic SEDs of standard stars by interpolating the spectral library of Munari et al. (2005) to the desired stellar atmospheric parameters, i.e., Teff, log g and [Fe/H], of the stars. The accuracy of the stellar atmospheric parameters, in particular Teff, which determines the shape of the stellar SED, thus has a direct impact on the accuracy of the deduced SRCs. We determine the stellar atmospheric parameters from the spectra using LSP3, which derives the parameters by matching the target spectra with the MILES library (Sánchez-Blázquez et al. 2006). As discussed in detail in XLYH15, for FGK stars, an accuracy of 150 K, 0.25 dex and 0.15 dex has been achieved by LSP3 for Teff, log g and [Fe/H], respectively, given a spectral SNR higher than 10. Note that as in XLYH15, unless specified otherwise, the SNR of a spectrum refers to the median value per pixel for the wavelength range 4600–4700 Å. For LAMOST spectra, one pixel at 4650 Å corresponds to 1.07 Å. For Teff between 5750 and 6750 K, the temperature range for most F stars, an uncertainty of 150 K in Teff leads to a maximum error in the shape of the SED of the star of 9 and 3 per cent for the wavelength ranges covered by the blue and red-arm spectra, respectively, and a maximum error of 12 per cent for the whole wavelength range. The errors introduced by the uncertainties in log g and [Fe/H] are marginal, of the order of 1 per cent, and thus can generally be ignored.
2.3 Standard stars
For each of the 16 spectrographs, we select stars with 5750 ≤ Teff ≤ 6750 K, log g ≥ 3.5 (cm s−2) and −1.0 ≤ [Fe/H] ≤ 0.5 dex as flux-calibration standards. The atmospheric parameters of such stars are well determined by LSP3 (XLYH15) and their intrinsic SEDs are well modelled by the stellar atmospheric models. Because of the large number of fibres (4000) of LAMOST and the target selection algorithm employed by LSS-GAC (randomly and uniformly on the colour-magnitude Hess diagrams; Liu et al. 2014; Yuan et al. 2015), in almost all cases there are sufficient stars within the above parameter space that are targeted in a given spectrograph and thus can be used as flux-calibration standards. Fig. 2 shows the distribution of the number of standards per spectrograph, as well as the distribution of Teff of the selected standard stars, for 602 spectral plates collected by 2013 June. Most of the plates are from LSS-GAC except for a few from the Galactic spheroid survey (Deng et al. 2012), which are used for comparing the SRCs of plates for high and low Galactic latitudes. The figure shows that 71 per cent of the spectrographs have more than four standard stars, and only ∼13 per cent of them have less than three standards. Note we have set an upper limit of 10 standards per spectrograph. The number of usable standard stars are in general limited by the SNRs. Plates with few usable standards are either medium or faint plates (Liu et al. 2014; Yuan et al. 2015), observed under unfavourable weather conditions, such that the plates have not reached the desired SNRs. We have set a floating SNR cut-off when selecting standards to achieve a balanced number of stars. More than 90 per cent of the selected standards have SNR higher than 15 for a single exposure (most observations consist of two to three consecutive exposures of equal integration time). There are 67 plates for which the SNRs are too low to select a standard star. Those plates are processed using a set of nominal SRCs.
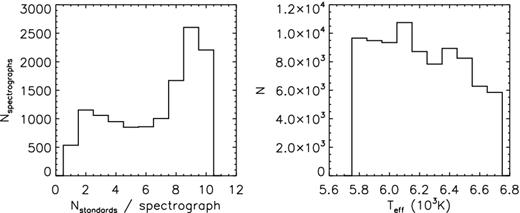
Histograms of the numbers of standard stars selected per spectrograph (left) and the effective temperatures of the standard stars (right).
2.4 Spectral response curves
The synthetic spectra of 1 Å dispersion from the library of Munari et al. (2005) are used. The spectra are degraded to the LAMOST spectral resolution by convolving with a Gaussian function. Although spectra of various micro-turbulent and rotation velocities are provided by the library, only those with a constant micro-turbulent velocity of 2.0 km s−1 and a zero rotation velocity are used, as these two parameters have little effects on the SED at a given temperature. In addition, only spectra calculated using the new opacity distribution function, flaged as ‘NW’ in the library, are used. If [Fe/H] < −1.0 dex, then spectra of [α/Fe] = 0.4 dex are adopted, otherwise those of [α/Fe] = 0.0 dex are adopted. The spectra are linearly interpolated to the desired Teff, log g and [Fe/H].
As for the atmospheric extinction Aa(λ), we adopt the extinction coefficients retrieved from the website2 deduced from the multi-medium-band photometry of the Beijing-Arizona-Taiwan-Connecticut survey (cf. Fan et al. 1996). Note that the potential uncertainties and temporal variations of the extinction coefficients generally do not have an impact on the final accuracy of flux calibration, though they do affect the shapes of the deduced SRCs and, consequently, their possible inferred temporal variations (cf. Section 3.3).
SRCs are assumed to be smooth functions of wavelength. To derive SRCs, we apply a low-order piecewise polynomial fitting to the ratios of the observed and intrinsic (synthetic) spectra of the standard stars after correcting the latter for the effects of the interstellar and Earth atmospheric extinction. Fig. 3 shows examples of SRC fitting. We define a series of clean spectral regions avoiding the prominent stellar absorption features and telluric absorption bands. We opt not to remove the latter from the flux-calibrated LSS-GAC spectra in the current implementation of the pipeline version (cf. Section 2.5). The median values of data in those clean regions, indicated by asterisks in Fig. 3, are used for the SRC fitting. For each standard star, both the blue- and red-arm spectra are divided into five wavelength regimes, and each regime is fitted with a second- or third-order polynomial, as represented by the thick lines in colours in the figure. The vertical solid lines in cyan indicate where the fits of adjacent regimes are joined together to produce the final SRC for the whole wavelength range. The wavelengths of the join points are not fixed but determined by the crossing wavelengths of fits of the adjacent spectral regimes. We assume that the differences in sensitivity of the individual fibres have been well corrected via flat-fielding and thus the 250 fibres of a given spectrograph share a single SRC. The final SRC is adopted as the SNR-weighted average of SRCs deduced from the individual selected standard stars observed with the spectrograph of interest. Fig. 4 shows the SRCs of the 16 LAMOST spectrographs derived from one plate observed on 2011 October 27.

Examples of SRC fitting for the blue- (left) and red-arm (right) spectra. The grey lines are ratios of the observed flux density (in units of ADU cm−2 s−2 Å−1) after correction for Earth atmospheric extinction and the flux density of the synthetic spectrum (in units of erg cm−2 s−1 Å−1) after dereddening for the interstellar extinction. The ratios have been scaled by a factor of 10−17. Asterisks are median values of spectral regions clear of prominent spectral features or artefacts that are used to generate the SRCs (see text for detail). The thick lines in colours represent piecewise polynomial fits to the asterisks. The vertical lines in cyan indicate positions where adjacent fits to individual wavelength regimes are pieced together. The black curves in the inserts represent the final SRCs.
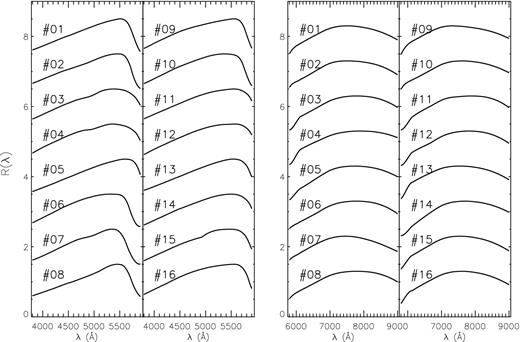
Examples of SRCs of the 16 LAMOST spectrographs derived for one specific plate (B6212) observed on 2011 October 27 for the blue-arm (left two panels) and red-arm spectra (right two panels). The spectrograph numbers are marked.
We have used spectrophotometric flux standard stars (Oke 1990; Hamuy et al. 1992, 1994) with minimal spectral features, such as DZ white dwarfs, to validate that the SRCs are indeed smooth functions of wavelength. As the surveys have progressed, LAMOST has observed a huge number of VB stars (of the order of 1 million to date) with optical magnitudes between 9 and 14 mag, utilizing observing times with grey to bright lunar conditions. Among the bright stars observed, we have found three spectrophotometric standard stars, Feige 34, GD 71 and Hz 21. Fig. 5 shows the response curve, R(λ) [cf. equation (1)], derived from the LAMOST spectra of the spectrophotometric standard stars. The intrinsic flux density as a function of wavelength of those spectrophotometric standard stars was retrieved from the European Southern Observatory (ESO) website,3 and the same piecewise low-order polynomials adopted to fit the SRCs of the LSS-GAC standard stars are used to fit the data in Fig. 5. For Feige 34, residuals caused by the stellar absorption lines are seen due to the differences in spectral resolution between the LAMOST spectra and the spectra of spectrophotometric standard stars retrieved from the ESO website. For GD 71 and Hz 21, because of the low SNRs of the red-arm spectra, only the results from the blue-arm spectra are shown. GD 71 and Hz 21 are among the faintest stars observed in the corresponding plates, which were designed to target VB stars of magnitudes between 9 and 14 mag optically. As a result, the SNRs of the spectra are not optimal. The spectrum of GD 71 from a single exposure has a SNR of about 28 per pixel (∼1.07 Å) at 4650 Å and 5 per pixel (∼1.7 Å) at 7450 Å, while the corresponding values of the spectrum of Hz 21 are about 12 and 1, respectively. Nevertheless, Fig. 5 shows that piecewise low-order polynomials fit the SRCs well in all cases. There are no obvious patterns in the residuals of fit, barring regions strongly affected by the telluric bands. Note that there is a shallow dip between 4800 and 5100 Å in the SRCs deduced from the spectra of Feige 34 and GD 71, both collected with spectrograph 3. Similar features are found in SRCs derived from F-type standard stars observed with spectrographs 3, 4, 7, 8 and 15 (Fig. 4), and consequently probably real.
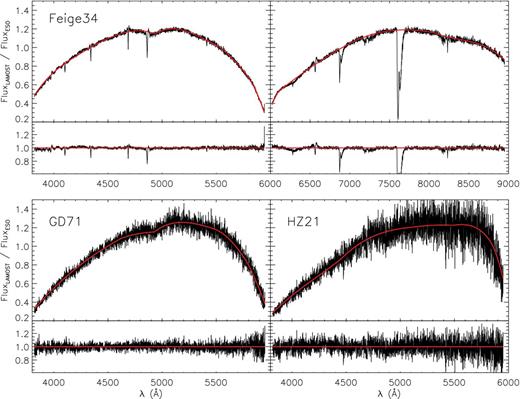
SRCs derived from the LAMOST observation of spectrophotometric standard stars Feige 34, GD 71 and Hz 21. The red lines are piecewise polynomial fits to the data. For Feige 34, the left and right panels are for the blue- and red-arm spectra, respectively. For GD 71 and Hz 21, results from the red-arm spectra are not shown due to the poor spectral SNRs. Note that regions affected by the prominent telluric absorption bands have been masked out when fitting the SRCs. The bottom of each panel shows the fitting residuals.
2.5 The final spectra
To calibrate the flux of the spectra, 1D spectra produced by the LAMOST 2D pipeline, after being corrected for the effects of Earth atmospheric extinction, are divided by the SRCs. Generally, two to three consecutive exposures of equal integration time are obtained for each LSS-GAC plate. To improve the SNR, spectra from the individual exposures are co-added. In doing so, a linear algorithm with strict flux conservation is adopted to re-bin the spectra of individual exposures to a common wavelength grid. The approach, at the cost of some marginal degradation in the spectral resolution, is different from the default of the LAMOST 2D pipeline, which uses spline fitting to re-bin the spectra. Once the flux is calibrated, the blue- and red-arm spectra are pieced together directly without any scaling or adjustment to yield the final spectra. Excluding the edges of very low sensitivities, the blue- and red-arm spectra are simply averaged in the overlap wavelength region. Due to the uncertainties in flat-fielding and sky subtraction, some spectra, in particular those with low SNRs, cannot be pieced together smoothly with the current approach. This problem will be further discussed in Section 3.2.1. Considering that prominent telluric absorption features, such as the Fraunhofer A band at 7590 Å and B band at 6867 Å, are strongly saturated, and signals of any generic stellar features embedded in those bands are likely totally lost, we have opted not to remove those telluric bands artificially in the final flux-calibrated spectra via SRC fitting.
3 RESULTS AND DISCUSSIONS
3.1 Accuracy of the calibrated spectra
Our method has been successfully applied to LSS-GAC. To investigate the accuracy of spectra thus calibrated, the results are closely examined, including a careful comparison of the SRCs for the individual flux standard stars in a given spectrograph of a given plate, a comparison of the calibrated spectra from multi-epoch observations of duplicate targets, a comparison of the colours yielded by the calibrated spectra and the photometric measurements, as well as comparisons of the calibrated spectra with external data, such as spectra of spectrophotometric standard stars and spectra collected by SDSS.
3.1.1 SRCs derived from the individual standard stars
Accurate determination of SRCs is essential for accurate spectral flux calibration. In this section, the SRCs derived from the individual standard stars observed with a given spectrograph are compared to test the precision of the deduced SRCs. Since, as mentioned in Section 1, we concentrate on the relative rather than absolute flux calibration, we examine the dispersion of relative variations of SRCs for the individual standard stars for a given spectrograph. For a given spectrograph of a specific exposure, SRCs from the spectra of the individual standard stars are divided by the final (average) SRC. The results are scaled to unity at a specific wavelength λ2. The standard deviation of values of SRCs thus normalized is then calculated at a different wavelength, λ1, denoted as s.d.(λ1). The latter is adopted as a measure of the uncertainties in the shape of SRCs derived from individual standard stars for a given spectrograph. For the blue-arm spectra, λ1 and λ2 are set to 4100 and 5600 Å, respectively, while for the red-arm spectra, the corresponding values are 6300 and 8800 Å.
As an example, the left panel of Fig. 6 plots SRCs as well as R(λ)/R(λ2) as a function of wavelength λ for individual exposures of individual standard stars observed with spectrograph 6 of plate 20111028-GAC060N28B1. The figure shows that although the absolute values of SRCs yielded by the individual standards may differ by up to a factor of 2–3, their shape between 4100 and 5600 Å varies by less than 5 per cent. The right panel of Fig. 6 shows the distribution of uncertainties of the relative SRCs, quantified by s.d.(λ1), for all the spectrographs of all 602 plates collected by 2013 June that are included in the current analysis. It indicates that for the majority of spectrographs (67 per cent for the blue and 84 per cent for the red arm), the uncertainties in terms of the relative SRCs are smaller than 10 per cent for both the blue- and red-arm spectra. Note that almost all spectrographs with large uncertainties in the relative SRCs are for VB plates. If we exclude VB plates, 88 and 93 per cent of the spectrographs have uncertainties less than 10 per cent for the blue- and red-arm spectra, respectively. The large uncertainties in both interstellar extinction corrections and sky subtractions for the VB plates, observed under bright lunar conditions and other unfavourable observing conditions, may have contributed to the large SRC uncertainties for those plates. Since we have adopted the average of SRCs from the individual standard stars as the final SRC, we expect that the uncertainties of the latter are smaller by a factor of 2–3 given that the majority of spectrographs have 5–10 standard stars.
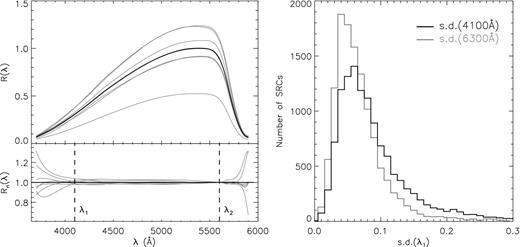
Upper-left: R(λ) derived from the individual standard stars (grey) and their SNR-weighted mean (black) for a given spectrograph of a given exposure. Lower-left: SRCs from the individual standards are divided by the SNR-weighted-mean and then normalized to unity at wavelength λ2, denoted as Rn(λ). The vertical dashed line marked as λ2 indicates the wavelength of normalization, while the dashed line marked as λ1 indicates the wavelength where the standard deviation of Rn(λ1), s.d.(λ1), is calculated. For the blue-arm spectra, λ1 = 4100 Å and λ2 = 5600 Å. For the red-arm spectra, the corresponding values are 6300 and 8800 Å, respectively. Right: Distribution of the standard deviations of Rn(λ1) yielded by all the spectrographs of all exposures included in the current analysis.
3.1.2 Comparison with photometry
To test the (relative) accuracy of our flux-calibration algorithm, we convolve the flux-calibrated spectra with the SDSS g-, r- and i-band transmission curves and compare the resultant colours with the XSTPS-GAC photometry, which is globally calibrated to the SDSS photometric system to an accuracy of 0.02–0.03 mag (Liu et al. 2014). For this purpose, we select the LSS-GAC plates collected in the Pilot Surveys (2011 October – 2012 June) and the first year of the Regular Surveys (2012 October – 2013 June). We require that the stars are fainter than 13.0 mag in all g, r and i bands to ensure that they are not saturated in the XSTPS-GAC survey, and that the spectra have SNRs higher than 20 to minimize the uncertainties caused by poor sky subtraction. Spectral plates observed with lunar distances smaller than 60 deg, as well as plates that lack enough standards of sufficient SNR and are thus calibrated using SRCs deduced from other plates, are excluded.
Distribution of the differences of (g − r) and (g − i) colours yielded by the flux-calibrated spectra and those from the XSTPS-GAC photometry are shown in Fig. 7. For (g − r), with a difference of 0.02 ± 0.07 mag, the results agree extremely well. For (g − i), colours yielded by the spectra are on average 0.04 mag bluer than the photometric values. The small systematic offset is because we have opted not to correct for the telluric features in the spectra, most notably the Fraunhofer A band at 7590 Å and B band at 6867 Å in the wavelength range of the photometric i band (cf. Section 2.5).
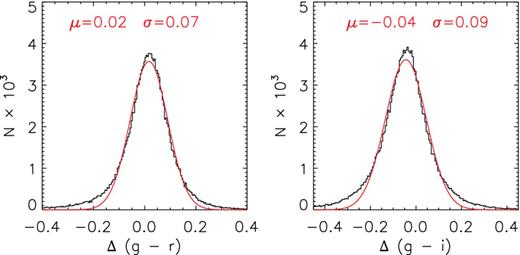
Histograms of differences of (g − r) (left) and (g − i) (right) colours yielded by the flux-calibrated LSS-GAC spectra and those given by the XSTPS-GAC photometric survey, for a sample of 158 734 stars. Also over-plotted are Gaussian fits to the distributions, with the mean and dispersion of the Gaussian marked.
3.1.3 Comparison of multi-epoch observations
For LSS-GAC, ∼23 per cent of the sample stars are targeted more than once due to the overlapping of the FoV of adjacent plates (Liu et al. 2014). As a check of the robustness of our flux-calibration algorithm, we compare the spectra of common objects acquired in different plates, usually taken on different nights. To minimize uncertainties in sky subtraction, only spectra with SNRs higher than 30 per pixel at 4650 Å and observed with lunar angular distances larger than 60 deg are used for the comparison. We further require that the difference between the spectral and photometric (g − r) colours is less than 0.16 mag, i.e. within ∼2σ of the distribution shown in Fig. 7, to exclude spectra with poor alignment of the blue- and red-arm spectra, caused by, for example, poor flat-fielding. The selection yields 15 019 pairs of spectra of common targets. The ratios of the two spectra of each pair are calculated and then scaled to a mean value of unity for the wavelength range 4060–4080 Å, a relatively clean region devoid of prominent spectral features. The results are plotted in Fig. 8. The ratios yield an average that is almost constant for the whole spectral wavelength coverage, with a standard deviation of 2 and 15 per cent at 4070 and 9000 Å, respectively. The results show that our flux-calibration algorithm has achieved a precision of ∼13 per cent between 4100 and 9000 Å. In fact, since both spectra of a pair contribute to the dispersion, the underlying precision of a given spectrum should be slightly better, probably at the level of 10 per cent. The rapid increase of scatter at shorter wavelengths is mainly caused by the rapid decline of the instrumental throughput and thus the limited SNRs of spectra at those wavelengths.
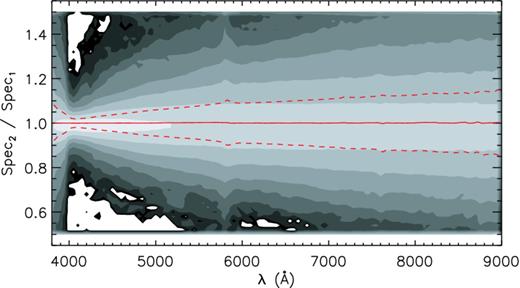
Distribution of ratios of spectral pairs of common objects for different epochs. The grey contours are shown on a logarithmic scale, and represent the distribution of values of ratios of 15 019 spectra pairs. The mean and standard deviation of the ratios as a function of wavelength are shown by the solid and dashed curves, respectively.
3.1.4 Comparison with spectrophotometric standards
In this section, we compare the absolute spectral flux densities from the calibrated LAMOST spectra directly with values retrieved from the ESO website (denoted as the ESO flux density hereafter) and those from the CALSPEC database of Hubble Space Telescope standards4 (Bohlin, Gordon & Tremblay 2014; denoted as the CALSPEC flux density hereafter) for the spectrophotometric standard stars Feige 34, GD 71 and Hz 21. The results are shown in Fig. 9. For GD 71 and Hz 21, only results from the blue-arm spectra are shown. The red-arm spectra have SNRs that are too low (<5) to be useful. The figure indicates that although the absolute flux densities given by the calibrated LAMOST spectra are a factor of 1–3 lower than the ESO values, their ratios, i.e. the shapes of the SEDs, agree well. Comparison with the CALSPEC database yields similar results. For Feige 34, except for regions affected by the telluric bands (e.g. the O2a band at ∼6280 Å, the O2B band at ∼6870 Å, the H2O band at ∼7200 Å, the O2A band at ∼7600 Å and the O2z band at ∼8220 Å) and by the broad stellar hydrogen and helium absorption lines, the shapes of SEDs given by the LAMOST and ESO spectra agree within 5 per cent for the whole wavelength range. Similar results are achieved for Hz 21, except near the red end of the wavelength coverage. For GD 71, the shape of the SED given by the LAMOST spectrum deviates from that of the ESO spectrum by up to 20 per cent between 4000 and 5000 Å. The cause of the large deviation is not clear. We suspect that some fibres may have poorly flat-fielded. Specifically, the spectral response of some fibres may have varied between the observation of the target plate and that of the twilight, since the latter is used to flat-field the fibres in the current implementation of the 2D pipeline (Section 3.2.1). Another possibility is that the extinction towards some of the selected standard stars is significantly overestimated (>0.1 mag) for some unknown reasons (e.g. contamination from a binary companion). In fact, for this particular observation of GD 71, a subset of four (out of 10) standard stars yields a SRC that recovers the ESO flux density. The spectrum of GD 71 calibrated using the SRC deduced from this subset of standard stars is shown in grey in Fig. 9.
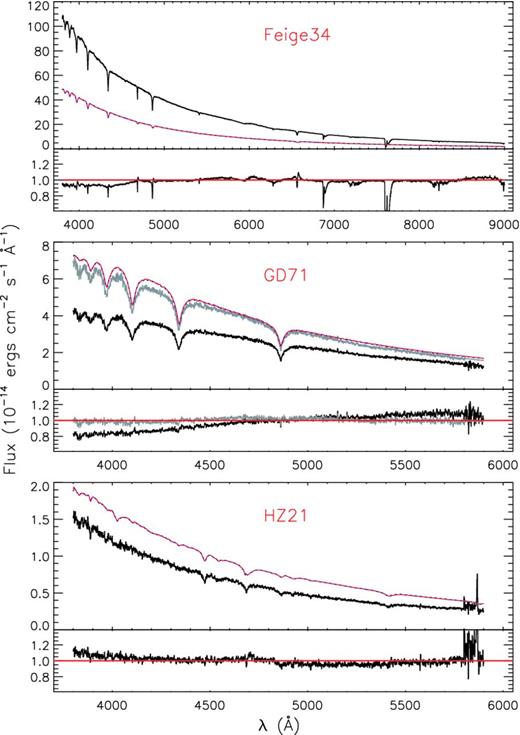
Comparison of calibrated LAMOST spectra (black) with spectra retrieved from the ESO website (red lines) and from the CALSPEC database (blue dashed lines, which are almost indistinguishable from the red lines) for flux standard stars Feige 34 (top), GD 71 (middle) and Hz 21 (bottom). In each panel, the upper part shows the absolute flux density as a function of wavelength, whereas the lower part shows the ratios of the LAMOST and ESO flux densities, normalized to the median value of the ratios. Note for GD 71 and Hz 21, the red-arm spectra are not shown due to poor SNR. The spectrum of GD 71 processed with the SRC from a subset of four selected standards is shown in grey (see text for detail).
3.1.5 Comparison with SDSS spectra
We have made an extensive comparison of flux-calibrated LSS-GAC spectra with those of SDSS for common objects, and found that for stars of high Galactic latitudes suffering from low interstellar extinction, they match with each other quite well, with differences of only a few per cent for the whole wavelength range, provided the SNRs of both sets of spectra are higher than 30. For stars of low Galactic latitudes and suffering from high extinction, large deviations between them are seen for some sources. Some examples are illustrated in Fig. 10. The figure shows that for stars suffering from low extinction, the SEDs from the LSS-GAC spectra match quite well with those of SDSS, except for regions strongly affected by the telluric bands, which have not been removed from the LSS-GAC spectra. For stars suffering high extinction, the SEDs from SDSS are typically redder than those of LSS-GAC. Further, some SDSS spectra show strange S-shaped SEDs. We believe that this is likely caused by unrealistic SRCs of SDSS for high extinction fields since the effects of the interstellar extinction have not been properly accounted for by the SDSS pipeline. The SDSS pipeline uses the SFD98 extinction map to correct for the effects of the interstellar extinction. However, the SFD98 map gives the total extinction integrated along a given line of sight and generally overestimates the extinction for a disc star in that direction. The redder SEDs yielded by SDSS spectra compared with those of LSS-GAC for stars suffering from a large degree of extinction can be explained if the SDSS pipeline has overestimated the extinction of flux-calibration standard stars. The different extinction laws adopted by the LSS-GAC and SDSS pipelines may also play a role. SDSS adopts O'Donnell's (1994) extinction law, while we use that of Fitzpatrick. It is possible that the S-shaped SEDs seen in some of the SDSS spectra are a defect caused by the inadequacy of the O'Donnell extinction law, and the defect is more severe for stars suffering from higher extinction. In fact, it has been argued that the Fitzpatrick law fits the data better than O'Donnell's (Schlafly, Finkbeiner & Schlegel 2010; Berry et al. 2012; Yuan, Liu & Xiang 2013). Note that in Fig. 10, some spikes caused by cosmic rays that have not been cleaned can be seen in some of the LSS-GAC spectra plotted (cf. XLYH15).
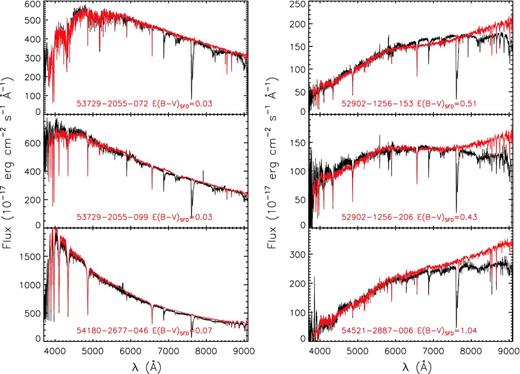
Comparison of LSS-GAC (black) and SDSS spectra (red). The left panel shows stars suffering from low reddening, whereas those plotted in the right panel suffer from a significant amount of reddening. The SDSS object ID, in the format MJD-plate id-fibre, as well as the E(B − V) from the SFD98 reddening map, are marked in each panel in red. Note that the telluric bands have not been removed from the LSS-GAC spectra.
3.2 Error sources in flux calibration
There are several obstacles that prevent one from obtaining accurately calibrated spectra with the LAMOST-like multiplex telescopes that have a very wide FoV, including obtaining homogeneous and stable flat-fields, accurate sky and other background light (e.g. scattered light) subtraction in two dimensions, and accurate fibre positioning and so on. In this section, we discuss the potential effects on the flux calibration from those difficulties.
3.2.1 Flat-fielding and sky subtraction
To ensure the fibre system works stably is an important issue for LAMOST. There is evidence that the SRCs of individual fibres vary from observations of one plate to another, probably caused by changes in the stress of the fibres after repositioning. The variations amount to 10 per cent across the whole wavelength range covered by the LAMOST spectra (Chen et al., 2014b). This suggests that fibre flat-fields derived from twilight exposures may not be suitable for flat-fielding the science exposures obtained during the night. The variations will, no doubt, have an impact on sky subtraction and flux calibration, introducing uncertainties to the final calibrated spectra. Uncertainties introduced by such variations of fibre flat-fields do not depend on the spectral SNRs. As a consequence, for even spectra with very high SNRs, the SED may have an incorrect shape. Attempts to characterize and correct for such variations of fibre flat-fields are under way (Chen et al., 2014b).
To minimize potential errors introduced by poor sky subtraction, the current implementation of the LAMOST 2D pipeline (v2.6) scales the sky spectrum to be subtracted from the target spectra by the measured fluxes of sky emission lines, assuming that the latter are homogeneous across the FoV of individual spectrographs (about 1 deg). The difficulty is that, given that the continuum sky background and sky emission lines originate from very different sources and are excited by different mechanisms, their emission levels are unlikely to scale linearly with each other. In fact, even amongst the sky emission lines, lines from different species (such as atomic [O I] and molecular OH) may have quite different behaviour in terms of their temporal and spatial variations. Scaling the sky spectra by the measured fluxes of sky emission lines risks subtracting an incorrect level of continuum sky background. To ensure that the blue- and red-arm spectra join smoothly, the default flux-calibration algorithm in the LAMOST 2D pipeline forces the blue spectrum between 5295 and 5700 Å and the red spectrum between 6040 and 6530 Å to align with each other by shifting and scaling the red-arm spectrum in an arbitrary way. We have opted not to perform such shifting or scaling. As a consequence, the blue- and red-arm spectra of some of the spectra processed with our own pipeline do not join smoothly. For spectra of SNRs higher than 10, the discontinuity, if any, amounts to only a few per cent in most cases.
3.2.2 Spectral SNRs
Spectral SNRs obviously have a large impact on the accuracy with which the spectra can be calibrated. To test how the SEDs of LSS-GAC targets are affected by limited SNRs, we compare the spectral and photometric (g − r) colours as a function of the spectral SNR. The results are plotted in Fig. 11. The figure shows that at high SNRs, the two agree well, with a mean difference of 0.01–0.02 mag and there is no systematic trend. At SNRs lower than about 10, the discrepancies increase rapidly, along with some systematic differences. Clearly, poor sky subtraction dominates at such low SNRs. Note that even at SNRs higher than 40, there is still a significant scatter of 0.06 mag between the spectral and photometric colours. This is likely caused by uncertainties in the SRCs as well as fibre flat-fielding.
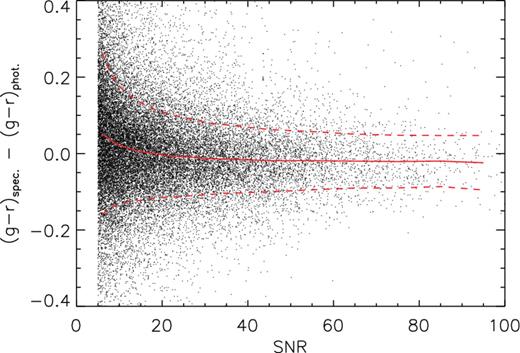
Difference of spectral and photometric (g − r) colours as a function of the spectral SNR. The solid and dashed lines in red delineate the mean and standard deviation of the differences. For clarity, only one in 10 data points are shown.
Poor spectral SNRs may also have a large impact on the accuracy of flux calibration due to the restrictive number of quality flux-calibration standards available for a given spectrograph or plate. As described in Section 2.3, about 10 per cent of plates observed hitherto fail to yield sufficient numbers of standard stars with good SNR. Those plates are processed with SRCs derived from other plates of better quality. The flux calibration of these plates is thus unreliable. They are mostly M or F plates, or B and VB plates observed under poor conditions. Many of them were collected during the Pilot Surveys. With better observational planning and stricter quality control, the number of such plates will be much reduced as the Regular Surveys progress.
3.2.3 Stellar atmospheric parameters
We show in Section 2.2 that for flux standard stars with 5750 ≤ Teff ≤ 6750 K, an error of 150 K in Teff can lead to a maximum uncertainty of 12 per cent in the shape of the stellar SED and thus the shape of the SRC derived from it. Uncertainties caused by errors in log g are negligible, about 1 per cent at most for the whole wavelength range concerned for an estimated error of 0.25 dex in log g. The metallicity mainly affects the blue-arm spectra at short wavelengths (λ < 4500 Å). A difference of 0.2 dex in [Fe/H] can change the SED shape between 3800 and 4500 Å by approximately 3 per cent, while the effects at λ > 4500 Å are only marginal. Since the SRC of each spectrograph is derived using several (up to 10) standard stars, the impact of uncertainties in stellar atmospheric parameters of individual flux standard stars on the final SRC deduced is much reduced and expected to be a few per cent at most.
3.2.4 Extinction towards flux-calibration standard stars
Comparison with the SFD98 reddening map for high Galactic latitude stars shows that a typical uncertainty of E(B − V) derived with the method adopted in the current work is about 0.04 mag (Yuan et al. 2015). An uncertainty in E(B − V) of this level can lead to an error of ∼10 per cent maximum in the deduced SRCs. Also it is quite possible that some of the selected flux-calibration standard stars are actually binaries or multiple stellar systems. In this case, the values of E(B − V) estimated may suffer from large errors. The effects of uncertainties in estimates of reddening may be more severe for VB plates, for which the values of reddening for individual targets are estimated using the 2MASS J, H and Ks bands only. Currently, there is no good solution to this problem. However, this effect is possibly insignificant. A comparison with the SFD98 reddening map shows there are no clear patterns of errors for values of extinction estimated based on the near-IR photometry alone.
In addition to uncertainties in E(B − V), the variations of extinction law, or specifically RV in different Galactic environments, will also introduce additional uncertainties to the flux calibration. Although it is generally accepted that RV = 3.1 is a good value to use for the general diffuse interstellar medium, moderate variations in RV have been found in the Galactic disk (cf. Fitzpatrick & Massa 2007, and references therein). By comparing the multi-band photometric colours with synthetic values from stellar atmospheric models, we find RV = 3.15 for all selected flux standard stars used to calibrate all plates collected hitherto, along with a standard deviation of 0.25. The result is very consistent with that of Fitzpatrick & Massa (2007). A scatter of 0.25 in RV can lead to an uncertainty of 10 per cent in the SRCs deduced. However, not all scattering seen in RV is real, since a significant portion of the variation is probably caused by measurement uncertainties. Again, since more than one flux-calibration standard star is used for a given spectrograph, we expect that uncertainties of SRCs introduced by errors in extinction corrections for the flux-calibration standard stars are probably several to 10 per cent in general.
3.2.5 Prominent absorption features in spectra of the standard stars
There are several prominent stellar atmospheric absorption features in the spectra of F-type standard stars, such as the hydrogen Balmer lines, the CH G band at 4314 Å and a number of strong lines from metal Fe, Ti and Mg between 5100 and 5300 Å. Although spectral regions affected by these prominent features have been masked out in fitting the SRCs, their effects cannot be fully neutralized, in particular at wavelengths λ < 4000 Å, where the spectra are plagued by a series of high-order hydrogen Balmer lines as well as the Balmer discontinuity. In addition, the instrumental sensitivity drops rapidly to a very low value at such short wavelengths, making the SRCs quite uncertain in this wavelength regime. The SRCs at λ ∼ 3800 Å may be uncertain by as much as 20–40 per cent, or more in some extreme cases. More observations of featureless spectrophotometric standard stars, such as DZ white dwarfs, may help characterize the shape of SRCs in this near-ultraviolet wavelength regime.
3.2.6 Other error sources
In addition to the sources of error discussed above, some other factors may also affect the robustness of the derived SRCs, including the differential refraction of the Earth atmosphere and uncertainties in fibre positioning. Those effects are, however, difficult to characterize and may well vary from plate to plate. Careful observational planning and strict quality control are the keys to ensuring data quality and calibration robustness.
3.3 Temporal variations of the shape of SRC
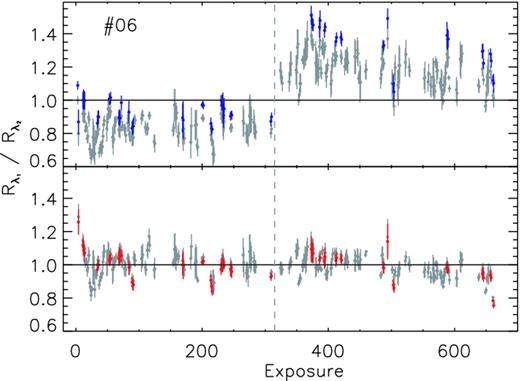
In this section, we compare the SRCs deduced from individual observations (exposures) and investigate their possible temporal variations. In Fig. 12, we plot the ratios of SRC values at two specific wavelengths, R(λ1)/R(λ2), in a sequence of exposures, for the 16 spectrographs of LAMOST. For the blue-arm SRCs, λ1 = 4100 Å and λ2 = 5600 Å, while for the red-arm SRCs, the corresponding values are 6300 and 8800 Å. To minimize uncertainties, only SRCs with shape errors less than 0.08 for both the blue and red arms, and where the stellar spectral (g − r) colours of the standard stars agree with photometric values within 0.05 mag, are shown in the plot. The requirements exclude most VB plates – standard stars selected for those plates are saturated in the XSTPS-GAC survey and thus do not have photometric colours. As a result, not all spectrographs plotted in Fig. 12 have the same number of data points. Fig. 12 shows large jumps and scatters. Some jumps are clearly related to instrument maintenance, adjustment and optimization. For example, during the summer of 2012, the collimators of several spectrographs were recoated. As a result, at the onset of the Regular Surveys, there is a significant upward jump in R(λ1)/R(λ2) for those spectrographs, in particular, for the blue arms of spectrographs 1–3, 5–8 and 15, indicating a significant improvement in sensitivity at short wavelengths.
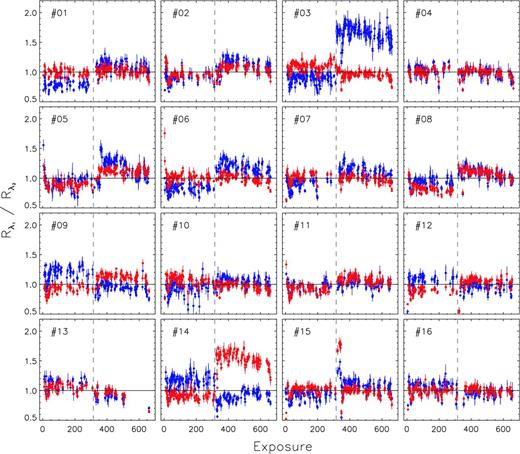
Ratios of SRC values at two specific wavelengths, for SRCs deduced from individual exposures for spectrograph 6, in a sequence by time of observation. For the blue-arm SRCs (upper), λ1 = 4100 Å and λ2 = 5600 Å. For the red-arm SRCs (lower), λ1 = 6300 Å and λ2 = 8800 Å. The error bars denote the standard deviations of SRCs for the individual standard stars. The spectrograph numbers are labelled. The vertical grey dashed lines denote the completion of the Pilot Surveys and the initiation of the Regular Surveys.
Apart from those large jumps in sensitivity, Fig. 12 also reveals significant plate-to-plate variations in the shape of SRCs, of 30 per cent or more. The shape of SRCs varies not only on different nights, but also during a given night. To illustrate this, we plot in Fig. 13 all SRCs deduced from individual exposures taken on 2011 January 12 for spectrograph 5, divided by the SRC for the very first exposure of that night. In the plot, different colours indicate SRCs from different plates (FoVs), whereas lines of the same colour indicate SRCs from the individual (consecutive) exposures for the same plate. Variations of up to ∼30 per cent are seen for the blue. For a given plate, SRCs deduced for the individual (consecutive) exposures are generally in good agreement, typically within a couple of per cent.
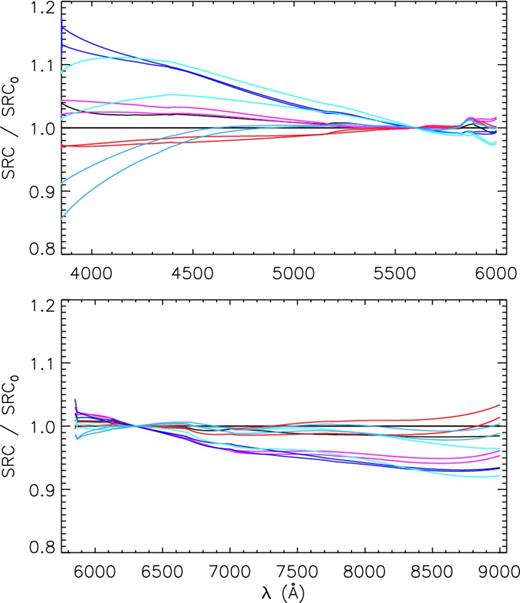
SRCs of spectrograph 5 deduced from the individual exposures taken on 2012 January 12, divided by the SRC for the very first exposure of that night. Lines of the same colour represent results from the individual (consecutive) exposures of the same plate, whereas lines of different colours represent results from different plates.
To ensure that the variations in the shape of SRCs seen in Fig. 12 are not artefacts induced by improper extinction corrections for flux-calibration standard stars in the Galactic disc, the same data for spectrograph 6 are re-plotted in Fig. 14, highlighting data points from high Galactic latitudes. In the plot, the data points in colour are from high Galactic latitude fields (|b| > 25 deg) for which the median values of E(B − V) of individual flux-calibration standard stars, as estimated by comparing the measured and synthetic photometric colours as well as given by the SFD98 extinction map, are both smaller than 0.08 mag. The figure clearly shows that the variations cannot be due to uncertainties in reddening corrections. As a final check that the variations are not due to some hidden errors in our flux-calibration procedure, we have directly compared the SEDs of uncalibrated spectra from the LAMOST 2D pipeline, of stars observed at multi-epochs. Again the comparison confirms that the variations of SRCs are real. The large variations in the shape of SRCs, from plate to plate, suggest that deriving SRCs plate by plate is essential for accurate flux calibration of the LAMOST spectra.
Same as Fig. 12 but for spectrograph 6 only. Data points in colour are from high Galactic latitude fields (|b| > 25 deg) where the median value of E(B − V) of the individual standard stars used to derive the SRC is smaller than 0.08 mag.
The causes of such plate-to-plate variations in the shape of SRCs are not clear. They could be caused by stress- or strain-induced variations of fibre spectral response when the telescope moves from one plate (field) to another and the fibres reposition, as mentioned in Section 3.2.1, and/or by colour-dependent variations of image quality across the FoV as the telescope tracks during the exposures. Another possibility is the change of the Earth atmospheric extinction curve during the night. Due to the increasing air pollution at Xing Long Station, in particular in winter, the local atmospheric reddening and extinction are known to exhibit erratic variations at short timescales. Further studies are needed, however, to clarify the situation.
4 SUMMARY
We have presented the relative flux calibration for LSS-GAC. Stars with Teff between 5750 and 6750 K as given by LSP3, most of which are F type, are selected as flux-calibration standard stars. For the majority of LSS-GAC plates and spectrographs, more than four standard stars can be selected. The SRCs are derived by fitting with low-order piecewise polynomials on the ratios of the observed spectra of the standard stars and the synthetic ones that have the same stellar atmospheric parameters as the standard stars, after reddened the latter using values of the interstellar reddening E(B − V) derived by comparing the observed and synthetic colours, assuming a RV = 3.1 Fitzpatrick extinction law. For plates where not enough standard stars can be selected, the SRCs deduced from other plates, usually observed on the same night, are used to process the spectra. Spectra from the individual consecutive exposures of the same plate are co-added to improve the SNRs. The calibrated blue- and red-arm spectra are pieced together directly without scaling or shifting to yield the final spectra. Prominent telluric bands, such as the Fraunhofer A and B bands, are not removed from the calibrated spectra.
The scatter of SRCs derived from individual standard stars in a given spectrograph indicates that the final, average SRCs have achieved an accuracy of a few per cent for both the blue and red arms of the spectrograph. Stellar colours deduced by convolving the flux-calibrated spectra with the photometric band transmission curves agree with photometric measurements of XSTPS-GAC, with an average difference of 0.02 ± 0.07 and −0.04 ± 0.09 mag for (g − r) and (g − i), respectively. The relatively large offset in (g − i) is because the telluric bands in the LSS-GAC spectra, most notably the atmospheric A band in the wavelength range of the photometric i band, have not been removed from the calibrated LSS-GAC spectra. A direct comparison of spectra obtained at multi-epochs of duplicate targets indicates that for a spectral SNR per pixel (∼1.07 Å) at 4650 Å higher than 30, an accuracy of about 10 per cent in the relative flux calibration has been achieved for the wavelength range 4000–9000 Å. The accuracy of the calibration degrades dramatically near the edges of the wavelength coverage, especially near the short wavelength edge of the blue-arm spectra, where the instrumental sensitivity drops to a very low value. Comparison with the SDSS spectra of common objects shows that the LSS-GAC spectra calibrated with the current algorithm exhibit more realistic SEDs than the SDSS spectra do for stars from high extinction regions.
The shapes of SRCs show significant temporal variations from night to night, and even on a single night. The variations can reach 30 per cent or more for the whole wavelength range. The presence of such large variations in the shapes of SRCs suggests that deriving SRCs plate by plate is essential for accurate flux calibration of the LAMOST spectra. The causes of variations in the shape of SRCs are not very clear. Possibilities include changes in fibre response as a result of fibre repositioning or erratic variations in the atmospheric reddening and extinction. More studies are needed to clarify the situation.
MSX thanks J.-J. Chen for useful discussions. This work is supported by the National Key Basic Research Program of China 2014CB845700. Guo Shoujing Telescope (LAMOST) is a National Major Scientific Project built by the Chinese Academy of Sciences. Funding for the project has been provided by the National Development and Reform Commission. LAMOST is operated and managed by the National Astronomical Observatories of the Chinese Academy of Sciences. We have used SDSS spectra and the spectra of flux standard stars retrieved from the ESO website.
