


Abstract
We examine the relation between polycyclic aromatic hydrocarbon (PAH) emission at 8 μm and far-infrared emission from hot dust grains at 24 μm and from large dust grains at 160 and 250 μm in the nearby spiral galaxies NGC 2403 and M83 using data from the Spitzer Space Telescope and Herschel Space Observatory. We find that the PAH emission in NGC 2403 is better correlated with emission at 250 μm from dust heated by the diffuse interstellar radiation field (ISRF) and that the 8/250-μm surface brightness ratio is well correlated with the stellar surface brightness as measured at 3.6 μm. This implies that the PAHs in NGC 2403 are intermixed with cold large dust grains in the diffuse interstellar medium (ISM) and that the PAHs are excited by the diffuse ISRF. In M83, the PAH emission appears more strongly correlated with 160 μm emission originating from large dust grains heated by star-forming regions. However, the PAH emission in M83 is low where the 24-μm emission peaks within star-forming regions, and enhancements in the 8/160-μm surface brightness ratios appear offset relative to the dust and the star-forming regions within the spiral arms. This suggests that the PAHs observed in the 8 μm band are not excited locally within star-forming regions but either by light escaping non-axisymmetrically from star-forming regions or locally by young, non-photoionizing stars that have migrated downstream from the spiral density waves. The results from just these two galaxies show that PAHs may be excited by different stellar populations in different spiral galaxies.
1 INTRODUCTION
Polycyclic aromatic hydrocarbons (PAHs) are large carbon molecules that can be thought of as transitional between the gaseous and solid phases of the interstellar medium (ISM). They are commonly identified as the source of emission for multiple broad emission features in the mid-infrared, including those at 3.3, 6.2, 7.7, 11.3, 12.7 μm (Tielens 2008). While these complex molecules can be excited by optical and infrared photons (Li & Draine 2002), excitation by ultraviolet photons is more efficient (Tielens 2008).
Many authors have sought to calibrate PAH emission as an extragalactic star formation tracer, mainly because it is relatively unaffected by dust extinction and because PAHs emit at shorter wavelengths than hot dust and can therefore be imaged with better angular resolutions. While early analyses with the Infrared Space Observatory (ISO; Kessler et al. 1996) found some evidence for a relation between PAH emission and other star formation tracers (Roussel et al. 2001; Forster Schreiber et al. 2004), later work, including work with the Spitzer Space Telescope (Werner et al. 2004), demonstrated that the PAH emission was actually poorly correlated with other star formation tracers. PAH emission appeared suppressed relative to other star formation tracers in star-forming regions or overluminous in diffuse regions (Boselli, Lequeux & Gavazzi 2004; Helou et al. 2004; Calzetti et al. 2005; Prescott et al. 2007; Bendo et al. 2008). The ratio of PAH to hot dust continuum emission was also found to decrease as metallicity decreased (Engelbracht et al. 2005, 2008; Madden et al. 2006; Calzetti et al. 2007; Galliano et al. 2008; Gordon et al. 2008; Galametz et al. 2013). The common explanations are either that low-metallicity regions contain fewer PAHs or that the PAHs are exposed to and destroyed by harder ultraviolet radiation in low-metallicity environments with less dust attenuation. None the less, globally-integrated PAH emission has been shown to be correlated with other globally-integrated star formation tracers, and methods have been developed for calculating extinction-corrected star formation rates using a combination of Hα and PAH emission in the 8-μm Spitzer band (Zhu et al. 2008; Kennicutt et al. 2009), although Calzetti et al. (2007) warn that even global measurements could be affected by metallicity effects.
In contrast, a few authors have found that PAH emission was associated with emission at > 100 μm that will primarily trace ≲ 30 K large dust grains. One of the first groups to draw attention to this was Haas, Klaas & Bianchi (2002), who demonstrated that PAH emission was better correlated with 850 μm emission from cold dust than 15 μm emission from hot dust, although this analysis was limited to regions with high-infrared surface brightnesses. The ISO-based analysis by Boselli et al. (2004) also implied that PAHs were associated with diffuse dust rather than star-forming regions. Later work by Bendo et al. (2006, 2008) demonstrated that the PAH emission showed a strong correlation with 160 μm emission and that the 8/160-μm surface brightness ratio was dependent upon the 160 μm surface brightness. These results combined with the breakdown in the relation between the PAH and hot dust emission implied that the PAHs were primarily associated with dust in the diffuse ISM or in cold molecular clouds near star-forming regions and that both the PAHs and the large dust grains were heated by the same radiation field.
Data from the Herschel Space Observatory (Pilbratt et al. 2010) can be used to further study the relation between PAHs and large dust grains. The telescope is able to resolve emission at 160 and 250 μm on <18 arcsec scales, which is a marked improvement in comparison to the 38 arcsec scales that could be resolved by Spitzer at 160 μm. Moreover, Bendo et al. (2010b, 2012a) and Boquien et al. (2011) have demonstrated that ≤160 and ≥250 μm emission from nearby galaxies may originate from dust heated by different sources. The 70/160- and 160/250-μm surface brightness ratios were typically correlated with star formation tracers such as ultraviolet, Hα, and 24 μm emission and peaked in locations with strong star formation, suggesting that the dust seen at ≤160 μm is primarily heated locally by star-forming regions. Meanwhile, the 250/350 and 350/500 μm ratios were more strongly correlated with near-infrared emission and generally varied radially in the same way as the emission from the total stellar population (including both young, intermediate-aged, and evolved stars), demonstrating that the dust seen in these bands was primarily heated by the diffuse interstellar radiation field (ISRF) from these stars. PAH emission can be compared to dust emission observed by Herschel to determine which of these two dust components are more closely associated with PAH emission, which would ultimately lead to a better understanding of how the PAHs are excited and how they survive in certain environments in the ISM.
So far, the relation between PAH and dust emission has been investigated using Herschel data for only two galaxies. Calapa et al. (2014) have shown that 8 μm emission from PAHs in M33 is well correlated with 250 μm emission. They go on to further demonstrate the 8/250 μm ratio is correlated with the 3.6 μm band tracing the total stellar population, implying that the PAHs are excited by the diffuse ISRF. Lu et al. (2014) present an alternative analysis with M81 in which they divide the PAH emission into components heated by two sources: a component heated by star-forming regions traced by Hα emission and a component heated by the diffuse ISRF traced by the cold dust emission at 500 μm emission. The results show that most (∼85 per cent) of the 8 μm emission from diffuse regions is associated with the cold dust emission, while in star-forming regions, most (∼60 per cent) of the 8 μm emission is excited by young stars.
The goal of this paper, which is a continuation of the work by Jones (2013), is to further study the relationship between PAH emission at 8 μm and far-infrared emission from large dust grains using Herschel Space Observatory (Pilbratt et al. 2010) far-infrared images of NGC 2403 and M83. These are two of the 14 nearby galaxies within the Very Nearby Galaxies Survey (VNGS; PI: C. Wilson), a Herschel-SPIRE Local Galaxies Guaranteed Time Program. The VNGS was meant to sample galaxies with multiple morphological and active galactic nucleus types, and includes several well-studied galaxies including the Antennae Galaxies, Arp 220, Centaurus A, M51, and NGC 1068. These two specific galaxies were selected because they are non-interacting nearby (<10 Mpc) spiral galaxies with an inclination from face on ≤60° and major axes >10 arcmin.1 The basic properties of these galaxies are given in Table 1.
Properties of the sample galaxies.a
| Name | RA | Dec. | Hubble | Distance | Size of optical |
|---|---|---|---|---|---|
| (J2000) | (J2000) | type | (Mpc)b | disc (arcmin) | |
| NGC 2403 | 07 36 54.5 | +65 35 58 | SAB(s)cd | 3.2 ±0.3 | 22.0 × 12.3 |
| M83 | 13 37 00.3 | −29 52 04 | SAB(s)c | 4.5± 0.2 | 12.9 × 11.3 |
| Name | RA | Dec. | Hubble | Distance | Size of optical |
|---|---|---|---|---|---|
| (J2000) | (J2000) | type | (Mpc)b | disc (arcmin) | |
| NGC 2403 | 07 36 54.5 | +65 35 58 | SAB(s)cd | 3.2 ±0.3 | 22.0 × 12.3 |
| M83 | 13 37 00.3 | −29 52 04 | SAB(s)c | 4.5± 0.2 | 12.9 × 11.3 |
NGC 2403 is an SAB(s)cd galaxy (de Vaucouleurs et al. 1991) with no clear bulge and flocculent spiral structure (Elmegreen & Elmegreen 1987). Since the brightest star-forming regions are found well outside the centre of the galaxy, it is easy to differentiate between effects related to star-forming regions and either effects related to the evolved stellar population (which peaks in the centre of the galaxy) or effects tied to galactocentric radius. This has been exploited previously to illustrate how PAH emission is inhibited relative to hot dust emission in star-forming regions (Bendo et al. 2008) and to differentiate between different heating sources for the dust seen at 70–500 μm (Bendo et al. 2012a). M83 (NGC 5236) is an SAB(s)c galaxy (de Vaucouleurs et al. 1991) with a bright starburst nucleus (Bohlin et al. 1983) and two strongly defined grand-design spiral arms (Elmegreen, Chromey & Warren 1998). Since we can resolve the spiral structure with Herschel, we can compare the properties of arm and interarm regions quite effectively. Both galaxies are at similar distances; we can resolve structures of <400 pc in the Herschel data. Although both of these galaxies are late-type spiral galaxies, they have the potential to yield different information on how PAHs relate to the far-infrared emission from large dust grains.
We focus our analysis on the Spitzer 24 μm data, which trace emission from very small grains and hot dust heated locally by star-forming regions, and Herschel 160 and 250 μm data, which trace emission from large dust grains. The prior analysis by Bendo et al. (2008) had shown an association between the 8 and 160 μm emission, but as stated above, the 160 μm band may contain significant emission from large dust grains heated by star-forming regions, while the 250 μm band, at least for NGC 2403 and M83, originates more from dust heated by the diffuse ISRF (Bendo et al. 2012a) and could be better associated with PAH emission if PAHs are destroyed in star-forming regions. The next shortest waveband for which we have data for these two galaxies is at 70 μm, but the available 70 μm data have a lower signal-to-noise ratio, and the Spitzer data are strongly affected by latent image artefacts. Moreover, the 70 μm emission may include emission from the same sources as the 24 μm band. The available 350 and 500 μm data trace the same thermal component of dust seen at 250 μm, but because the resolution of those data are coarser compared to the 250 μm waveband, using the data would provide no additional benefit.
For this analysis, we use the techniques developed by Bendo et al. (2008, 2012a) based upon qualitative analyses of surface brightness ratio maps based on images with matching point spread functions (PSFs) and quantitative analyses of the surface brightnesses and surface brightness rations measured in rebinned versions of these images. Section 2 introduces the data and the data preparation steps. We then present the analysis in Section 3 and then use these results to identify the PAH excitation sources in Section 4. Following this, we discuss the implications of these results in Section 5 and provide a summary in Section 6.
2 DATA
The 3.6, 4.5, 5.8, and 8.0 μm data for NGC 2403 were observed with the Infrared Array Camera (IRAC; Fazio et al. 2004) on Spitzer as part of the Spitzer Infrared Nearby Galaxies Survey (Kennicutt et al. 2003), and the 3.6–8.0 μm images for M83 were observed with IRAC by the Local Volume Legacy Survey (Dale et al. 2009). Both groups used similar drizzle techniques to mosaic basic calibrated data to produce final images with 0.75 arcsec pixels. The full width at half-maxima (FWHMs) of the PSFs are listed in Table 2. We also applied correction factors that optimize the data for photometry of extended source emission as suggested by the IRAC Instrument Handbook; these correction factors are listed in Table 2. The calibration uncertainty of the data is 3 per cent (IRAC Instrument and Instrument Support Teams 2013).
Properties of the IRAC instrument.a
| Channel | FWHM | Correction factorsb |
|---|---|---|
| 3.6 μm | 1.7 | 0.91 |
| 4.5 μm | 1.7 | 0.94 |
| 5.8 μm | 1.9 | 0.66 |
| 8.0 μm | 2.0 | 0.74 |
| Channel | FWHM | Correction factorsb |
|---|---|---|
| 3.6 μm | 1.7 | 0.91 |
| 4.5 μm | 1.7 | 0.94 |
| 5.8 μm | 1.9 | 0.66 |
| 8.0 μm | 2.0 | 0.74 |
aThese data are given by the IRAC Instrument Handbook (IRAC Instrument and Instrument Support Teams 2013).2
bThese correction factors are for extended, diffuse emission.
The 24 μm data were acquired using the Multiband Imaging Photometer for Spitzer (MIPS; Rieke et al. 2004) on Spitzer and were reprocessed by Bendo, Galliano & Madden (2012b) using the MIPS Data Analysis Tools (Gordon et al. 2005) along with multiple modifications. The final images have pixel scales of 1.5 arcsec, PSF with FWHM of 6 arcsec (Engelbracht et al. 2007), and calibration uncertainties of 4 per cent (Engelbracht et al. 2007).
The 160 μm data are updated versions of the data published by Bendo et al. (2012a) and Foyle et al. (2012). The galaxies were observed at 160 μm with the Photodetector Array Camera and Spectrometer (PACS; Poglitsch et al. 2010) on Herschel in four pairs of orthogonal scans performed at the 20 arcsec s−1 rate. The observations of NGC 2403 covered a 40 arcmin × 40 arcmin region, while the observations of M83 covered a 25 arcmin × 25 arcmin region. The data were processed using the Herschel Interactive Processing Environment (hipe; Ott 2010) version 11.1. We used the standard data processing pipeline, which includes cosmic ray removal and cross-talk corrections, for the individual data frames. We then remapped the data using scanamorphos version 23 (Roussel 2013), which also removes additional noise in the data and drift in the background signal. We applied a colour correction of 1.01 ± 0.07, which has a mean value and uncertainty appropriate for emission from a modified blackbody with a temperature between 15 and 40 K and an emissivity function that scales as λ−β where β is between 1 and 2 (Müller, Okumura & Klaas 2011).3 The FWHM of the PSF is ∼12 arcsec (Lutz 2012),4 and the flux calibration uncertainty is 5 per cent (Altieri & Vavrek 2013).5
The 250 μm images, produced using data from the Spectral and Photometric Imaging REceiver (SPIRE; Griffin et al. 2010) on Herschel, are also updated versions of the 250 μm images originally published by Bendo et al. (2012a) and Foyle et al. (2012). The observations consisted of one pair of orthogonal scans using the 30 arcsec s−1 scan rate and nominal bias voltage settings. The maps cover a 30 arcmin × 30 arcmin region around NGC 2403 and 40 arcmin × 40 arcmin region around M83. The data were reprocessed using hipe version 12.1 through a pipeline that includes the standard signal jump correction, cosmic ray removal, low-pass filter correction, and bolometer time response corrections, but we used the Bright Galaxy Adaptive Element method (Smith 2012; Auld et al. 2013; Smith et al., in preparation) to remove drift in the background signal and to destripe the data. The final maps were produced using the naive mapmaker in hipe and have pixel scales of 6 arcsec. The FWHM of the PSF is specified by the SPIRE Handbook (Valtchanov 2014)6 as 18.1 arcsec, and the calibration uncertainty is 4 per cent (Bendo et al. 2013). To optimize the data for extended source photometry, we multiplied the data by the point source to extended source conversion factor of 91.289 MJy sr−1 (Jy beam−1)−1 (Valtchanov 2014) and then applied a colour correction of 0.997 ± 0.029, which should be appropriate for a modified blackbody with a temperature between 10 and 40 K and a β between 1.5 and 2 (Valtchanov 2014).
For a discussion on the spiral density waves in M83 in Section 4.2, we also included 0.23 μm data from the Galaxy Evolution Explorer (Martin et al. 2005) produced by Dale et al. (2009, see also Lee et al. 2011). The images have pixel scales of 1.5 arcsec, PSF FWHM of ∼6 arcsec (Martin et al. 2005), and calibration uncertainties of <1 per cent (Morrissey et al. 2007). We applied a foreground extinction correction based on A0.23 μm = 0.56 given by Lee et al. (2011) based on the Cardelli, Clayton & Mathis (1989) extinction law with RV = 3.1.
For measuring quantitative star formation rates (so that we could identify locations that are strongly influenced by star formation using quantitative criteria), we included Hα data for these two galaxies in our analysis. The Hα image for NGC 2403 was originally produced by Boselli & Gavazzi (2002) using data from the 1.20-m Newton Telescope at the Observatoire de Haute Provence. The Hα image for M83 was produced by Meurer et al. (2006) using observations from the Cerro Tololo 1.5-m Telescope taken as part of the Survey for Ionization in Neutral Gas Galaxies. We applied extinction corrections for dust attenuation within the Milky Way using calculations performed by the NASA/IPAC Extragalactic Database7 based on data from Schlegel, Finkbeiner & Davis (1998), and we also use data from the literature to correct for [N ii] emission falling within the wavebands covered by the Hα filters. Details on the data are given in Table 3.
Properties of and corrections for the Hα images.
| Galaxy | NGC 2403 | M83 |
|---|---|---|
| Source | Boselli & Gavazzi (2002) | Meurer et al. (2006) |
| Pixel scale (arcsec pixel−1) | 0.69 | 0.43 |
| PSF FWHM (arcsec) | 3 | 1.6 |
| Calibration uncertainty | 5 per cent | 4 per cent |
| Foreground extinction (AR) | 0.87 | 0.144 |
| [N ii] / Hα ratio | 0.28 ± 0.05a | 0.40 ± 0.13b |
aBoth the 6548 and 6583 Å [N ii] lines fall within the band covered by the Hα filter used in the NGC 2403 observations. This number represents the ratio of emission from both lines to Hα emission measured in the radial strip data from Moustakas et al. (2010).
bThe Hα filter used in the M83 observations includes emission from only the [N ii] 6583 Å line. This ratio is based on the ratio of only that line to Hα emission and is calculated using data from Boissier et al. (2005).
2.1 Data preparation
To study the relation of PAH emission to far-infrared emission from large dust grains, we perform analyses using maps in which the PSFs have been matched to the PSF of the 250 μm data (with a FWHM of 18 arcsec), and we plot data from images with matching PSFs that have been resampled into 18 arcsec bins that represent individual resolution elements within the maps. The data from these bins should be statistically independent. See Bendo et al. (2008, 2012a) for additional discussion on this topic.
In the first step of preparing the data, foreground stars were identified by eye and removed from the Hα, 3.6, 4.5, 5.8, 8, and 24 μm data; these were typically sources that appeared unresolved and that had 3.6/24-μm flux density ratios ≳10. Next, the data were convolved with kernels from Aniano et al. (2011)8 to match the PSFs of the Hα, 3.6, 4.5, 5.8, 8, 24, and 160 μm data to the 18 arcsec PSF of the 250 μm data. This was done to preserve the colour variations across the data when it was rebinned, and it eliminated the need to perform additional aperture corrections. The median background was then measured outside of the optical disc of each galaxy in each waveband and subtracted from the data. For the qualitative map-based analyses, the 3.6–8 μm images were shifted to match the world coordinate systems of the 24, 160, and 250 μm maps so that we could create 8/24-, 8/160-, and 8/250-μm surface brightness ratio maps; the pixel size of each ratio map is set to the pixel size of the image for the longer wavelength data used in the ratios. For the analyses on binned data and for producing the profiles in Section 4.2, the images were all shifted to match the world coordinate system of the 250 μm data and then rebinned into 18 arcsec pixels to match the size of the PSF of the 250 μm data. The rebinning was done so that the centre of each galaxy was located at the centre of an 18 arcsec bin.
3 ANALYSIS OF 8/24, 8/160, AND 8/250 μm RATIOS
3.1 Map-based analysis
Figs 1 and 2 show the 3.6, 8, 24, 160, and 250 μm images used in the analysis (before the application of the convolution or rebinning steps described in Section 2.1). Figs 3 and 4 show the 8/24, 8/160, and 8/250-μm surface brightness ratios of the data after the convolution step but before rebinning. The 8, 24, 160, and 250 μm images all look very similar, demonstrating that the PAHs, hot dust, and cold dust are found in the same large-scale structures. However, the ratio maps demonstrate how the PAH emission varies with respect to the dust traced by the other infrared bands. For comparison to these figures, we also show maps of the SSFR in Fig. 5 .
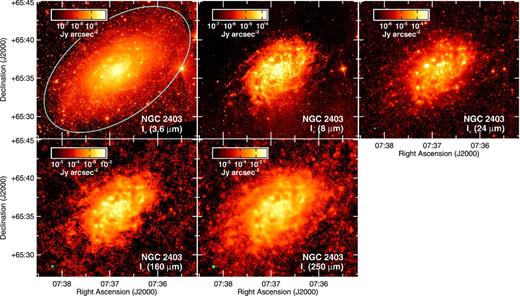
The 21 arcmin × 18 arcmin images of NGC 2403 used in the analysis. North is up and east is to the left in each image. The 3.6 μm maps trace the intermediate-age and older stars. The 8 μm image mainly shows the PAH 7.7 μm emission feature but may also contain small amounts of emission from hot dust and stellar sources. The 24 μm band traces emission from hot (100 K) dust, and the 160 and 250 μm trace emission from colder (15–30 K) dust. The FWHM for each image is shown as a green circle in the lower-left corner of each panel, and the light blue ellipse in the 3.6 μm image outlines the optical disc of the galaxy.
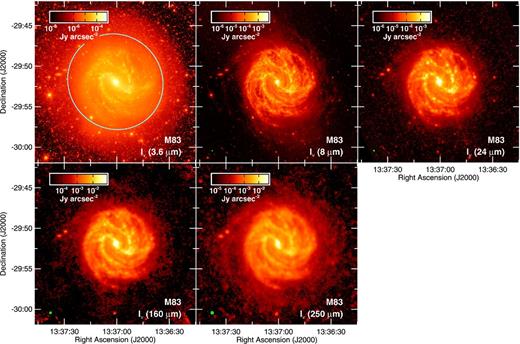
The 20 arcmin × 20 arcmin images of M83 used in the analysis. See Fig. 1 for additional information on the image format.
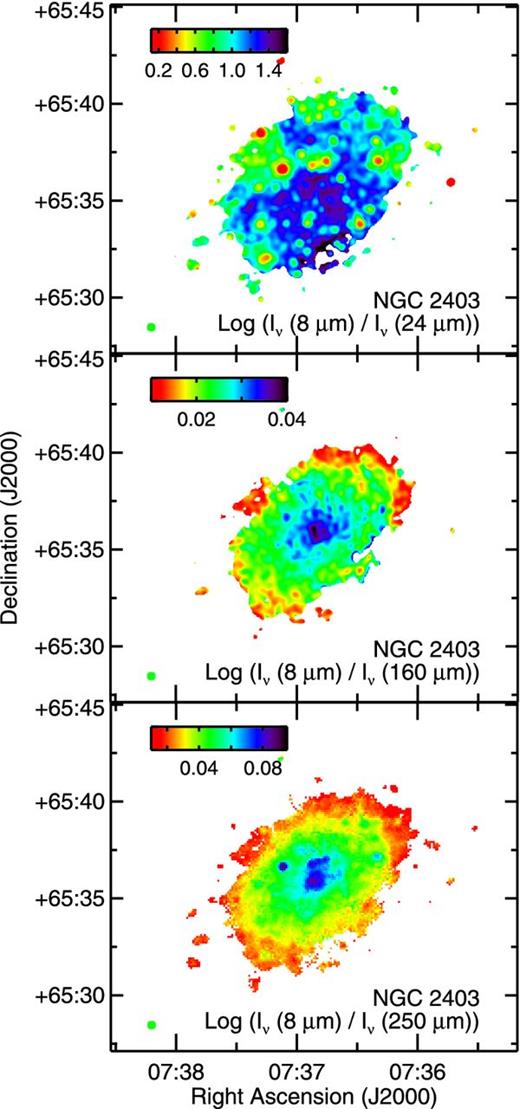
The 8/24-, 8/160- and 8/250-μm surface brightness ratio maps for NGC 2403. These images are based on data where the PSFs are matched to the PSF of the 250 μm data. The FWHM for the 250 μm PSF is shown by the green circle in the lower-left corner of each panel. The colour scales in the images have been adjusted to show the structure in the surface brightness ratios; some of the red or purple pixels may be outside the range of values shown in the colour bars. Data not detected at the 5σ level in either band is left blank. The 8/24 μm ratio is low in star-forming regions where the 24 μm emission is brightest. The 8/160 and 8/250 μm images are similar in that the ratios generally decrease with radius. However, the 8/160 μm ratio shows more structure, while the 8/250 μm map is generally smoother.
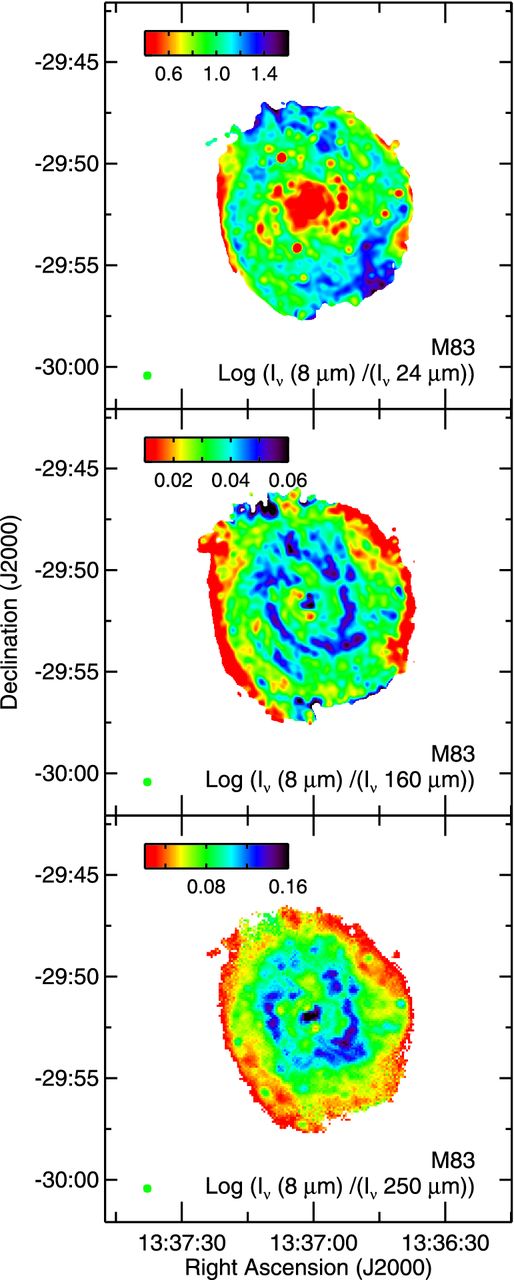
The 8/24-, 8/160- and 8/250-μm surface brightness ratio maps for M83. These images are based on data where the PSFs are matched to the PSF of the 250 μm data. The maps are formatted in the same way as the maps in Fig. 3. We see spiral arm structure in all images. The arm structure in the 8/24 μm image is traced by a series of red point-like sources where the ratio decreases in star-forming regions. However, the filamentary spiral structures in the 8/160 and 8/250 μm maps are locations offset from the 160 and 250 μm emission in Fig. 2 where PAH emission is enhanced relative to cold dust emission.

In both galaxies, we see a decrease in the 8/24 μm ratio in locations where the 24 μm emission peaks. If the PAH emission was tracing star formation in the same way as the hot dust emission, we would see little variation across the 8/24 μm ratio maps. The disparity indicates either that the 24 μm emission is enhanced in regions with high SSFR, that the PAH emission is inhibited where the hot dust emission peaks in the centres of regions with high SSFR, or that both effects occur within the star-forming regions. In NGC 2403, we see the 8/24 μm ratio is higher in the diffuse regions outside the regions with high SSFR, particularly in the southern half of the galaxy. In M83, we see the enhancement of PAHs relative to the 24 μm emission in not only the interarm regions but also between high-SSFR regions in the spiral arms. The 8/24 μm ratio is also very low in the starburst nucleus of M83, as is also seen by Wu et al. (2014).
The 8/160 and 8/250 μm ratio maps for NGC 2403 and M83 present different results for each galaxy. In NGC 2403, the 8/160 and 8/250 μm ratios peak near the centre and decrease with radius, although the 8/160 μm map looks more noisy than the 8/250 μm map. Instead of seeing the PAH emission decrease relative to the cold dust emission in individual regions with high SSFR, as was the case in the 8/24 μm ratio maps, we see the PAH emission enhanced relative to the 160 and 250 μm emission at the location of the infrared-brightest star-forming region in the north-east side of the disc. The 8/160 and 8/250 μm ratios generally do not change significantly near most other star-forming regions. With the exception of the infrared-brightest star-forming region, the radial gradients in the 8/160 and 8/250 μm ratios look similar to the radial gradients in the 3.6 μm image seen in Fig. 1. In NGC 2403, Bendo et al. (2012a) found that the 160/250-μm surface brightness ratios were correlated with Hα emission and peaked in locations with strong star formation, while the 250/350 μm ratios were more strongly correlated with near-infrared emission and generally varied radially in the same way as the older stellar populations. These results demonstrated that the 160 μm emission is dominated by dust heated locally in star-forming regions but the dust seen at 250 μm is heated by the diffuse ISRF. The similarity between the 8/160, 8/250, 250/350, and 3.6 μm radial gradients suggests that the PAHs are intermixed with the cold large dust grains and that the enhancement of PAH emission relative to the large dust grains depends on the surface brightness of the evolved stellar population. If this is the case, the 8/160 μm map may looks noisy compared to the 8/250 μm map because emission in the 8 and 160 μm bands is affected by different stellar populations while emission in the 8 and 250 μm bands is affected by mainly the evolved stellar population.
In the 8/160 and 8/250 μm ratio maps of M83 in Fig. 4, we see large filament-like structures outside the emission from the dust lanes traced by the 250 μm band. To illustrate this offset, we first show contour maps of the 8/250 μm ratio overlaid on the 250 μm maps. We also measured profiles of the 0.23 μm (GALEX near-ultraviolet), 8 μm, 24 μm, 160 μm, and 250 μm emission (in data matched to the PSF of the 250 μm data) as well as the 8/24, 8/250, and 160/250 μm across both spiral arms in three locations along each spiral arm. We show the position of the profiles and then subregions where we map the offsets in Fig. 6, the maps showing the offsets between the 8/250 μm ratio and the 250 μm surface brightness in Fig. 7, and the surface brightness profiles in Fig. 8.
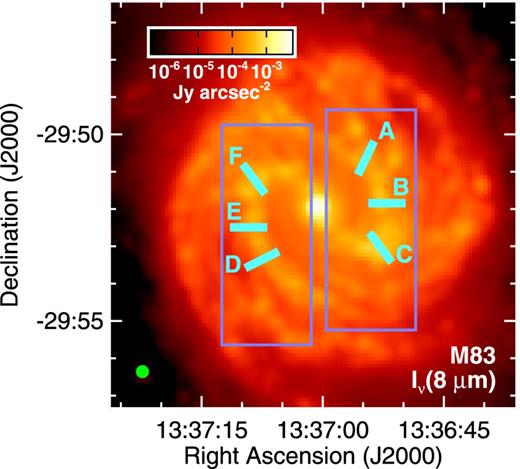
The 8 μm image of M83 (after the PSF has been matched to the PSF of the 250 μm data) showing locations where we produced additional plots to illustrate the offset between the 8/250 μm ratio and the dust emission from the spiral arms. The blue boxes show the locations in Fig. 7 where we overlay contours of the 8/250 and 160/250 μm ratios on the 250 μm data. The cyan lines show the locations of the surface brightness profiles plotted in Fig. 8. The image is formatted in the same way as Fig. 2.
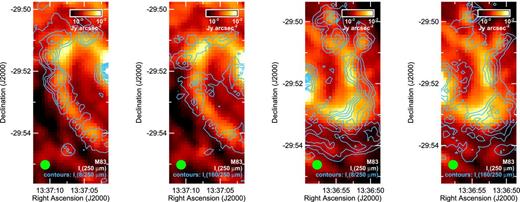
The 250 μm images of the two spiral arms in M83 with the 8/250 μm ratio and 160/250 μm ratio overlaid as contours. The contours for the 8/250 μm ratio start at 0.07 and increase upwards in increments of 0.01. The contours for the 160/250 μm ratio start at 2.4 and increase upwards in increments of 0.2. The images are formatted in the same way as Fig. 2. The 8/250 μm ratios themselves are discussed in Section 3.1, while both the 8/250 and 160/250 μm ratios are discussed in Section 4.2.
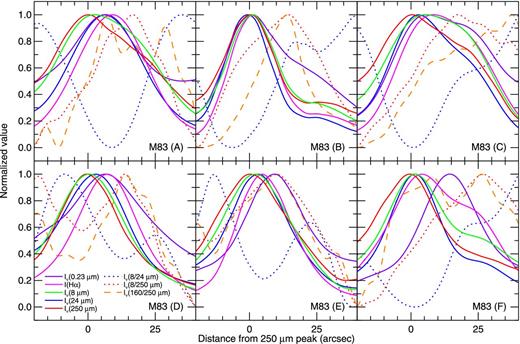
Profiles of the Hα, 0.23, 8, 24, 160, and 250 μm surface brightnesses and 8/24-, 8/250-, and 160/250-μm surface brightness ratios measured in 18 arcsec wide regions along the locations shown in Fig. 6. The x-axis shows the distance from the peak of the 250 μm emission; negative numbers are for the upstream side of the arms, while positive materials are for the downstream side. The profiles were measured in 18 arcsec wide regions in images where the PSF had been matched to the PSF of the 250 μm data, which has an FWHM of 18 arcsec (or ∼400 pc), but the data are supersampled at 1 arcsec resolutions to produce smooth curves. All surface brightnesses are normalized so that the peak values are 1, and all ratios are normalized so that they range between 0 and 1. The uncertainties in the normalized surface brightnesses are ≲ 1 per cent, and the uncertainties in the normalized ratios are ≲ 5 per cent. The Hα data shown here are corrected for foreground dust attenuation but not corrected for dust extinction within M83.
The dust emission for the different wavebands peak in slightly different places in these profiles of the M83's spiral arms. The 250 μm emission, which trace most of the dust mass in the spiral arms, peak on the downstream (or inner) side of the spiral arm. The profile of the 24 μm emission tends to appear narrower and peaks 0–7 arcsec further towards the upstream (or outer) side of the spiral arms (although this is small relative to the 18 arcsec resolution of the data used to create these plots). This is consistent with the classical description of star formation within spiral arms (e.g. Roberts 1969; Elmegreen 1979). First the gas flows into the spiral arms, then the gas is shocked by the spiral density waves and collapses into stars, and finally young stars emerge on the upstream side of the spiral arms.
The 8 μm emission peaks slightly further downstream from the 250 μm emission, and the profiles of the 8 μm emission on the downstream side of the spiral arms is broader than the profiles on the upstream side. This is particularly pronounced for profiles A, C, and F. While the 8/24 μm ratio drops sharply near the star-forming regions as expected, the 8/250 μm ratio peak 10–30 arcsec (or ∼200–650 pc) downstream from the dust lane, as is also seen in the contour overlays in Fig. 7. This demonstrates that the PAHs emission is enhanced relative to the cold dust on the downstream side of the spiral arms well outside the dust lanes. The ultraviolet emission also peaks downstream from the 250 μm emission in many of these profiles and that the profiles of the ultraviolet emission in B and C look broader on the downstream side. The possible connection of these profiles to the ultraviolet emission and to the 160/250 μm ratios is discussed further in Section 4.2.
The offset enhancements in PAH emission in the arms of M83 could appear because of astrometry problems, but we have checked the astrometry among the images using foreground and background sources outside the optical disc of the galaxy and found no significant offsets greater than ∼1 arcsec in the sources between images. It is also possible that the broader PAH emission could result from issues related to the PSF matching step, but usually these types of artefacts will appear symmetric around bright sources, whereas the enhanced PAH emission appears asymmetric. It is more likely that the phenomenon is real and has been difficult to detect before because of limitations in the angular resolution of far-infrared data.
3.2 Analysis of binned data
In Figs 9–11, we plot the relations between the PAH emission at 8 μm and either the hot dust emission at 24 μm or the cold dust emission at 160 and 250 μm. Pearson correlation coefficients for these relations are given in Table 4. To first order, the 8 μm surface brightness is well correlated with the 24, 160, and 250 μm surface brightnesses. However, the 8/24, 8/160, and 8/250 μm ratios reveal the presence of both scatter in the relations between the 8 μm emission and emission in other bands as well as systematic variations in these relations.
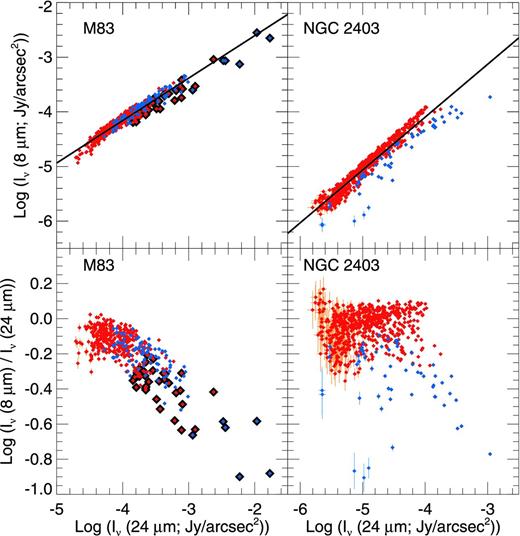
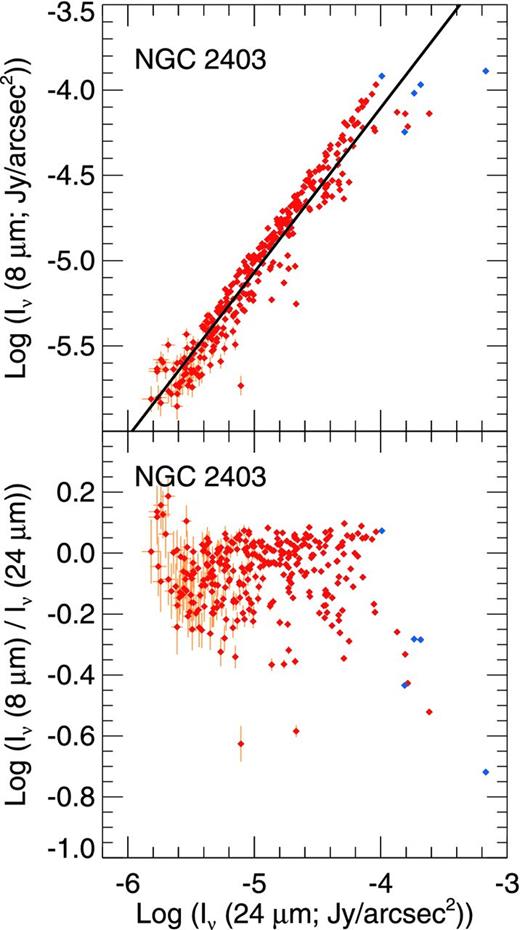
The 8 μm surface brightness and the 8/24 μm ratios as a function of 24 μm emission for the 18-arcsec binned data for both galaxies. Only data detected at the 5σ level are displayed. The best-fitting linear functions between the surface brightnesses (weighted by the errors in both quantities) are shown as black lines in the top panels. The blue points are locations with high SSFR, and the red points and error bars are locations which are predominantly heated by the diffuse ISRF; see Section 2.1 for more details. In M83, we highlight locations within a 1.5 kpc radius of the centre in black.
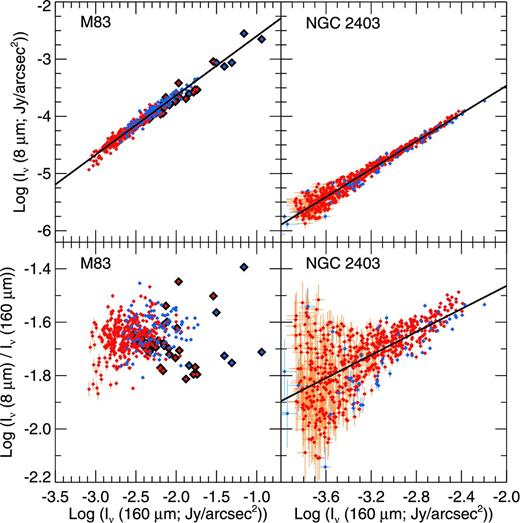
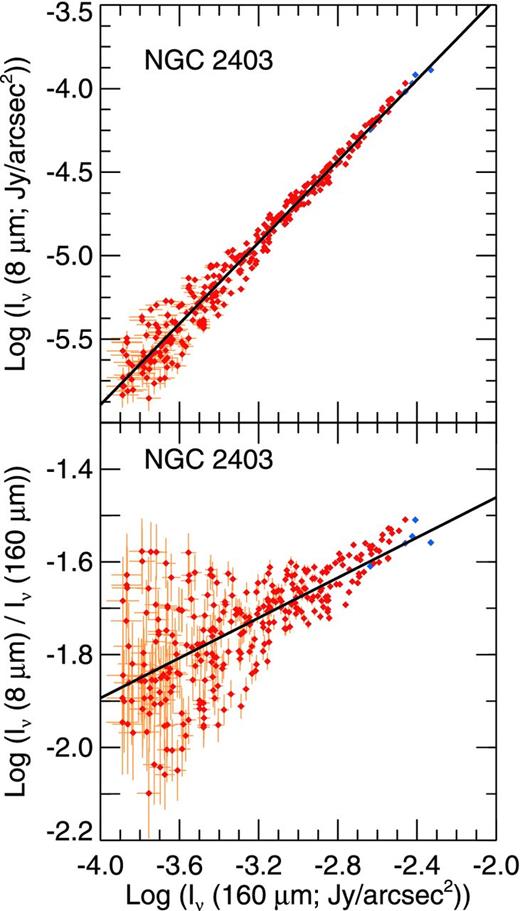
The 8 μm surface brightness and the 8/160 μm ratios as a function of 160 μm emission for the 18-arcsec binned data for both galaxies. The data are formatted in the same way as in Fig. 9.
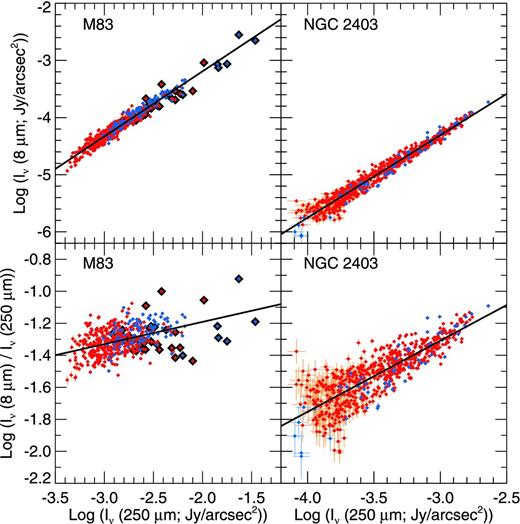
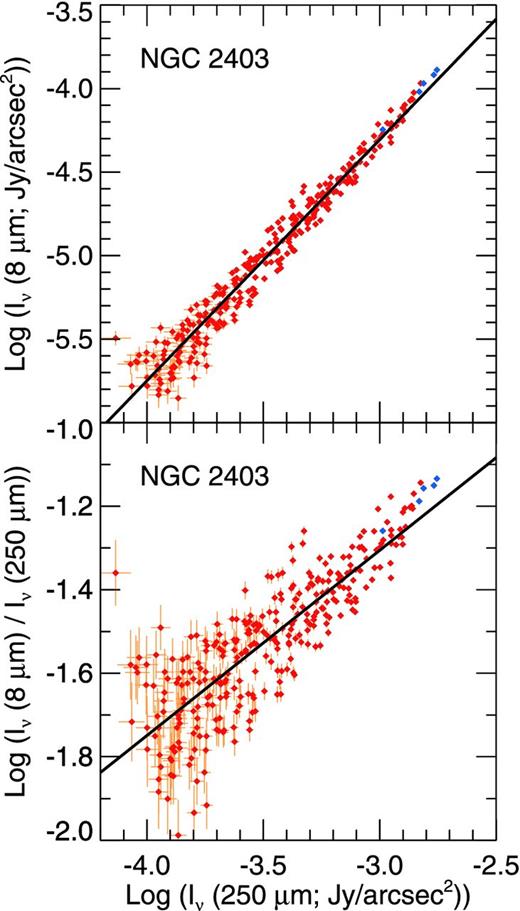
The 8 μm surface brightness and the 8/250 μm ratios as a function of 250 μm emission for the 18-arcsec binned data for both galaxies. The data are formatted in the same way as in Fig. 9.
Pearson correlation coefficients for the binned data.
| NGC | M83 | |
|---|---|---|
| 2403 | ||
| log (Iν(8 μm)) versus log (Iν(24 μm)) | 0.96 | 0.97 |
| log (Iν(8 μm)/Iν(24 μm)) versus log (Iν(24 μm)) | −0.13 | −0.74 |
| log (Iν(8 μm)) versus log (Iν(160 μm)) | 0.98 | 0.98 |
| log (Iν(8 μm)/Iν(160 μm)) versus log (Iν(160 μm)) | 0.66 | 0.17 |
| log (Iν(8 μm)) versus log (Iν(250 μm)) | 0.98 | 0.97 |
| log (Iν(8 μm)/Iν(250 μm)) versus log (Iν(250 μm)) | 0.83 | 0.44 |
The variations in the 8/24 μm ratio in Fig. 9 show that the 8/24 μm ratio decreases in areas where the 24 μm emission is strongest in both galaxies. However, the relations between the 8/24 μm ratio and the 24 μm emission differ somewhat between the two galaxies. In NGC 2403, we found that we could see different trends in the data when we separated the 18-arcsec binned data into two subsets where the SSFR was either ≥1 × 10⁻¹⁰ yr−1 or <1 × 10⁻¹⁰ yr−1. The data with low SSFR follow a relation in which log (Iν(8μm)/Iν(24μm)) increases slightly from ∼0.0 to ∼0.2 as log (Iν(24μm)) increases from −6 to −4. The emission from these regions may originate mainly from locations in the diffuse ISM with relatively soft radiation fields where the PAH emission is well correlated with emission from hot, diffuse dust heated by the diffuse ISRF. As both the PAHs and the hot, diffuse dust are stochastically heated, the ratio of PAH to hot dust emission is expected to be roughly constant. The slight decrease in the 8/24 μm ratio as the diffuse 24 μm surface brightness decreases is potentially a result of an increase in the hardness of the radiation field as the 24 μm surface brightness decreases, possibly as a result of changes in metallicity with radius as found by multiple authors (e.g. Zaritsky, Kennicutt & Huchra 1994; Moustakas et al. 2010), which could lead to either PAH emission being suppressed or 24 μm emission being enhanced. Data points tracing locations with high SSFR fall below the relation between the 8/24 μm ratio and 24 μm surface brightness. These locations would be expected to have harder radiation fields that may enhance the 24 μm emission or suppress the PAH emission. While we are able to empirically separate data into regions with high and low 8/24 μm ratios using a SSFR cutoff value of 1 × 10⁻¹⁰ yr−1, additional work in modelling the stellar populations, the PAH excitation, and the dust heating is needed to understand the details of how the SSFR of the stellar populations affects the variations in the 8/24 μm ratio within NGC 2403.
In M83, the relationship between the 8/24 μm ratio and 24 μm emission is close to linear at log (Iν(24 μm)) > −4, but it flattens at log (Iν(24 μm)) < −4. Some of the lowest 8/24 μm ratios corresponds to regions with high SSFR in the nucleus and spiral arms where, again, the 24 μm emission may be strongly enhanced or the PAH emission is suppressed. The relation between 24 μm emission and the 8/24 μm ratio at log (Iν(24 μm)) > −4 in M83 is similar to the relation seen in NGC 2403. Unlike NGC 2403, however, we found that we could not readily separate data in the plots of log (Iν(8 μm)/Iν(24 μm)) versus log (Iν(24 μm)) for M83 simply by selecting data by SSFR, as some regions with low SSFR have low 8/24 μm ratios. These regions are mostly locations within radii of 1.5 kpc. The exact reason why we see this is unclear, although it is possible that hard ultraviolet photons from the starburst nucleus leak into the diffuse ISM in this region and destroy the PAHs in this region.
Fig. 10 shows good correlations between the 8 and 160 μm surface brightnesses. The plot of the 8/160 μm versus 160 μm for M83 shows that the 8/160 μm ratio is close to constant over a range of infrared surface brightnesses that vary by a factor of 100, indicating that the relation between 8 and 160 μm emission is very close to a one-to-one relationship. Some scatter is seen in the 8/160 μm ratio at high 160 μm surface brightnesses. Some of these data points are for locations around the infrared-bright centre of M83 where the outer regions of the PSF were not matched perfectly in the convolution step, while other data points sample regions along the spiral arms where the enhancement in the 8/160 μm ratio is offset from the 160 μm surface brightness as discussed in Section 3.1. In NGC 2403, the 8/160 μm ratio increases with 160 μm surface brightness, and the relation exhibits more scatter, indicating that the relation of 8 μm emission to 160 μm emission in NGC 2403 is different from the relation for M83.
The relations between the 8 and 250 μm emission in Fig. 11 are similar to the relations between the 8 and 160 μm emission. For both galaxies, the 8/250 μm ratio increases with the 250 μm surface brightness, and the correlation coefficients are relatively strong. In NGC 2403, the correlation coefficient between the 8/250 μm ratio and the 250 μm surface brightness is 0.83, which is much higher than the correlation coefficient of 0.66 for the relation between the 8/160 μm ratio and the 160 μm surface brightness. Given that the square of the Pearson correlation coefficient indicates the fraction of variance in one quantity that depends upon the other quantity, the difference in the correlation coefficients is equivalent to a ∼25 per cent difference in being able to describe the variance in the relations. This suggests that the PAHs are more strongly associated with the colder dust seen at 250 μm than the warmer dust seen at 160 μm. In M83, the relation between the 8/250 μm ratio and 250 μm surface brightness is sloped and also shows significant scatter at high surfaces brightnesses in the same way as the relationship between the 8/160 μm ratio and the 8 μm emission.
Because M83 is at a distance ∼1.5 further than NGC 2403, the 18 arcsec bins used in this analysis will cover regions with different spatial scales. In Appendix A, we examined how the results for the analysis on NGC 2403 would change if we used 27 arcsec bins, which cover approximately the same spatial scales as the 18 arcsec bins used for the M83 data. We see no notable difference in the results using the 27 arcsec bins compared to the 18 arcsec bins; most correlation coefficients change by ≤0.05. Hence, adjusting the bin sizes for the two galaxies to similar spatial scales is unimportant. We will therefore use data measured in the smaller bins as it takes full advantage of the capabilities of the Herschel data that we are using and as it allows us to illustrate how the relations are still found in smaller structure in NGC 2403.
4 IDENTIFICATION OF PAH EXCITATION SOURCES
4.1 PAH excitation in NGC 2403
We can conclude from our analysis that the 8 μm emission that we observe from NGC 2403 does not originate from PAHs excited locally within the centres of star-forming regions, as the relationship between 8 and 24 μm emission shows that PAH 8 μm emission decreases relative to 24 μm emission within regions with high SSFR. This is partly because the 24 μm emission is very sensitive to dust heating and increases significantly within star-forming regions (e.g. Dale et al. 2001; Dale & Helou 2002). However, the strong ultraviolet radiation from these massive young stars probably photodissociates the PAHs in the centres of these regions including species that produce features other than the 7.7 μm feature, as has been seen spectroscopically in other Galactic and extragalactic star-forming regions (Berné et al. 2007; Lebouteiller et al. 2007; Povich et al. 2007; Gordon et al. 2008). PAH emission has been observed in the outer regions of photodissociation regions (Berné et al. 2007; Lebouteiller et al. 2007; Povich et al. 2007); the photons that excite the PAHs in these locations can also heat the very small grains that produce the 24 μm emission. In our data, the emission from the inner and outer regions of these regions will be blended. Integrating over the centres of these regions, the 8/24 μm ratio will still appear low compared to diffuse regions outside these regions because the PAH emission is suppressed in parts of the regions while the 24 μm emission is not, a result also obtained by Calzetti et al. (2005). The dust emitting at 160 μm is also heated by light from star-forming regions (Bendo et al. 2012a). While the 8 μm emission is better correlated with the 160 μm band than with the 24 μm band, the 8/160 μm ratio still shows significant scatter as a function of 160 μm surface brightness, possibly because the PAH emission is still inhibited in the regions from which the 160 μm emission is originating.
However, we see a strong correlation between the 8 and 250 μm surface brightnesses, and the relation between the 8/250 μm ratio and the 250 μm surface brightness shows that the residuals in the relation between the 8 and 250 μm are very small, especially compared to the equivalent residuals for the relations between the 8 μm emission and emission in either the 24 or 160 μm bands. This is particularly evident when comparing the correlation coefficients for the 8/24 μm ratio versus 24 μm emission, the 8/160 μm versus 160 μm emission, and the 8/250 μm ratio versus 250 μm emission in Table 4. This indicates that the PAH emission is much more strongly tied to the dust emitting in the 250 μm band. Bendo et al. (2012a) demonstrated that the dust emitting at ≥250 μm in NGC 2403 was heated mainly by the diffuse ISRF from the total stellar population. This implies that the PAHs in NGC 2403 are also mainly excited by the diffuse ISRF. Moreover, the map of the 8/250 μm ratio in Fig. 3 looks very similar to both the 3.6 μm map in Fig. 1 that traces the light from the total stellar population and the 250/350 μm ratio map from Bendo et al. (2012a) that shows the variations in the colour temperatures of the large dust grains heated by the ISRF from these stars.
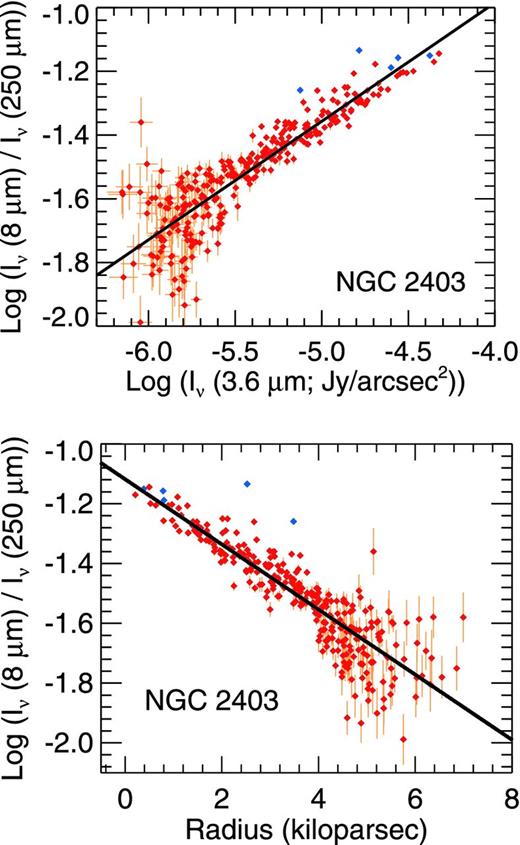
To examine this relation further, we plot the 8/250 μm ratio versus the 3.6 μm surface brightness for NGC 2403 in Fig. 12. We find a strong correlation between 8/250 μm ratio and the 3.6 μm surface brightness; the Pearson correlation coefficient for the relation between these data in logarithmic space is 0.89. This shows that the enhancement of PAH emission relative to cold dust emission scales with the stellar surface brightness, which implies that the PAHs are primarily mixed in with the large dust grains in the diffuse ISM and that the PAHs are predominantly heated by the diffuse ISRF from the total stellar population.
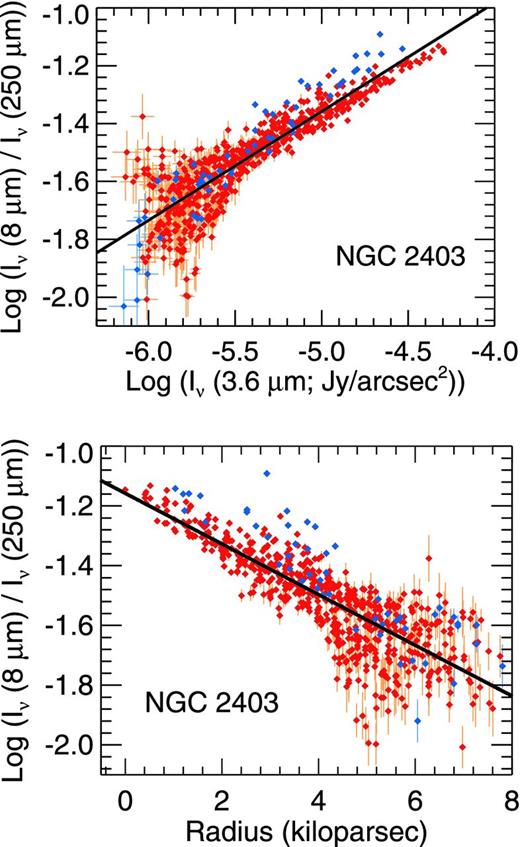
The 8/250-μm surface brightness ratio plotted as a function of the 3.6 μm surface brightness and galactocentric radius for the 18-arcsec binned data for NGC 2403. The data are formatted in the same way as in Fig. 9. The radii are based on using an inclination of |$62.9\deg$| from de Blok et al. (2008).
It is also possible that, because the correlation coefficient for the relation between the logarithm of the 3.6 μm surface brightness and radius is −0.95, the 8/250 μm ratio actually depends on radius rather than 3.6 μm surface brightness. Any radial dependence would be expected to be related to metallicity, which decreases with radius, and this could influence the PAHs. However, the results from Engelbracht et al. (2008) and Gordon et al. (2008) indicated that the apparent dependence of PAH emission on metallicity is really the result of changes in the radiation field illuminating the ISM in lower metallicity environments. The radiation field would be harder in low-metallicity systems first because of increases in the stellar temperatures of O and B stars (Massey et al. 2004, 2005; Trundle et al. 2007) and second because of decreases of extinction related to a decrease in the gas to dust ratio. This in turn leads to harder ISRFs in low-metallicity environments that potentially destroy PAHs. To examine this, we plot the 8/250 μm ratio as a function of radius in the bottom panel of Fig. 12. As expected, the 8/250 μm ratio decreases as radius increases. The relation between the logarithm of the 8/250 μm ratio and radius has a Pearson correlation coefficient of −0.82, which has an absolute value that is similar to the value of 0.89 for the relation between the logarithms of the 8/250 μm ratio and the 3.6 μm emission. However, at the resolution of these data, we do see non-axisymmetric substructures in the 8/250 μm image in Fig. 3 that correspond to similar substructure in the 3.6 μm images, but these structures are mainly visible at radii of <10 kpc. When we look at data within this inner 10 kpc region, we get a correlation coefficient of -0.77 for the relation with radius and 0.91 for the relation with 3.6 μm surface brightness. This implies that the total stellar surface brightness is more influential on PAH excitation than any effects related to radius.
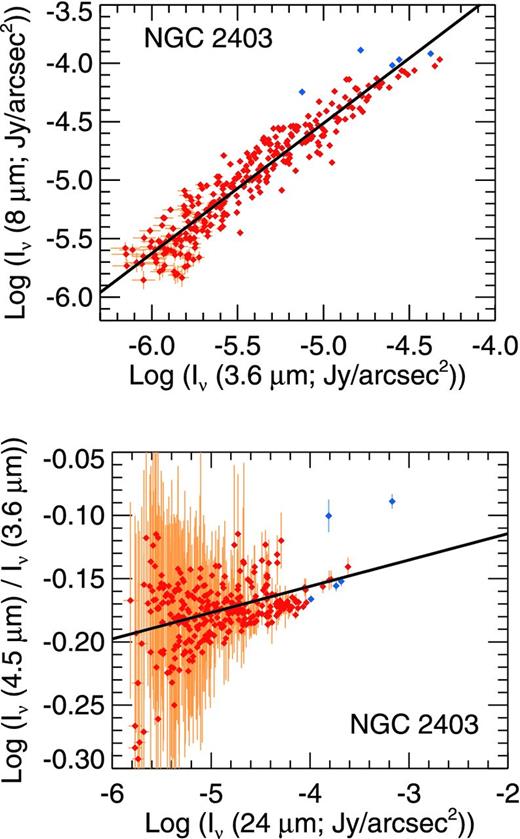
Although it is unlikely, the correlation between the 8/250 μm ratio and 3.6 μm emission could be the result of a correlation between emission in the 3.6 and 8 μm bands themselves. Both bands may contain thermal continuum dust emission (although the thermal continuum emission should have been removed from the 8 μm data when we applied equation 5), and the 3.6 μm band may also contain emission from the 3.3 μm PAH emission feature, although previous work by Lu et al. (2003) indicated that emission at <5 μm from nearby galaxies is dominated by stellar emission. To investigate this further, we plot the relation between the 8 μm PAH emission and 3.6 μm stellar surface brightness in Fig. 13. The data are well correlated; the correlation coefficient for the relation in logarithm space is 0.94. While this could indicate that the same emission sources are seen at 3.6 and 8 μm, it is also possible that the 8 μm emission is correlated with 3.6 μm emission because the stars seen at 3.6 μm excite the PAHs seen at 8 μm. Hence, the correlation between 3.6 and 8 μm does not necessarily prove anything about the relation between the emission in these bands. Mentuch et al. (2010) illustrated that it was possible to identify the influence of non-stellar emission at near-infrared wavelengths by examining the 4.5/3.6-μm surface brightness ratio. This ratio would be relatively invariant for stellar emission because it traces emission from the Rayleigh–Jeans side of the stellar SED, but if hot dust emission influences the bands, the ratio should increase. We plot the 4.5/3.6 μm ratio versus 24 μm emission in the lower panel of Fig. 13. This relationship is almost flat. Most of the data points have log(Iν(4.5 μm)/Iν(3.6 μm)) values that lie within a range of −0.14 to −0.23, which would be consistent with what was observed for evolved stellar populations by Mentuch et al. (2010). The absence of significant variations in the 4.5/3.6 μm ratio with 24 μm implies that the 3.6 and 4.5 μm bands are largely uninfluenced by hot dust emission. We do see a few data points with values of log(Iν(4.5 μm)/Iν(3.6 μm))>−0.14 where the 3.6 and 4.5 μm may be more strongly influenced by non-stellar emission, but these data only weakly influence our results. If we exclude these data, the correlation coefficient for the relation between the 3.6 μm data and the 8/250 μm data changes by <0.01. This shows that the 3.6 μm emission in NGC 2403 is largely dominated by the stellar population and is relatively unaffected by hot dust or PAH emission. Therefore, the most likely explanation for the correlation between the 3.6 and 8 μm emission as well as the correlation between the 3.6 μm emission and the 8/250 μm ratio is that the PAHs are excited by the stellar population seen at 3.6 μm.
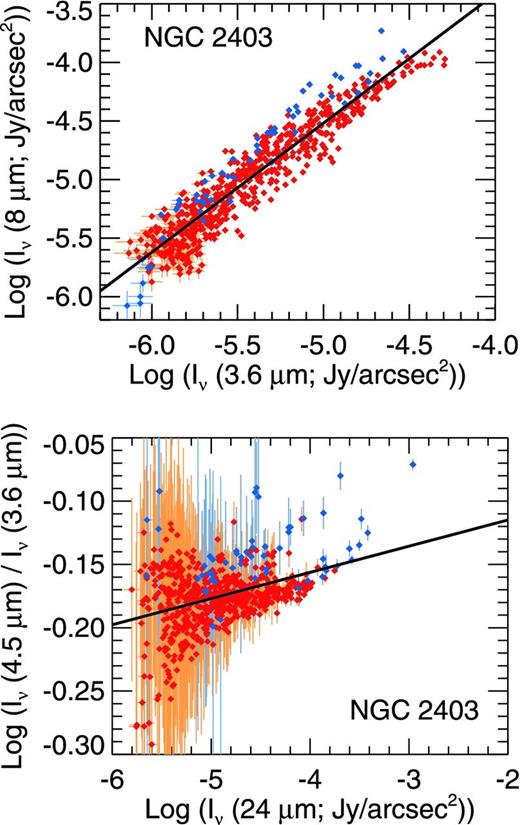
To examine whether the relation between the 3.6 μm emission and the 8/250 μm ratio is related to hot dust or PAH emission in the 3.6 μm band, we first show the relation between 3.6 and 8 μm emission. The relation in the top panel could be the result of either the 3.6 and 8 μm bands tracing emission from similar sources or the 3.6 μm band tracing starlight exciting the PAHs seen in the 8 μm band. Next, we plot the 4.5/3.6 μm ratio as a function of the 24 μm emission in the bottom panel to examine whether the slope of the SED at 3.6–4.5 μm is influenced by hot dust emission. The absence of such a relation as well as the relative invariance of the 4.5/3.6 μm ratio implies that the 3.6 and 4.5 μm bands are relatively unaffected by non-stellar emission. The data are formatted in the same way as in Fig. 9.
4.2 PAH excitation in M83
The results from the 8 to 24 μm relationship in M83 are similar to NGC 2403. We see the 8 μm PAH emission is low in regions where the 24 μm emission peaks. Again, PAHs are probably being destroyed locally in regions with high SSFR. However, we find that 8 μm emission is more strongly related to the 160 and 250 μm emission. We also see offsets between the 8/250 μm ratios and the dust mass (as traced by the 250 μm band). Bendo et al. (2012a, 2014) also found that the 160/250 μm colours appeared offset relative to the star-forming regions in the spiral arms, and Foyle et al. (2012) found a related offset in the dust colour temperatures. This implies that the enhancement in PAH emission relative to cold dust emission is related to the enhancement of the temperature of the dust seen at 160 μm. To examine this relationship further, we map the 250 μm emission from the spiral arms overlaid with contours showing the 160/250 μm ratio in Fig. 7, and we show profiles of the 160/250 μm ratio across the spiral arms in Fig. 8. These plots show that the 8/250 and 160/250 μm ratios trace similar structures offset from the dust mass as well as the Hα and 24 μm emission associated with star formation. To check how well the 8/250 and 160/250 μm ratios are correlated, we plot the two ratios in Fig. 14. The relation has a Pearson correlation coefficient of 0.65, implying that the excitation of PAH emission and the heating of the dust seen at 160 μm are, to some degree, linked.
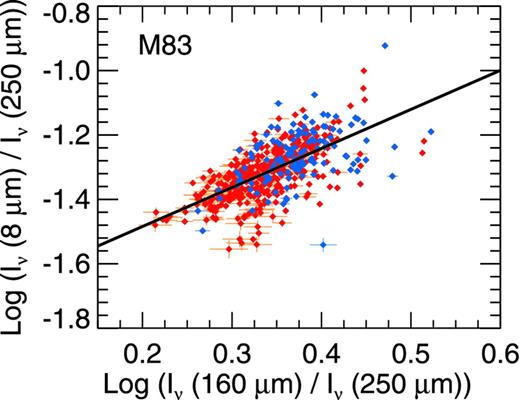
The 8/250-μm surface brightness ratio plotted as a function of the 160/250-μm surface brightness ratio for the 18-arcsec binned data. The data are formatted in the same way as in Fig. 9.
In spiral density waves, as mentioned before, large quantities of gas and dust are expected where the ISM is shocked on the upstream sides of the spiral arms, star-forming regions would be found immediately downstream of the shocks, and older stars would be expected further downstream (e.g. Roberts 1969; Elmegreen 1979; Tamburro et al. 2008; Martínez-García, González-Lópezlira & Bruzual-A 2009; Sánchez-Gil et al. 2011). This could cause offset enhancement of PAH emission relative to spiral arm dust lanes, as seen in Fig. 8 and as also implied by the relation in Fig. 14, in two possible ways.
One possible explanation is that the dense dust lanes on the upstream edge of the spiral arms severely attenuate the starlight escaping from the photoionizing stars within star-forming regions, but light easily escapes across the downstream side of the spiral arms where the dust density is lower. Such a geometrical arrangement of the star-forming regions relative to the dust would produce the slight offsets between the 24 μm emission (tracing obscured star formation) and Hα emission (tracing unobscured star formation) seen in most of the profiles in Fig. 8 and may also explain the downstream areas with enhanced Hα emission in profiles C and F. If photoionizing light is primarily travelling asymmetrically from the star-forming regions and if the 160 μm band traces dust heated by the light escaping from the star-forming regions into the diffuse ISM, the 160 μm emission would appear enhanced relative to 250 μm emission along the downstream side of the spiral arms. Similarly, PAHs mixed in with the dust emitting at 160 μm would be excited by the ultraviolet light escaping from star-forming regions and appear enhanced relative to the dust emission in the same locations, although the total PAH emission itself will peak along the spiral arms where the total mass of the PAHs is greater (which is also true for dust emission observed in any single band).
The other possible explanation is that the PAHs and the dust seen at 160 μm are locally heated by a young, non-ionizing population of stars (stars with ages older than 4 Myr) that have left the dusty star-forming regions in the spiral arms. As shown by Leitherer et al. (1999), such a population would still produce a substantial amount of ultraviolet and blue light that could strongly enhance the PAH emission and the temperature of the large dust grains on the downstream side of the arms, but the radiation from these stars may not include higher energy photons that destroy PAHs. In the profiles in Fig. 8, the ultraviolet emission either peaks downstream of the dust mass or has a profile on the downstream side that is broader than the dust emission profile. Additionally, the ultraviolet emission appears to stronger relative to the Hα emission in most downstream locations. This provides additional support for the possibility that the 8 μm emission observed in M83 originates from PAHs excited locally by young, non-ionizing stars, although additional analysis would be needed to confirm this.
It is also worth briefly noting that we do not see variations in the 8/160 or 8/250 μm ratios in M83 that imply a dependence upon radius and hence a dependence upon the metallicity, which decreases with radius (Zaritsky et al. 1994). The variations in the PAH emission with respect to the cold dust emission are driven mainly by local excitation of the PAHs.
5 DISCUSSION
The results show that the 8/24 μm ratio decreases in many regions with high SSFR, in agreement with previous findings from Helou et al. (2004), Calzetti et al. (2005), Bendo et al. (2006, 2008), Madden et al. (2006), Berné et al. (2007), Lebouteiller et al. (2007), Povich et al. (2007), Gordon et al. (2008), and Calapa et al. (2014). Even though our analysis is mainly focused on the 7.7 μm PAH feature that falls within IRAC channel 4, the results from Lebouteiller et al. (2007), Povich et al. (2007), and Gordon et al. (2008) suggest that other PAH emission features may also decrease relative to hot dust emission within star-forming regions.
Our results showing the correlation of the 8 μm emission from PAHs with the far-infrared emission from large dust grains is largely in agreement with the results from Haas et al. (2002), Bendo et al. (2008), and Calapa et al. (2014). However, the general conclusion from these papers had been that the PAHs are mixed with large grains heated by the diffuse ISRF. While NGC 2403 certainly fits that scenario, M83 does not. Instead, PAH emission in M83 is more strongly associated with large dust grains heated either by light escaping from star-forming regions and travelling hundreds of pc away from the spiral arms or locally by young stars that produce substantial non-ionizing ultraviolet radiation, which was unexpected. Further study would be needed to determine whether such variations in PAH excitation are seen among other nearby galaxies as well.
PAH may be excited by different radiation fields in NGC 2403 and M83 because of the differences in the spiral structure in the two galaxies. Because NGC 2403 is a flocculent spiral galaxy, star formation is expected to be triggered by clouds collapsing in local gravitational instabilities (e.g. Tosaki et al. 2003; Dobbs & Pringle 2010). In such a scenario, inflowing dust on scales of tens or hundreds of parsecs may be roughly symmetrically distributed around star-forming regions, although more modelling work on cloud collapse in flocculent galaxies is needed to confirm this. If the dust is distributed this way, dust near the centres of these shells would absorb the ultraviolet and blue light from the star-forming regions inside, and any PAHs within these central regions would be destroyed. Meanwhile, dust and PAHs in the outer shells would be shielded from the light from the star-forming regions and would instead be heated by the diffuse ISRF. Also note that the stars in spiral arm filaments in flocculent spiral galaxies are not expected to vary in age with distance from the spiral arms in the same way as seen in grand-design spiral galaxies (Dobbs & Pringle 2010). If young, non-photoionizing stars contribute significantly to PAH excitation, then the relatively homogeneous distribution of these stars may result in the PAHs appearing enhanced over broad areas rather than appearing enhanced near the spiral filaments. In contrast to NGC 2403, M83 is a grand-design spiral galaxy in which cold, dusty gas flows into star-forming sites mainly from one side of the spiral arms and star-forming regions emerge from the other side (e.g. Elmegreen 1979; Garcia-Burillo, Guelin & Cernicharo 1993; Tamburro et al. 2008; Egusa et al. 2009; Vlahakis et al. 2013). Hence, dust will preferentially be located upstream of individual star-forming regions within M83. As described in Section 4.2, PAHs are destroyed within the centres of these star-forming regions, but PAHs in the diffuse ISM could be excited by starlight diffusing out of the optically thin side of the star-forming regions. Additionally, multiple studies (e.g. Martínez-García et al. 2009; Sánchez-Gil et al. 2011) have found gradients in the ages of the stellar populations downstream of spiral arms in grand-design spiral galaxies. PAH emission could appear enhanced downstream of star-forming regions if the PAHs are destroyed in photoionizing regions but strongly excited locally in regions with soft ultraviolet emission from young, non-photoionizing stars. If these geometrical descriptions for the relation between PAHs and excitation sources is accurate, then we should find that PAHs are excited by the diffuse ISRF in other flocculent late-type spiral galaxies while PAHs are excited in regions offset from star-forming regions in other grand-design spiral galaxies.
Some dust emission models (e.g. Draine et al. 2007) and radiative transfer models (e.g. Popescu et al. 2011) show PAHs as excited by the radiation fields from all stellar populations regardless of the hardness or intensity of the fields.10 Our results show that this approach is an oversimplification of PAH excitation. New refinements in dust emission and radiative transfer models are needed to replicate how PAHs are excited by radiation fields from different stellar populations within different galaxies and how the PAH/dust mass ratio may change with variations in the hardness of the illuminating radiation field. For example, Crocker et al. (2013) used stellar population synthesis and simplified models of dust and PAH absorption to predict the contributions of different stellar populations to PAH excitation in NGC 628 and found that ∼40 per cent of the PAHs are excited by stars <10 Myr in age, ∼20 per cent are excited by stars with ages of 10–100 Myr, and the remainder are excited by stars >100 Myr in age. It is also apparent that PAH excitation changes across spiral density waves (either because of details in the geometry of the star-forming regions or because of variations in the stellar populations on either side of the waves), and it would be appropriate to make improvements to radiative transfer models so that they can replicate these effects.
Our results have multiple implications for using PAH emission as a proxy for other quantities. While PAH emission cannot be used on sub-kpc scales to measure accurate star formation rates, groups such as Zhu et al. (2008) and Kennicutt et al. (2009) have suggested using globally-integrated PAH emission to estimate extinction corrections for optical star formation tracers such as Hα emission, thus producing extinction-corrected global star formation metrics. When PAHs are excited by star-forming regions, globally-integrated PAH emission should more accurately represent the light attenuated by dust in star-forming regions and should provide fairly accurate star formation rates. When PAHs are excited by the diffuse ISRF, however, the connection between star formation and PAH emission is less clear, and star formation rates calculated using PAH emission could be less reliable.
Previous results showing a relation between PAH emission and far-infrared emission from large dust grains had implied that PAHs could be used as a proxy of dust mass (e.g. Bendo et al. 2008). In cases where the PAHs are associated with dust heated by the diffuse ISRF, this should still be appropriate, although metallicity-related effects would still need to be taken into account. In cases where the PAHs are heated by diffuse light from star-forming regions or from young, non-photoionizing stars that have emerged from star-forming regions, the PAH emission will still scale approximately with dust mass but will also vary depending upon the radiation field from the young stars. In this situation, using PAH emission to trace dust mass may be less reliable.
Multiple authors have identified an empirical relation between either radially-averaged or globally-integrated PAH and CO emission (Regan et al. 2006; Bendo et al. 2010a; Tan et al. 2013; Vlahakis et al. 2013), implying that the PAHs are, to some degree, correlated with molecular gas. This would be expected if the PAHs also trace the cold dust that is found associated with the molecular gas. However, the relation between PAH and CO emission breaks down on small spatial scales, including in NGC 2403 (Bendo et al. 2010a, but also see Tan et al. 2013). In M51, Vlahakis et al. (2013) found an offset between PAH and CO emission in the spiral arms, with the molecular gas associated with the cold dust in the locations where material is entering the spiral arms and the PAH emission appearing enhanced further downstream where it is excited by light from young stars. Our results imply that, in future work, we may be able to measure a similar offset between PAH and CO emission in M83 as well as other grand-design spiral galaxies. While PAH emission was already shown to be a poor tracer of molecular gas on sub-kpc scales, the phenomenology of PAHs excitation in spiral density waves causes even more problems with using it as a proxy for molecular gas.
6 CONCLUSIONS
We identified different relations between PAH emission and far-infrared emission from large dust grains in the two galaxies we examined. For NGC 2403, we find the 8 μm emission is most strongly associated with emission from cold dust at 250 μm. In particular, we find that the 8/250 μm ratio shows a very strong dependence upon the 3.6 μm emission from the total stellar population, indicating that the PAHs are mixed in with the diffuse dust and heated by the diffuse ISRF from the total stellar population. Star-forming regions play a much less significant role in the excitation of the PAHs observed in the 8 μm band. In contrast, we see in M83 that the PAH emission is more strongly associated with the 160 μm emission from large grains heated by star-forming regions as implied by the strong correlation between the 160/250 and 8/250 μm ratios. This illustrates that PAHs in M83 are excited either by starlight escaping asymmetrically from star-forming region so that locations towards the downstream edges of the spiral arms show enhancement in 8 μm emission compared to the dust mass or that the PAHs are excited locally by young, non-photoionizing stars that have migrated downstream from the spiral arms.
Many dust emission and radiative transfer models currently treat PAHs as though they are excited by all radiation fields of all intensities from all stellar populations within the galaxies to which they are applied, much in the same way that emission from silicate and large carbonaceous dust grains is modelled. The results from just these two galaxies show that this assumption is not universally applicable. These dust models need to be adjusted to account for the observational results showing that PAHs are sometimes excited by the diffuse ISRF from the total stellar population and sometimes excited either by young, non-photoionizing stars that have emerged from star-forming regions or light escaping from these regions and travelling hundreds of pc away (although the PAH emission may be inhibited within the star-forming regions themselves). Additionally, some models rely upon using a single SED shape (such as the SED of the local ISRF) for the radiation field illuminating PAHs and dust. Such models cannot account for the possibility that PAH emission could be inhibited if the radiation fields are excessively hard. To properly characterize the PAH excitation, it is necessary to model the PAHs as being illuminated by radiation fields with different spectral shapes.
Our data here show differences between the PAH excitation within two galaxies with similar Hubble types. We should expand the analysis to include galaxies with a wider range of Hubble types, including E, S0, and Sa galaxies where the evolved stellar populations may play a larger role in dust heating and therefore may be more responsible for PAH excitation. We should also examine other grand-design spiral galaxies to determine whether PAH emission from the spiral arms in these galaxies is offset from the star-forming regions in the same way that it is in M83. This research will lead to a better understanding of PAH excitation mechanisms as well as the relation of PAHs to star formation and large dust grains.
This work has been produced as part of an MSc thesis for the University of Manchester. SPIRE has been developed by a consortium of institutes led by Cardiff University (UK) and including: University Lethbridge (Canada); NAOC (China); CEA, LAM (France); IFSI, Univ. Padua (Italy); IAC (Spain); Stockholm Observatory (Sweden); Imperial College London, RAL, UCL-MSSL, UKATC, University Sussex (UK); and Caltech, JPL, NHSC, Univ. Colorado (USA). This development has been supported by national funding agencies: CSA (Canada); NAOC (China); CEA, CNES, CNRS (France); ASI (Italy); MCINN (Spain); SNSB (Sweden); STFC, UKSA (UK); and NASA (USA). IDL is a postdoctoral researcher of the FWO-Vlaanderen (Belgium).
M81 is also in the VNGS, but the analysis of PAH emission from that galaxy is covered by Lu et al. (2014).
Available from http://www.astro.princeton.edu/∼ganiano/Kernels.html. Note that the kernels are created using circularised versions of instrumental PSFs. In the case of the IRAC data, the circularized PSFs have FWHM ranging from 1.9 to 2.8 arcsec, which is larger than the original PSFs.
The equation given by Marble et al. (2010) also includes a term that integrates the emission in frequency and converts the data into units of erg s−1 cm−2. Since we are comparing the PAH emission in the 8 μm band to continuum emission in other bands that is measured in Jy arcsec−2, it is easier to keep the 8 μm data in units of Jy arcsec−2, so we do not include the unit conversion term in this equation.
The version of the Draine et al. (2007) model typically applied to infrared SEDs is usually based on dust heated by a radiation field with the same spectral shape as the local ISRF as specified by Mathis, Mezger & Panagia (1983). When applying the dust model to data, only the amplitude of the radiation field is treated as a free parameter. However, Draine et al. (2014) include an example of SED fitting with the Draine et al. (2007) model in which the spectral shape of the illuminating radiation field is also allowed to vary.
REFERENCES
APPENDIX A: ANALYSIS OF NGC 2403 USING DATA MEASURED IN 27 ARCSEC BINS
The two galaxies are located at different distances. NGC 2403 is at a distance of 3.2 Mpc, while M83 is at 4.5 Mpc; the difference in distances is approximately a factor of 1.5. However, the analysis relies upon measurements in 18 arcsec bins, which represent different spatial scales in the two galaxies. To test whether distance effects could have biased our results for NGC 2403, we repeat the analyses on NGC 2403 in Section 3.2 and 4.1 using 27 arcsec pixels, which is close to the same spatial scale as the 18 arcsec bins used for the analysis on M83.
For comparison to Figs 9–11, we present in Figs A1–A3, comparisons between the 8 μm emission and either the 24, 160, or 250 μm emission as measured within 27 arcsec bins in NGC 2403. Correlation coefficients for the relations measured in the 18 and 27 arcsec bins are shown in Table A1.
The 8 μm surface brightness and the 8/24 μm ratios as a function of 24 μm emission for the 27-arcsec binned data for NGC 2403. Only data detected at the 5σ level are displayed. The blue points are locations with high SSFR, and the red points and error bars are locations that are predominantly heated by the diffuse ISRF. The best-fitting linear functions between the surface brightnesses (weighted by the errors in both quantities) are shown in the top panels.
The 8 μm surface brightness and the 8/160 μm ratios as a function of 160 μm emission for the 27-arcsec binned data for NGC 2403. The data are formatted in the same way as in Fig. A1.
The 8 μm surface brightness and the 8/250 μm ratios as a function of 250 μm emission for the 27-arcsec binned data for NGC 2403. The data are formatted in the same way as in Fig. A1.
The top two panels are the 8/250-μm surface brightness ratio plotted as a function of the 3.6 μm surface brightness and galactocentric radius for the 27-arcsec binned data for NGC 2403. The data are formatted in the same way as in Fig. A1. The radii are based on using an inclination of |$62.9\deg$| from de Blok et al. (2008).
The top panel is the 8 to 3.6 μm relationship. The lower panel plots the 4.5/3.6 μm ratio versus 24 μm relationship. The data are formatted in the same way as in Fig. 9.
Pearson correlation coefficients for the binned data.
| NGC 2403 | ||
|---|---|---|
| Bin size (arcsec) | 18 | 27 |
| log (Iν(8 μm)) versus log (Iν(24 μm)) | 0.96 | 0.96 |
| log (Iν(8 μm)/Iν(24 μm)) versus log (Iν(24 μm)) | −0.13 | −0.13 |
| log (Iν(8 μm)) versus log (Iν(160 μm)) | 0.98 | 0.98 |
| log (Iν(8 μm)/Iν(160 μm)) versus log (Iν(160 μm)) | 0.65 | 0.69 |
| log (Iν(8 μm)) versus log (Iν(250 μm)) | 0.98 | 0.98 |
| log (Iν(8 μm)/Iν(250 μm)) versus log (Iν(250 μm)) | 0.83 | 0.84 |
| log (Iν(8 μm)) versus log (Iν(3.6 μm)) | 0.94 | 0.95 |
| log (Iν(8 μm)/Iν(250 μm)) versus log (Iν(3.6 μm)) | 0.89 | 0.88 |
| log (Iν(8 μm)) versus Radius (Kpc) | −0.82 | −0.88 |
We see the relations do not change much at all. The correlation coefficients change by ≤0.06, which is negligible. Given the 27-arcsec binned data, we would reach the same conclusions. We still see significant scatter in the relation between 8 and 24 μm data (as exhibited by the low correlation coefficient for the relation between the 8/24 μm ratio and 24 μm emission) while we still see very little scatter in the relation between the 8 and 250 μm emission (as exhibited by the high correlation coefficient for the relation between the 8/250 μm ratio and 250 μm emission). We also still see that the 8/250 μm ratio is very strongly correlated with the 3.6 μm emission.
Ultimately, these results indicate that we can obtain the same results with the coarser resolution data for NGC 2403. Resolution effects have a negligible effect on our analysis and are therefore not a major concern when comparing the results from NGC 2403 with the results for M83.
