


Abstract
We have found a rotationally split series of core g-mode triplets and surface p-mode multiplets in a main-sequence F star, KIC 9244992. Comparison with models shows that the star has a mass of about 1.45 M⊙, and is at an advanced stage of main-sequence evolution in which the central hydrogen abundance mass fraction is reduced to about 0.1. This is the second case, following KIC 11145123, of an asteroseismic determination of the rotation of the deep core and surface of an A-F main-sequence star. We have found, essentially model independently, that the rotation near the surface, obtained from p-mode splittings, is 66 d, slightly slower than the rotation of 64 d in the core, measured by g-mode splittings. KIC 9244992 is similar to KIC 11145123 in that both are near the end of main-sequence stage with very slow and nearly uniform rotation. This indicates the angular momentum transport in the interior of an A-F star during the main-sequence stage is much stronger than that expected from standard theoretical formulations.
1 INTRODUCTION
The internal rotation of stars, which undoubtedly affects the evolution of all stars in various ways, is only poorly understood and remains one of the unsolved fundamental problems in stellar astrophysics. The development of asteroseismic investigation is changing the situation, making it now possible to observe the previously invisible stellar internal rotation.
Stellar rotation affects the frequency spectrum of stellar oscillation modes. It induces a multiplet fine structure, for which the frequency separations of the multiplet components are dependent on the internal rotation profile of the star, as well as the stellar structure. In principle, the rotation profile can be inferred by carefully studying the oscillation frequency spectrum.
The first success was the case of the Sun, for which a spatially resolved image is observable, hence a large number of p modes with a wide range of horizontal scales can be detected. It was shown, through the measurement and analysis of frequencies of the solar p modes, that the convective envelope of the Sun rotates differentially with respect to latitude, but with relatively little radial dependence, while the radiative interior, at least down to ∼40 per cent in radius from the centre, rotates nearly uniformly at a rate slightly slower than the surface equatorial rate (Schou et al. 1998; Korzennik & Eff-Darwich 2012). Due to lack of firm detection of g modes, which are sensitive to the much deeper interior, the rotation profile near the solar centre is as yet unknown. Nevertheless, the helioseismic result showing nearly uniform rotation in the bulk of radiative interior was a surprise, since the deep interior was expected to rotate more rapidly than the envelope as a consequence of gradual evolutionary contraction of the core, from a naive consideration assuming local conservation of angular momentum. This finding stimulated theoretical attempts to explain the mechanism of angular momentum transport in the Sun (e.g. Gough & McIntyre 1998; Talon, Kumar & Zahn 2002; Mathis et al. 2008).
The almost uninterrupted continuous photometry with unprecedented low noise level carried out by space missions opened a new window to unveil the internal rotation of distant stars. Although the number of detected oscillation modes in unresolved distant stars is much smaller than the solar case, in many sub-giants and red giants, so-called mixed modes have been detected, in addition to p modes. Those mixed modes have dual characters of p modes and g modes and provide us with information of the rotation rate in the deep interior. It was then clearly confirmed that, in several sub-giants and red giants, their cores rotate faster than the envelopes (Beck et al. 2012; Deheuvels et al. 2012, 2014; Mosser et al. 2012). However, the contrast between the core and the surface is weaker than expected. Therefore, a strong mechanism for angular momentum transport must be acting at some evolutionary stages before stars become red giants. It is then important to investigate systematically the interior rotation of stars in the earlier evolutionary stages.
With the aim to observe the interior rotation of main-sequence stars, our previous study (Kurtz et al. 2014) revealed, for the first time, the rotation of a main-sequence A star, KIC 11145123, at the surface and in the core. We found it to be nearly a rigid rotator with a rotation period near to 100 d and with the surface rotating slightly faster than the core. In addition, we found from the period spacings of consecutive radial order of g modes that the star is contracting at the evolutionary stage of core hydrogen exhaustion, i.e. the star is near to the terminal-age main sequence (TAMS). Such remarkable findings of the internal rotation and the evolutionary stage of KIC 11145123 were possible because the star has a rich frequency spectrum with many rotational multiplets for both p modes and g modes. We have now found another Kepler star, KIC 9244992, to have similarly rich frequencies in g modes as well as p modes, which makes another detailed analysis possible. This paper presents the results of our analysis on this star.
1.1 KIC 9244992
KIC 9244992 has a Kepler magnitude Kp = 14. From the Kepler Input Catalogue (KIC) revised photometry (Huber et al. 2014), its effective temperature is Teff = 6900 ± 300 K (log Teff = 3.839 ± 0.018) and its surface gravity is log g = 3.5 ± 0.4 (cgs units), showing it to be a main-sequence, or possibly post-main-sequence F star. The metallicity is estimated to be [Fe/H]=−0.15 ± 0.30. Based on its high tangential velocity, Balona & Nemec (2012) included this star in their list of SX Phe candidates. A recent spectroscopic study by Nemec et al. (in preparation) gives |$T_{\rm eff} = 7000 ^{+300}_{-100}$| K, |$\log g = 3.8 ^{+0.2}_{-0.3}$|, and vsin i < 6 km s−1. KIC 9244992 is somewhat cooler than KIC 11145123 (Teff ≈ 8000 K).
2 OBSERVATIONS AND FREQUENCY ANALYSIS
The data used for the analysis in this paper are the Kepler quarters 1 to 17 (Q1–Q17) long cadence (LC) data, which include all of the available data. The star was not observed in Q0, nor was it observed in short cadence. Kepler has an orbital period about the Sun of 372.4536 d, hence the quarters are just over 93 d. We used the multiscale, maximum a posteriori (msMAP) pipeline data; information on the reduction pipeline can be found in the data release 21 notes.1 To optimize the search for exoplanet transit signals, the msMAP data pipeline removes or alters astrophysical signals with frequencies less than 0.1 d−1 (or periods greater than 10 d). A high-pass filter was run to remove noise below 0.2 d−1, where there is no stellar signal. None of the pulsation frequencies we analyse in this paper are near to that lower limit, but if the star has a direct rotational signal, e.g. from star-spots, that will have been erased by the pipeline and our high-pass filter.
We extracted pulsation frequencies first with a discrete Fourier transform amplitude spectrum analysis (Kurtz 1985), then by fitting the obtained frequencies by least squares, then non-linear least squares, along with all previously identified frequencies at each step. We selected a portion of the amplitude spectrum that showed only white noise to estimate the uncertainties of the frequencies and phases that are listed in tables below. These uncertainties are similar to those that would be obtained by pre-whitening all significant peaks from the amplitude spectrum and then fitting all frequencies by least squares. They do not include the effects of possible unresolved peaks, which could shift the frequency up to 1.7 × 10⁻⁴ d−1 for the 4-yr length of the data (Kallinger, Reegen & Weiss 2008), in the worst case.
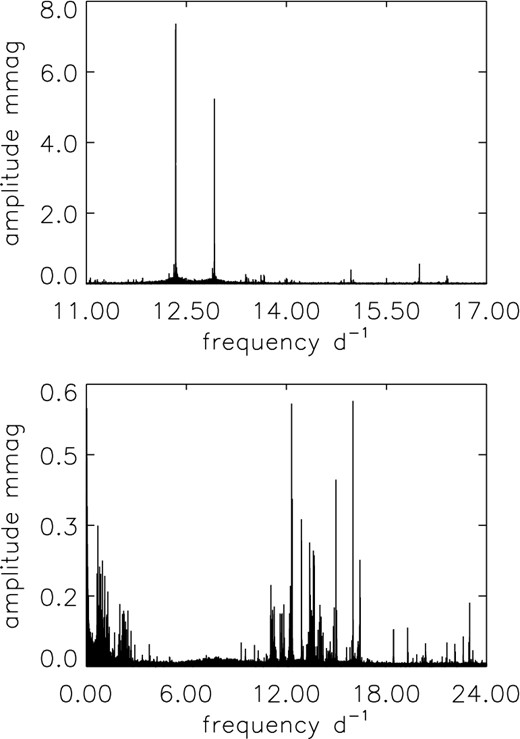
Fig. 1 shows a full amplitude spectrum nearly out to the Nyquist frequency for KIC 9244992 for the nearly continuous Kepler Q1–17 LC data spanning 1459 d (4.0 yr). There are pulsations in both the g-mode and p-mode frequency regions, which are clearly separated. In the p-mode frequency range, the highest amplitude peak is a singlet, presumably from a radial mode, and there are six triplets and an isolated quintuplet (or septuplet) split by rotation. The g-mode frequency range is dominated by a series of 17 high-overtone dipole mode triplets split by the rotation frequency in the core of the star.
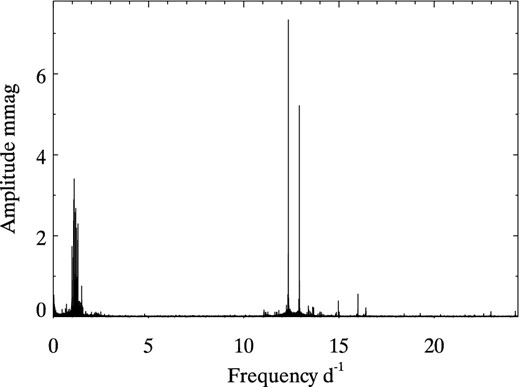
The amplitude spectrum for the Q1 to Q17 Kepler LC data up to nearly the Nyquist frequency for KIC 9244992, showing the clearly separated p-mode and g-mode frequency range.
2.1 The g modes
Fig. 2 shows amplitude spectra for the g-mode frequency range. High-amplitude g modes lie in the frequency range 0.9–1.6 d−1 (middle panel). A first search for high-amplitude g modes in this range yielded 45 frequencies: 14 triplets and 3 other frequencies. The bottom panel shows the amplitude spectrum after removing these 45 frequencies. From the pre-whitened data, we found additional five triplets. Among the triplets obtained, two at 0.45 and 4.8 d−1 (see Fig. 3) are notably far from the main g-mode frequency range. The higher frequency mode, having rotational splittings similar to the high-amplitude g modes, can be identified as a relatively low-order dipole g mode, while the splitting of the lower frequency triplet is much larger so that the mode identification is unclear. The bottom panel of Fig. 2 indicates the presence of more pulsation modes in the g-mode range. However, we have stopped searching for further small amplitude modes because of smaller signal-to-noise ratios.
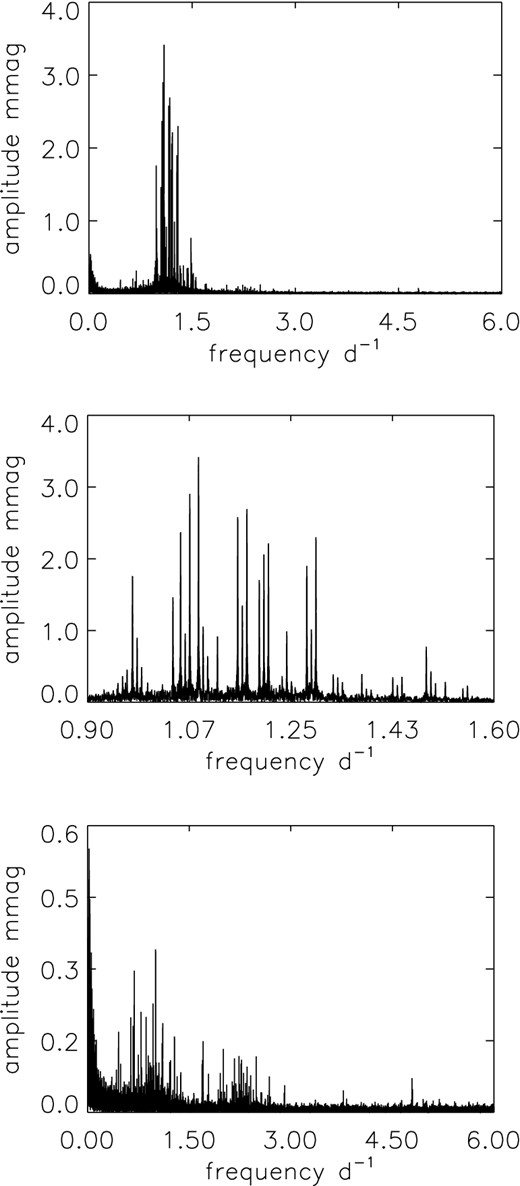
Top panel: an amplitude spectrum for the g-mode frequency range. Middle panel: the range of the higher amplitude g-mode peaks. Many triplets can be seen. From this range, we have obtained 14 triplets split nearly equally, and three other modes. Bottom panel: an amplitude spectrum of the residuals after pre-whitening by 45 frequencies. Note the change in the vertical scale from the top two panels. An additional five triplets are obtained in this range.
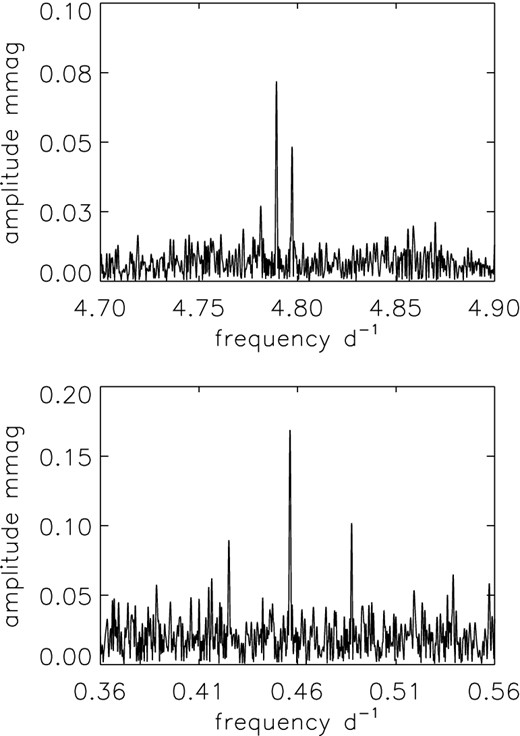
Top panel: an amplitude spectrum for the 4.8-d−1 triplet. Bottom panel: a low frequency triplet with a different splitting (see text for details).
Tables 1 and 2 give the results of a combination of linear least-squares and non-linear least-squares fits of g-mode frequencies to the Q1–17 data. Because of the decreasing signal-to-noise ratio for these further peaks, we chose for this first study of KIC 9244992 to analyse only the most significant multiplets. The first column in Tables 1 and 2 marks the g modes (g). The second column gives azimuthal order m, where we adopt the convention that m > 0 corresponds to a prograde mode. The next three columns give frequency, amplitude and phase (with respect to t0 = BJD2455694.25). The sixth column gives the frequency separations between the components of each multiplet, which correspond to the rotational splitting. The splittings show small asymmetries, i.e. ν(m = 0) − ν(m = −1) > ν(m = 1) − ν(m = 0) with few exceptions. The asymmetries are up to ∼1.6 × 10⁻⁴ d−1, and systematically larger for lower frequencies. They are larger than those expected from the second-order effect of the Coriolis force, and the sign is in the opposite sense. The cause is not clear.
A least-squares fit of the g-mode frequency multiplets for KIC 9244992. The phases are measured with respect to t0 = BJD2455694.25.
| m | Frequency | Amplitude | Phase | Δνrot | |
|---|---|---|---|---|---|
| (d−1) | (mmag) | (rad) | (d−1) | ||
| g | −1 | 0.952 1792 ± 0.000 0092 | 0.2077 ± 0.0050 | −1.2300 ± 0.0242 | |
| g | 0 | 0.960 1528 ± 0.000 0068 | 0.2818 ± 0.0050 | −2.5378 ± 0.0178 | 0.007 9736 ± 0.000 0114 |
| g | 1 | 0.967 9628 ± 0.000 0040 | 0.4851 ± 0.0050 | −1.5742 ± 0.0104 | 0.007 8100 ± 0.000 0079 |
| g | −1 | 0.977 2590 ± 0.000 0010 | 1.8347 ± 0.0050 | −1.0530 ± 0.0027 | |
| g | 0 | 0.985 2006 ± 0.000 0021 | 0.9153 ± 0.0050 | −2.1938 ± 0.0055 | 0.007 9415 ± 0.000 0023 |
| g | 1 | 0.993 0256 ± 0.000 0038 | 0.5043 ± 0.0050 | −0.3547 ± 0.0100 | 0.007 8250 ± 0.000 0043 |
| g | −1 | 1.003 4941 ± 0.000 0055 | 0.3464 ± 0.0050 | 2.6150 ± 0.0145 | |
| g | 0 | 1.011 4562 ± 0.000 0184 | 0.1041 ± 0.0050 | 1.2851 ± 0.0482 | 0.007 9621 ± 0.000 0192 |
| g | 1 | 1.019 2389 ± 0.000 0238 | 0.0804 ± 0.0050 | −2.2112 ± 0.0626 | 0.007 7827 ± 0.000 0301 |
| g | 1 | 1.046 8674 ± 0.000 0013 | 1.4910 ± 0.0050 | −0.9497 ± 0.0034 | |
| g | −1 | 1.060 1156 ± 0.000 0008 | 2.2770 ± 0.0050 | −1.7949 ± 0.0022 | |
| g | 0 | 1.068 0731 ± 0.000 0018 | 1.0493 ± 0.0050 | 3.0187 ± 0.0048 | 0.007 9574 ± 0.000 0020 |
| g | 1 | 1.075 9049 ± 0.000 0007 | 2.9357 ± 0.0050 | 2.8047 ± 0.0017 | 0.007 8318 ± 0.000 0019 |
| g | −1 | 1.090 9822 ± 0.000 0006 | 3.3646 ± 0.0050 | −0.9789 ± 0.0015 | |
| g | 0 | 1.098 8823 ± 0.000 0019 | 1.0078 ± 0.0050 | 1.0537 ± 0.0050 | 0.007 9002 ± 0.000 0020 |
| g | 1 | 1.106 7159 ± 0.000 0036 | 0.5305 ± 0.0050 | 2.7944 ± 0.0095 | 0.007 8336 ± 0.000 0041 |
| g | −1 | 1.123 6835 ± 0.000 0022 | 0.8880 ± 0.0050 | 2.9444 ± 0.0057 | |
| g | 0 | 1.131 5169 ± 0.000 0085 | 0.2272 ± 0.0050 | 2.7564 ± 0.0221 | 0.007 8335 ± 0.000 0087 |
| g | 1 | 1.139 5122 ± 0.000 0159 | 0.1210 ± 0.0050 | −0.5877 ± 0.0415 | 0.007 9953 ± 0.000 0180 |
| g | −1 | 1.158 5090 ± 0.000 0008 | 2.5414 ± 0.0050 | −1.8592 ± 0.0020 | |
| g | 0 | 1.166 4494 ± 0.000 0014 | 1.4080 ± 0.0050 | 1.7753 ± 0.0036 | 0.007 9404 ± 0.000 0016 |
| g | 1 | 1.174 3180 ± 0.000 0007 | 2.5701 ± 0.0050 | 1.3201 ± 0.0020 | 0.007 8686 ± 0.000 0016 |
| g | −1 | 1.195 6369 ± 0.000 0011 | 1.7338 ± 0.0050 | −2.3646 ± 0.0029 | |
| g | 0 | 1.203 5735 ± 0.000 0009 | 2.1082 ± 0.0050 | −2.5097 ± 0.0024 | 0.007 9366 ± 0.000 0014 |
| g | 1 | 1.211 4598 ± 0.000 0008 | 2.3752 ± 0.0050 | −2.3719 ± 0.0021 | 0.007 8862 ± 0.000 0012 |
| g | −1 | 1.235 0651 ± 0.000 0067 | 0.2839 ± 0.0050 | 2.5450 ± 0.0177 | |
| g | 0 | 1.243 0074 ± 0.000 0019 | 0.9890 ± 0.0050 | 0.9916 ± 0.0051 | 0.007 9422 ± 0.000 0070 |
| g | 1 | 1.250 8969 ± 0.000 0050 | 0.3869 ± 0.0050 | 1.2346 ± 0.0130 | 0.007 8895 ± 0.000 0053 |
| g | −1 | 1.277 5199 ± 0.000 0010 | 1.9817 ± 0.0050 | −2.0164 ± 0.0025 | |
| g | 0 | 1.285 4168 ± 0.000 0018 | 1.0532 ± 0.0050 | −0.6484 ± 0.0048 | 0.007 8968 ± 0.000 0021 |
| g | 1 | 1.293 3148 ± 0.000 0008 | 2.2686 ± 0.0050 | −2.0449 ± 0.0022 | 0.007 8980 ± 0.000 0020 |
| g | −1 | 1.323 0653 ± 0.000 0049 | 0.3905 ± 0.0050 | −2.7623 ± 0.0129 | |
| g | 0 | 1.330 9425 ± 0.000 0074 | 0.2582 ± 0.0050 | 0.4848 ± 0.0194 | 0.007 8771 ± 0.000 0089 |
| g | 1 | 1.338 8459 ± 0.000 0055 | 0.3496 ± 0.0050 | 0.1045 ± 0.0143 | 0.007 9034 ± 0.000 0092 |
| g | −1 | 1.372 3898 ± 0.000 0055 | 0.3472 ± 0.0050 | −1.0984 ± 0.0145 | |
| g | 0 | 1.380 3260 ± 0.000 0106 | 0.1812 ± 0.0050 | 0.0662 ± 0.0277 | 0.007 9362 ± 0.000 0119 |
| g | 1 | 1.388 1872 ± 0.000 0087 | 0.2197 ± 0.0050 | 2.7474 ± 0.0228 | 0.007 8612 ± 0.000 0137 |
| g | −1 | 1.425 6857 ± 0.000 0053 | 0.3595 ± 0.0050 | −0.0756 ± 0.0140 | |
| g | 0 | 1.433 6601 ± 0.000 0094 | 0.2035 ± 0.0050 | 2.1476 ± 0.0246 | 0.007 9744 ± 0.000 0108 |
| g | 1 | 1.441 5400 ± 0.000 0056 | 0.3416 ± 0.0050 | 1.7827 ± 0.0147 | 0.007 8799 ± 0.000 0109 |
| g | −1 | 1.483 4010 ± 0.000 0025 | 0.7541 ± 0.0050 | −1.7034 ± 0.0067 | |
| g | 0 | 1.491 3387 ± 0.000 0041 | 0.4706 ± 0.0050 | −1.2904 ± 0.0107 | 0.007 9377 ± 0.000 0048 |
| g | 1 | 1.499 2400 ± 0.000 0083 | 0.2315 ± 0.0050 | 2.3651 ± 0.0217 | 0.007 9012 ± 0.000 0092 |
| g | −1 | 1.546 3993 ± 0.000 0133 | 0.1435 ± 0.0050 | −0.8828 ± 0.0350 | |
| g | 0 | 1.554 3411 ± 0.000 0081 | 0.2358 ± 0.0050 | −2.5694 ± 0.0213 | 0.007 9417 ± 0.000 0156 |
| g | 1 | 1.562 3302 ± 0.000 0310 | 0.0618 ± 0.0050 | −2.6040 ± 0.0813 | 0.007 9891 ± 0.000 0320 |
| g | −1 | 1.688 7614 ± 0.000 0184 | 0.1032 ± 0.0050 | 2.6632 ± 0.0486 | |
| g | 0 | 1.696 7366 ± 0.000 0166 | 0.1152 ± 0.0050 | −1.9493 ± 0.0435 | 0.007 9752 ± 0.000 0248 |
| g | 1 | 1.704 6912 ± 0.000 0124 | 0.1545 ± 0.0050 | −1.7011 ± 0.0325 | 0.007 9546 ± 0.000 0207 |
| g | −1 | 1.769 2910 ± 0.000 0481 | 0.0397 ± 0.0050 | 2.9018 ± 0.1264 | |
| g | 0 | 1.777 1923 ± 0.000 0658 | 0.0291 ± 0.0050 | 2.8920 ± 0.1725 | 0.007 9013 ± 0.000 0815 |
| g | 1 | 1.785 0883 ± 0.000 0231 | 0.0825 ± 0.0050 | −1.1420 ± 0.0608 | 0.007 8961 ± 0.000 0697 |
Additional g-mode frequencies of KIC 9244992.
| m | Frequency | Amplitude | Phase | Δνrot | |
|---|---|---|---|---|---|
| (d−1) | (mmag) | (rad) | (d−1) | ||
| g | ? | 0.425 1423 ± 0.000 0208 | 0.0913 ± 0.0050 | −2.7407 ± 0.0548 | |
| g | ? | 0.456 1535 ± 0.000 0111 | 0.1712 ± 0.0050 | 2.2152 ± 0.0292 | 0.0310 112 ± 0.000 0236 |
| g | ? | 0.487 4012 ± 0.000 0184 | 0.1032 ± 0.0050 | 1.1203 ± 0.0485 | 0.031 2477 ± 0.000 0215 |
| g | ? | 1.147 2959 ± 0.000 0125 | 0.1527 ± 0.0050 | 1.9426 ± 0.0329 | 0.007 7837 ± 0.000 0202 |
| g | ? | 1.516 1600 ± 0.000 0087 | 0.2194 ± 0.0050 | −0.0377 ± 0.0228 | |
| g | −1 | 4.781 3912 ± 0.000 0689 | 0.0277 ± 0.0050 | 1.2119 ± 0.1811 | |
| g | 0 | 4.789 2914 ± 0.000 0265 | 0.0719 ± 0.0050 | 2.0760 ± 0.0697 | 0.007 9003 ± 0.000 0738 |
| g | 1 | 4.797 2105 ± 0.000 0404 | 0.0471 ± 0.0050 | −2.2399 ± 0.1063 | 0.007 9190 ± 0.000 0483 |
The periods corresponding to all frequencies (except for the triplets at 2.09 and 0.456 d−1) obtained in the g-mode range (Tables 1 and 2) are plotted against the period modulus of 2280 s (0.0264 d) in Fig. 4 (see also Bedding et al. 2014). This échelle diagram confirms that the g-mode triplets (i.e. l = 1 modes) are spaced nearly equally in period, with some modulation. Except for a few modes, we have detected most of the consecutive radial orders of g modes between 0.95 and 1.78 d−1. Two outliers at periods of 0.66 d (frequency 1.516 d−1) and 0.87 d (frequency 1.147 d−1) in Fig. 4 might belong to quadrupole (l = 2) modes, but their mode identification is not certain.
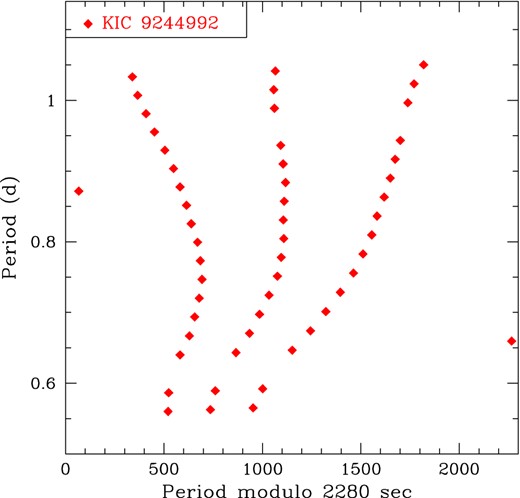
The échelle diagram for all the g modes (except the longest period triplet) detected in KIC 9244992. Most of the frequencies in the g-mode range are dipole modes that form triplets; the periods of each component of the multiplets, i.e. m = −1, 0, or +1, are nearly equally spaced.
2.2 The p modes
The top panel of Fig. 5 shows the amplitude spectrum in the frequency range of the highest amplitude p-mode peaks. There are two dominant peaks, at 12.339 d−1(=ν1) and at 12.920 d−1 (=ν2). These two peaks are pre-whitened in the amplitude spectrum in the bottom of Fig. 5, where many peaks in the p-mode range can now be seen. Frequencies, amplitudes, and phases of the most significant peaks are listed in Tables 3 and 4.
Top panel: The amplitude spectrum for the p-mode range of 11–17 d−1 where most of the p-modes peaks are. The two high amplitude peaks, named ν1 and ν2 in the order of amplitude, are obvious. Bottom: The full frequency range after pre-whitening by ν1 and ν2 where a plethora of peaks can be seen.
This Table shows the singlet and triplet frequencies in the p-mode range of KIC 9244992.
| Frequency | Amplitude | Phase | Δνrot | |||
|---|---|---|---|---|---|---|
| m | (d−1) | (mmag) | (rad) | (d−1) | ||
| ν1 | s | 0 | 12.339 3680 ± 0.000 0003 | 7.3701 ± 0.0050 | 2.0083 ± 0.0007 | |
| −1 | 12.892 5272 ± 0.000 0060 | 0.3156 ± 0.0050 | −0.8012 ± 0.0158 | |||
| ν2 | t | 0 | 12.906 3656 ± 0.000 0070 | 0.2704 ± 0.0050 | 1.8549 ± 0.0185 | 0.013 8383 ± 0.000 0093 |
| 1 | 12.920 0576 ± 0.000 0004 | 5.2472 ± 0.0050 | 1.6134 ± 0.0010 | 0.013 6920 ± 0.000 0070 | ||
| −1 | 13.980 1610 ± 0.000 0206 | 0.0924 ± 0.0050 | 2.4194 ± 0.0541 | |||
| ν7 | t | 0 | 13.995 9239 ± 0.000 0695 | 0.0274 ± 0.0050 | 0.6543 ± 0.1827 | 0.015 7629 ± 0.000 0725 |
| 1 | 14.011 0463 ± 0.000 0145 | 0.1310 ± 0.0050 | −3.0844 ± 0.0381 | 0.015 1225 ± 0.000 0710 | ||
| −1 | 14.043 7670 ± 0.000 0561 | 0.0340 ± 0.0050 | 0.9505 ± 0.1475 | |||
| ν8 | t | 0 | 14.061 7857 ± 0.000 0530 | 0.0360 ± 0.0050 | 40.4102 ± 0.1394 | 0.018 0187 ± 0.000 0771 |
| 1 | 14.078 5403 ± 0.000 0179 | 0.1058 ± 0.0050 | 2.3197 ± 0.0472 | 0.016 7546 ± 0.000 0559 | ||
| −1 | 14.791 6430 ± 0.000 0826 | 0.0230 ± 0.0050 | −1.1759 ± 0.2173 | |||
| ν9 | t | 0 | 14.806 0543 ± 0.000 0651 | 0.0293 ± 0.0050 | −1.0657 ± 0.1712 | 0.014 4114 ± 0.000 1052 |
| 1 | 14.820 4663 ± 0.000 0223 | 0.0850 ± 0.0050 | 2.0742 ± 0.0587 | 0.014 4120 ± 0.000 0688 | ||
| −1 | 15.590 0915 ± 0.000 1015 | 0.0188 ± 0.0050 | 1.4045 ± 0.2673 | |||
| ν11 | t | 0 | 15.604 8261 ± 0.000 0470 | 0.0403 ± 0.0050 | −2.6684 ± 0.1238 | 0.014 7346 ± 0.000 1119 |
| 1 | 15.619 3748 ± 0.000 1209 | 0.0157 ± 0.0050 | −1.5799 ± 0.3185 | 0.014 5487 ± 0.000 1298 | ||
| −1 | 16.389 9664 ± 0.000 0219 | 0.0868 ± 0.0050 | −2.4682 ± 0.0575 | |||
| ν6 | t | 0 | 16.404 9834 ± 0.000 0084 | 0.2266 ± 0.0050 | 0.9131 ± 0.0220 | 0.015 0169 ± 0.000 0234 |
| 1 | 16.420 0629 ± 0.000 0130 | 0.1458 ± 0.0050 | 0.4931 ± 0.0342 | 0.015 0795 ± 0.000 0155 | ||
| −3 | 18.383 1600 ± 0.000 1959 | 0.0096 ± 0.0050 | −2.2904 ± 0.5157 | |||
| −2 | 18.396 2411 ± 0.000 1181 | 0.0161 ± 0.0050 | −0.8998 ± 0.3107 | 0.013 0811 ± 0.000 2287 | ||
| −1 | 18.409 3327 ± 0.000 0842 | 0.0225 ± 0.0050 | 2.3136 ± 0.2214 | 0.013 0915 ± 0.000 1450 | ||
| ν10 | sep? | 0 | 18.422 5992 ± 0.000 0240 | 0.0793 ± 0.0050 | 0.3251 ± 0.0632 | 0.013 2665 ± 0.000 0876 |
| 1 | 18.436 6948 ± 0.000 0914 | 0.0207 ± 0.0050 | 1.5643 ± 0.2404 | 0.014 0956 ± 0.000 0945 | ||
| 2 | 18.452 1563 ± 0.000 1611 | 0.0117 ± 0.0050 | 2.5397 ± 0.4235 | 0.015 4615 ± 0.000 1852 |
Additional frequencies in the p-mode range of KIC 9244992 whose multiplicities are not clear.
| Frequency | Amplitude | Phase | |
|---|---|---|---|
| (d−1) | (mmag) | (rad) | |
| ν5 | 12.312 4621 ± 0.000 0034 | 0.5625 ± 0.0050 | −2.0569 ± 0.0089 |
| ν5 | 12.352 2912 ± 0.000 0053 | 0.3604 ± 0.0050 | −1.4217 ± 0.0139 |
| ν4 | 14.966 4768 ± 0.000 0048 | 0.3993 ± 0.0050 | −2.9340 ± 0.0126 |
| ν3 | 15.992 9674 ± 0.000 0043 | 0.5646 ± 0.0050 | −0.4456 ± 0.0089 |
The top panel of Fig. 6 shows the region around ν2 after it has been pre-whitened (dashed line). We identify the two highest peaks as the m = −1 (left) and m = 0 (right) components of the triplet formed with ν2 (m = 1). The bottom panel shows the region around ν1, which has been pre-whitened (dashed line). No obvious rotationally split components are found, suggesting ν1 to be a radial mode. There are peaks at 12.312 and 12.352 d−1, which might be members (m = −1 and +2) of a quintuplet with a central frequency of ≈12.325 d−1. Both frequencies are labelled as ν5 (Table 4). Fig. 7 shows another two triplets labelled ν6 and ν7. Looking at all these dipole triplets, the height of the central peak (m = 0) relative to the other peaks varies. Hence, the amplitude ratio cannot be used to infer the inclination of the pulsation axis.

Top: the range around ν2 = 12.920 d−1 after pre-whitening ν2 (dashed line). The two highest peaks are the m = −1 (left) and m = 0 (right) components of the triplet formed with ν2. Where ν2 has been pre-whitened (dashed line), there are four low amplitude peaks separated from ν2 by the Kepler orbital frequency, hence these are artefacts. Bottom: the range around ν1 = 12.339 d−1 after pre-whitening ν1 (dashed lines). There are no obvious rotationally split components, which supports the identification of ν1 as a radial mode. The relation of the two peaks at 12.312 and 12.352 d−1 is not clear.
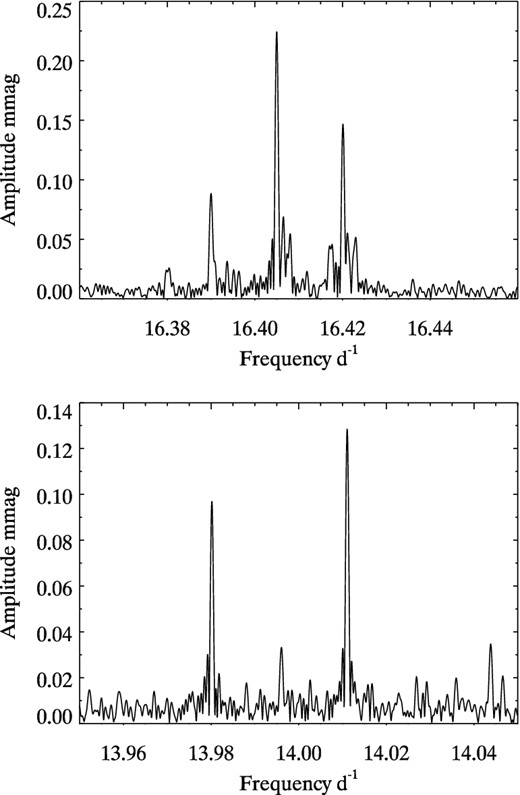
Amplitude spectra around two triplets at ν6 = 16.405 d−1 (top panel) and ν7 = 13.996 d−1 (bottom panel).
The top panel of Fig. 8 shows another triplet in the p-mode range. Since the splitting among the components is the same as those of g-mode triplets, the three frequencies of this triplet must be cross-terms caused by coupling between the p modes and g modes; similar phenomena are also found in KIC 11145123 (Kurtz et al. 2014). The presence of the cross-terms confirms that the g modes and the p modes originate in the same star. The bottom panel of Fig. 8 shows an isolated quintuplet (or possibly septuplet), showing that higher degree, l, modes are excited.
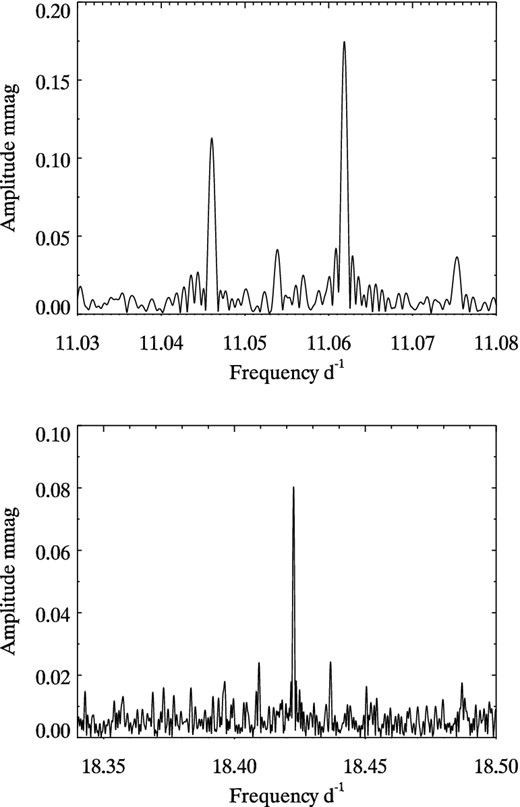
Top panel: an amplitude spectrum showing a triplet in the p-mode range split by the same amount as the g modes. This triplet has frequencies that are the difference between ν1 = 12.339 368 d−1 and the g-mode triplet given in Table 1 centred on ν = 1.285 4168 d−1. Therefore, these triplet frequencies are cross-terms showing that the p modes and g modes are coupled, just as in KIC 11145123 (Kurtz et al. 2014). Bottom panel: an isolated p-mode quintuplet (or septuplet).
Frequencies obtained in the p-mode range are listed in Tables 3 and 4. The highest amplitude singlet and well-resolved triplet frequencies are given in Table 3, while additional frequencies are given in Table 4. Rotational splittings, Δνrot, of p-mode triplets are about twice the mean splittings of g modes. This indicates that the internal rotation of KIC 9244992 is nearly uniform. We discuss this in more detail in Section 4.
3 MODEL
In this section, we discuss the mass and the evolutionary stage of KIC 9244992, by comparing observed pulsation frequencies with those obtained from evolutionary models with various parameters. The models were calculated in the same way as by Kurtz et al. (2014), using the Modules for Experiments in Stellar Evolution (mesa) code (Paxton et al. 2013). For KIC 9244992, two important facts can be used to constrain the model: the period spacing of the high-order g modes, and the frequency of a radial pulsation mode, ν1.
3.1 The period spacing of the g modes and the radial mode ν1
Table 5 lists the frequency, radial order n, and the period of the central mode (m = 0) of each detected g-mode triplet, where the radial order n is adopted from our best model (see below). The last column gives the period spacing from the adjacent (n − 1) mode, if available. The period spacings in slowly rotating stars are nearly constant, which is a well-known character of high-order g modes (Unno et al. 1989; Aerts, Christensen-Dalsgaard & Kurtz 2010). Note that in more rapidly rotating γ Dor stars, this is not the case (Bouabid et al. 2013; Bedding et al. 2014; Van Reeth et al. 2014).
The central g-mode frequencies for each triplet. The second column then gives the corresponding period, and the final column gives the period spacing to the previous mode.
| n | Frequency | Period (P) | Pn − 1 − Pn |
|---|---|---|---|
| (d−1) | (d) | (d) | |
| −38 | 0.960 153 | 1.041 501 ± 0.000 007 | |
| −37 | 0.985 201 | 1.015 022 ± 0.000 002 | 0.026 479 ± 0.000 008 |
| −36 | 1.011 456 | 0.988 673 ± 0.000 018 | 0.026 348 ± 0.000 018 |
| −34 | 1.068 073 | 0.936 265 ± 0.000 002 | |
| −33 | 1.098 882 | 0.910 016 ± 0.000 002 | 0.026 250 ± 0.000 002 |
| −32 | 1.131 517 | 0.883 769 ± 0.000 007 | 0.026 246 ± 0.000 007 |
| −31 | 1.166 449 | 0.857 302 ± 0.000 001 | 0.026 467 ± 0.000 007 |
| −30 | 1.203 573 | 0.830 859 ± 0.000 001 | 0.026 443 ± 0.000 001 |
| −29 | 1.243 007 | 0.804 500 ± 0.000 001 | 0.026 359 ± 0.000 001 |
| −28 | 1.285 417 | 0.777 958 ± 0.000 001 | 0.026 543 ± 0.000 002 |
| −27 | 1.330 942 | 0.751 347 ± 0.000 004 | 0.026 611 ± 0.000 004 |
| −26 | 1.380 326 | 0.724 467 ± 0.000 005 | 0.026 881 ± 0.000 007 |
| −25 | 1.433 660 | 0.697 515 ± 0.000 004 | 0.026 951 ± 0.000 007 |
| −24 | 1.491 339 | 0.670 538 ± 0.000 002 | 0.026 977 ± 0.000 005 |
| −23 | 1.554 341 | 0.643 359 ± 0.000 003 | 0.023 875 ± 0.000 006 |
| −21 | 1.696 737 | 0.589 367 ± 0.000 006 | |
| −20 | 1.777 192 | 0.562 685 ± 0.000 021 | 0.026 681 ± 0.000 022 |
| −7 | 4.789 291 | 0.208 799 ± 0.000 001 |
Period spacings, Pn−1 − Pn, of high-order g modes are useful to determine the evolutionary stage of the star. Fig. 9 shows the period spacings at selected stages, represented by the hydrogen fraction at the centre, Xc. The period versus period-spacing relation has a gentle modulation in early stages of main-sequence evolution, caused by the gradient of hydrogen abundance (μ-gradient) (Miglio et al. 2008). The modulation ‘wavelength’ and amplitude decrease as evolution proceeds (see the Appendix for discussions on the modulations). The mean separation, ΔPg, decreases monotonically with evolution (or with decreasing central hydrogen Xc). Because the relation between ΔPg and Xc is monotonic, ΔPg can be used to constrain the evolution stage; i.e. for a given set of initial parameters we can uniquely choose a model that reproduces the observed value of ΔPg. The mean period spacing ΔPg of KIC 9244992 is 0.0264 d (2280 s), which indicates that the hydrogen fraction at the centre of the star is already reduced to ∼0.1. We note that the previous star we studied, KIC 11145123, has ΔPg = 0.0241 d (2082 s) (Kurtz et al. 2014), corresponding to the TAMS contraction stage; i.e. the star is slightly more evolved than KIC 9244992.
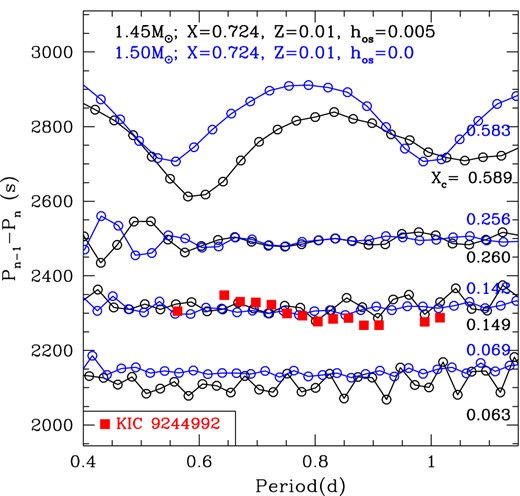
Period spacings of g modes (Pn−1 − Pn) as a function of g-mode period in selected evolutionary states marked by core hydrogen abundances. Observed spacings are compared with 1.45 and 1.50 M⊙ models (a small overshooting is included in the former model). The observed spacings are consistent with evolved models with the central hydrogen abundance reduced to as little as ∼0.1.
Fig. 10 shows evolutionary tracks for some initial masses and the estimated position of KIC 9244992 with an error box, in the spectroscopic HR (sHR) diagram (Langer & Kudritzki 2014), which we use because there are no reliable estimates of the distance of KIC 9244992. Filled circles connected by a dashed line in Fig. 10 show the positions where ΔPg ≈ 0.0264 d (2280 s).
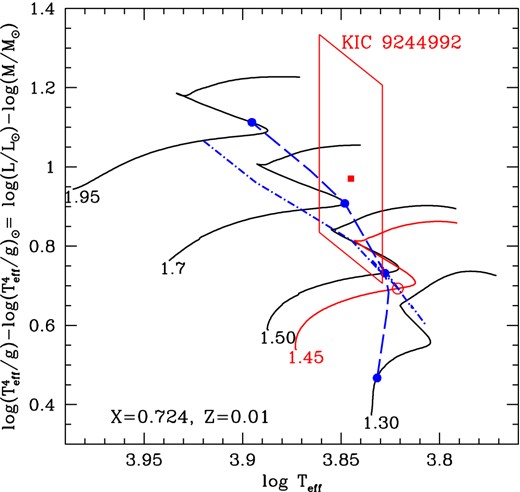
Evolutionary tracks for selected masses with the initial composition (X, Z) = (0.724, 0.01) are shown; black lines are without overshooting and the red line is with a small overshooting. The position of KIC 9244992 is also plotted. This is an sHR diagram introduced by Langer & Kudritzki (2014), where the vertical axis is log (L/M), equivalent to 4log Teff − log g, evaluated in solar units. This is convenient when no reliable distance estimates are available. The filled circles (connected with a dashed line) on each evolutionary track indicate the evolutionary stage where the mean period spacing of high-order g modes is close to the observed value, 0.0264 d (2280 s). The dash–dotted line indicates the locus where the frequency of the radial fundamental mode is equal to the observed highest amplitude frequency ν1 of KIC 9244992. The open circle indicates the position of our best model for KIC 9244992.
An additional constraint is that one of the radial modes of the model should fit to the highest amplitude singlet frequency ν1. The dash–dotted line in Fig. 10 shows the locus on which the frequency of the fundamental mode is equal to ν1. The model at the crossing point between the dash–dotted and dashed lines satisfies the constraints on both ΔPg and ν1. This is the best model for a given set of chemical composition (X, Z) and the overshooting parameter hov. Fig. 10 indicates that for the parameter set (X, Z, hov) = (0.724, 0.01, 0.0), the filled circle on the 1.5-M⊙ evolutionary track is the best model. However, there may be better models with other parameters, which could be evaluated by comparing with other p modes.
We note that if ν1 were fitted with the first overtone, the corresponding dash–dotted line would shift rightwards. There would then be no crossing point with the dashed line; this negates the possibility of assigning the first overtone to ν1.
3.2 Searching for a best model
Identifying p modes in δ Sct stars is notoriously difficult because of complex frequency distributions. The difficulty is considerably reduced for δ Sct/γ Dor hybrids such as KIC 9244992 and KIC 11145123 by the presence of regularly spaced high-order g modes, which constrain the evolution stage of the star as discussed in the previous section. In this subsection, we search for a better model of KIC 9244992 by taking advantage of the hybrid character.
We searched for a best set of parameters (X, Z, hov) that reproduces all the observed p modes. We examined models with parameters combining the three sets Y = (0.266, 0.30), Z = (0.014, 0.010, 0.007), and 0.0 ≤ hov ≤ 0.01, where X = 1 − Y − Z. The overshooting parameter hov determines the scalelength (hovHp with Hp being the pressure scalelength) for an exponential decay of mixing efficiency (Herwig 2000) above the convective core boundary.
Fig. 11 shows variances of models for various parameter sets versus effective temperatures. Generally, the effective temperature of the models is higher for lower Z. The models with a standard solar metallicity of Z = 0.014 have variances larger than the other cases, and they are too cool compared with the estimated effective temperature of KIC 9244992. This indicates KIC 9244992 to be metal-poor compared to the Sun, which is consistent with the KIC data [Fe/H] = −0.15 ± 0.3.
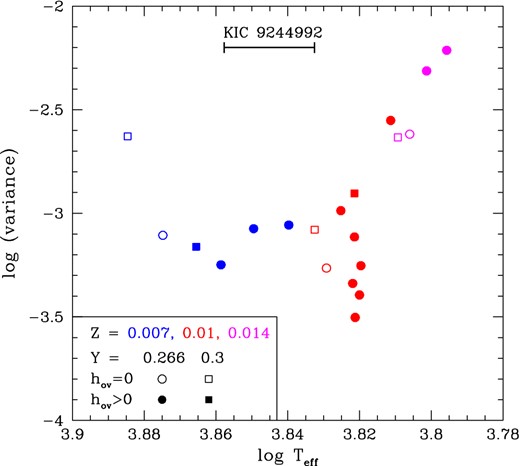
The variances between the observed frequencies and models (which approximately reproduce ν1 and ΔPg) with various parameter sets, (Y, Z, hov) are plotted with respect to the effective temperatures of the models. The metallicity, Z, is colour coded, two values of Y are distinguished by a circle and a square, and open symbols are for models without core overshooting. The estimated Teff range of KIC 9244992 is shown by a horizontal line.
The variance is minimum for a model at log Teff = 3.82 with a parameter set of (M, Y, Z, hov) = (1.45 M⊙, 0.266, 0.010, 0.005); detailed parameters are listed in Table 6. The model is slightly metal-poor and evolved to near the end of the main-sequence stage (Xc = 0.145). Small core-overshooting operates in the model with hov = 0.005 (which corresponds to an effective mixing range of about 0.05Hp; i.e. αov ≈ 0.05, as discussed below). The effective temperature of the model, log Teff = 3.821, is slightly lower than the estimated range of KIC 9244992 (log Teff = 3.845 ± 0.012). In general, models having log Teff ≈ 3.82 tend to agree with observed frequencies better than the models in other temperature ranges (Fig. 11). The position of the best model in the sHR diagram is shown by the red open circle in Fig. 10. Compared to the position derived from the spectroscopic analysis by Nemec et al. (in preparation), our best model is lower in log L/M (vertical axis) and slightly cooler.
Best model for KIC 9244992.
| M/M⊙ | log Teff | log L/L⊙ | log R/R⊙ | log g | Age (yr) |
|---|---|---|---|---|---|
| 1.45 | 3.821 | 0.854 | 0.308 | 3.982 | 1.9 × 10⁹ |
| |$X_{\rm c}^*$| | X | Y | Z | hov | |
| 0.145 | 0.724 | 0.266 | 0.010 | 0.005 |
| M/M⊙ | log Teff | log L/L⊙ | log R/R⊙ | log g | Age (yr) |
|---|---|---|---|---|---|
| 1.45 | 3.821 | 0.854 | 0.308 | 3.982 | 1.9 × 10⁹ |
| |$X_{\rm c}^*$| | X | Y | Z | hov | |
| 0.145 | 0.724 | 0.266 | 0.010 | 0.005 |
Note. *Xc = central hydrogen abundance.
The propagation diagram of our best model in Fig. 12 indicates that all non-radial modes obtained in the p-mode range are influenced by both p-mode and g-mode cavities (i.e. mixed modes), while all g-mode triplets are pure g modes.
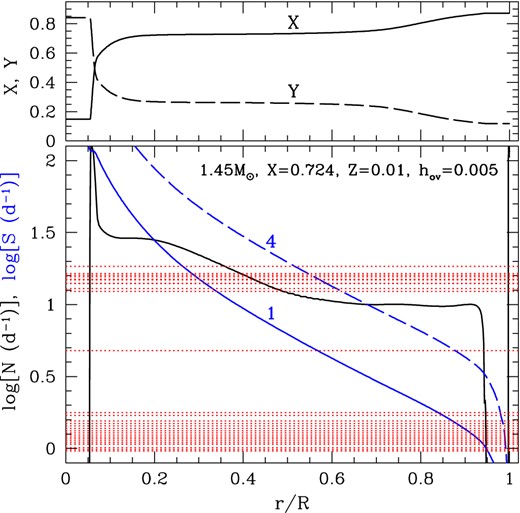
Upper panel: distributions of hydrogen (X) and helium (Y) abundances as a function of the fractional radius, r/R, in our best model. Helium is somewhat depleted in outer layers because of atomic diffusion. Lower panel: radial dependence of the Brunt–Väisälä frquency, N (black line), and the Lamb frequency, |$S = \sqrt{l(l+1)}c_{\rm s}/r$| (blue lines), where cs is the sound speed. The number along each blue line indicates the corresponding value of l. Observed frequencies (central frequencies for multiplets) are shown by red dotted lines.
Fig. 13 compares observed p-mode frequencies of KIC 9244992 with the best model and two other models. The model shown in the top row in the upper panel of Fig. 13 is our best model, whose parameters are given in Table 6. The best model reproduces all the detected mode frequencies to better than 1 per cent, although we have to fit the observed smallest amplitude frequencies of ν7, …, ν11 with pulsation modes of high latitudinal degrees, 4 ≤ l ≤ 6. (The same requirement occurs in all the models examined.)
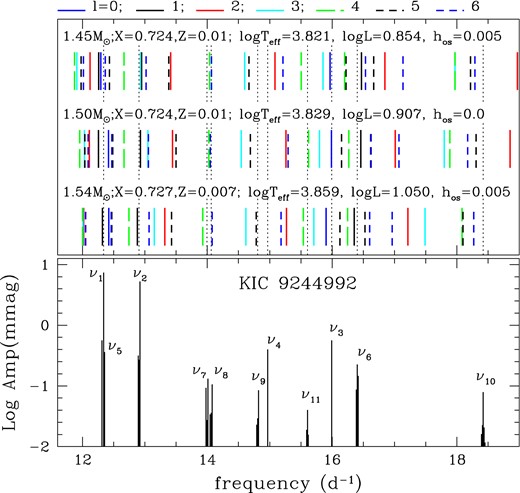
Observed frequencies in the p-mode range (lower panel) are compared with theoretical ones from the best model (top row in the upper panel) and two other models. Modes of large latitudinal degree, l ≥ 4, are needed for the lowest amplitude frequencies of ν7, …, ν11, in all the models examined.
Based on our best model, each observed frequency is identified as given in Table 7, where the radial order n is based on the scheme of Takata (2006) (negative and positive n-order g modes and p modes, respectively). While ν7 and ν11 are detected as triplets, we have to fit these with l = 4 modes because of the absence of smaller l modes around ν7 and ν11. The condition is the same for the other three models shown in Fig. 13.
Mode identification of the observed modes based on our best model. The observed frequencies, νobs, in the second column are those of the central (m = 0) component in each multiplet (given in Tables 1, 2, and 3), whereas the rotational splittings, Δνrot, in the third column are calculated by Δνrot = [ν(m) − ν( − m)]/(2m) with m = 2 for ν10 and m = 1 for the other modes.
| νobs | Δνrot | νmod | l | n | Cn, l | 〈Prot〉 | |
|---|---|---|---|---|---|---|---|
| (d−1) | (10−2d−1) | (d−1) | (d) | ||||
| g | 0.960 | 0.789 ± 0.012 | 0.960 | 1 | −38 | 0.497 | 63.8 ± 1.0 |
| g | 0.985 | 0.788 ± 0.012 | 0.986 | 1 | −37 | 0.497 | 64.1 ± 1.0 |
| g | 1.011 | 0.787 ± 0.012 | 1.012 | 1 | −36 | 0.496 | 64.0 ± 1.0 |
| g | 1.068 | 0.789 ± 0.012 | 1.070 | 1 | −34 | 0.496 | 63.9 ± 1.0 |
| g | 1.099 | 0.787 ± 0.012 | 1.102 | 1 | −33 | 0.496 | 64.0 ± 1.0 |
| g | 1.132 | 0.791 ± 0.012 | 1.136 | 1 | −32 | 0.496 | 63.7 ± 1.0 |
| g | 1.166 | 0.790 ± 0.012 | 1.171 | 1 | −31 | 0.495 | 63.9 ± 1.0 |
| g | 1.204 | 0.791 ± 0.012 | 1.209 | 1 | −30 | 0.495 | 63.8 ± 1.0 |
| g | 1.243 | 0.792 ± 0.012 | 1.249 | 1 | −29 | 0.495 | 63.8 ± 1.0 |
| g | 1.285 | 0.790 ± 0.012 | 1.292 | 1 | −28 | 0.495 | 63.9 ± 1.0 |
| g | 1.331 | 0.789 ± 0.012 | 1.338 | 1 | −27 | 0.495 | 64.0 ± 1.0 |
| g | 1.380 | 0.790 ± 0.012 | 1.388 | 1 | −26 | 0.494 | 64.1 ± 1.0 |
| g | 1.434 | 0.793 ± 0.012 | 1.441 | 1 | −25 | 0.494 | 63.8 ± 1.0 |
| g | 1.491 | 0.792 ± 0.012 | 1.499 | 1 | −24 | 0.494 | 63.9 ± 1.0 |
| g | 1.554 | 0.797 ± 0.012 | 1.562 | 1 | −23 | 0.494 | 63.5 ± 1.0 |
| g | 1.697 | 0.796 ± 0.012 | 1.705 | 1 | −21 | 0.493 | 63.7 ± 1.0 |
| g | 1.777 | 0.790 ± 0.012 | 1.786 | 1 | −20 | 0.493 | 64.2 ± 1.0 |
| g | 4.789 | 0.791 ± 0.013 | 4.812 | 1 | −7 | 0.496 | 63.7 ± 1.0 |
| ν1 | 12.339 | 12.299 | 0 | 1 | – | ||
| ν5 | 12.33? | 12.254 | 1 | −2 | 0.229 | ||
| ν2 | 12.906 | 1.377 ± 0.012 | 12.942 | 1 | −1 | 0.287 | 51.8 ± 0.5 |
| 12.916 | 3 | −5 | 0.0390 | 69.8 ± 0.6 | |||
| ν7 | 13.996 | 1.544 ± 0.012 | 14.052 | 4 | −6 | 0.0266 | 63.0 ± 0.5 |
| ν8 | 14.062 | 1.739 ± 0.012 | 14.062 | 6 | −9 | 0.0112 | 56.9 ± 0.4 |
| ν9 | 14.806 | 1.441 ± 0.013 | 14.589 | 3 | −4 | 0.0718 | 64.4 ± 0.6 |
| 14.680 | 5 | −7 | 0.0150 | 68.3 ± 0.6 | |||
| ν4 | 14.966 | 15.102 | 2 | −2 | 0.158 | ||
| ν11 | 15.605 | 1.464 ± 0.014 | 15.500 | 4 | −5 | 0.0511 | 64.8 ± 0.6 |
| ν3 | 15.993 | 15.973 | 0 | 2 | – | ||
| ν6 | 16.405 | 1.504 ± 0.012 | 16.477 | 1 | 1 | 0.006 53 | 66.0 ± 0.5 |
| ν10 | 18.423 | 1.398 ± 0.008 | 18.218 | 5 | −4 | 0.0141 | 70.5 ± 0.4 |
| 18.309 | 6 | −5 | 0.006 95 | 71.0 ± 0.4 |
To fit lowest amplitude frequencies of ν7 to ν11, we have to employ modes with high angular degrees 4 ≤ l ≤ 6. A high l mode is expected to have low visibility because of cancellation on the stellar surface. According to Daszyńska-Daszkiewicz et al. (2002), for a given maximum amplitude on the surface, the visibility of l = 4 and 6 modes are about 2 and 0.5 per cent of a radial mode, respectively. On the other hand, amplitudes of ν7 and ν11 are 1.8 and 0.5 per cent of ν1, comparable to the theoretical estimates for 4 ≤ l ≤ 6. This justifies identifying ν7, …, ν11 as modes of l = 4 to 6.
Two modes are assigned to the triplet ν2: (l, n) = (1, −1) and (3, −5), both modes have very similar frequencies to each other (Table 7). The triplet ν2 has a peculiar character: the amplitude of the main component, which corresponds to the prograde mode (m = 1), is larger by an order of magnitude than the amplitudes of the other two components (Table 3). This peculiar property could possibly indicate that the triplet ν2 is part of a superposition of the (l, n) = (1, −1) and (3, −5) modes.
Our best model has a small overshooting of hov = 0.005 from the convective core. The efficiency of mixing in the overshooting zone is assumed to decay exponentially as exp [−2z/(hovHp)] (Herwig 2000) with z being the distance from the boundary of the convective core. A simpler and more often adopted assumption is to mix fully a zone of thickness αovHp above the convective core boundary. To examine differences in the seismological properties among models adopting different treatments of overshooting, we calculated models with a set of parameters (M, X, Z) = (1.45 M⊙, 0.724, 0.01), the same as that of our best model, but with the simpler assumption for the overshoot mixing controlled by αov. We found that the evolutionary track calculated with αov = 0.052 is nearly identical to that shown in Fig. 10 (red line) for our best model with hov = 0.005. We found that a model having very close L and Teff to those of our best model also has very similar pulsation frequencies and hence a very similar period/period-spacing relation of g modes. Therefore, we conclude that our results do not depend on the mixing model of overshooting.
4 INTERNAL ROTATION
4.1 The mean rotation period of each mode
Fig. 14 shows rotational kernels in our best model for a g mode and three modes identified with the triplets in the p-mode range of KIC 9244992. The average of the mean rotation period, 〈Prot〉, obtained from the dipole g modes is 63.9 ± 0.2 d. This represents the rotation period of the core of KIC 9244992.
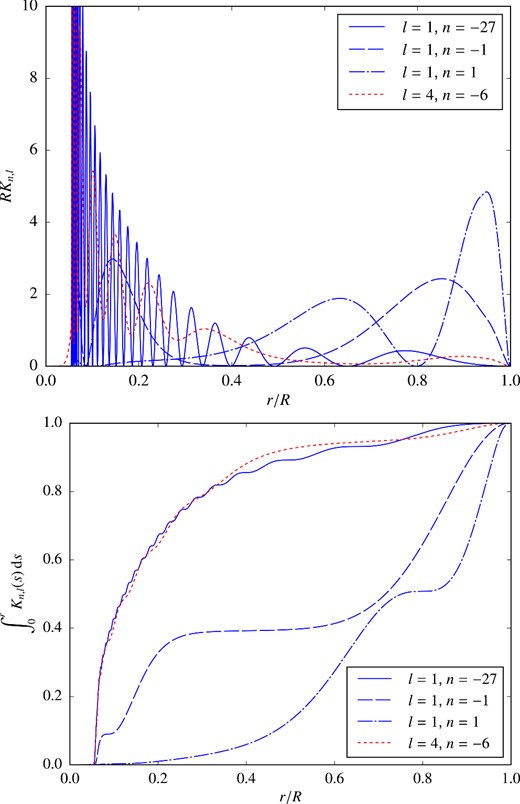
Rotation kernels of selected modes in our best model with 1.45 M⊙ as functions of fractional radius. The upper panel shows the kernels themselves, whereas the lower panel represents their cumulative profiles.
The frequency ν7 is identified as the (l, n) = (4, −6) mode. This is a mixed mode that has predominantly g mode character with no radial node in the p-mode range, although the frequency lies in the mixed-mode range (Fig. 12). The g-mode character of the l = 4 mode is apparent in the kernel, the cumulative one in particular, which is very similar to that of the dipole g mode shown in Fig. 14. The mean rotational period derived for ν7 is 63.0 ± 0.5 d (Table 7), which is consistent with the one obtained from the dipole g modes within 2σ.
On the other hand, the rotational splitting of the (l, n) = (1, 1) mode (assigned to ν6) represents almost exclusively the rotation rates of outer half (in radius). The mean rotational period obtained from ν6 is 66.0 ± 0.5 d, slightly longer than that from the dipole g modes. This indicates that the outer half rotates slightly more slowly than the inner half of the star (by less than 5 per cent).
The mean rotational splitting of ν2 is 0.0138 ± 0.0001 d−1, slightly smaller than the other triplets in the p-mode range. The frequency is identified with the (l, n) = (1, −1) mode, which is a mixed mode having both g-mode and p-mode characters. The mixed mode character is apparent in the cumulative kernel of the mode in Fig. 14; about 40 per cent of the rotational splitting comes from the layers of r/R ≲ 0.25 and 60 per cent from the layers of r/R ≳ 0.6. Because of the mixed mode character, the Ledoux constant, C−1,1 = 0.287 is much larger than those of typical p modes. Using this value and the mean rotational splitting of ν2, we obtain 51.8 ± 0.5 d for a mean rotation period represented by ν2, which is considerably shorter than the mean rotation periods obtained by the other modes. However, this estimate is rather uncertain for two reasons; (1) the frequency and Cn,l of a mixed mode are sensitive to the model structure, and (2) there is another mode (l, n) = (3, −5) whose frequency is very close to ν2, which gives a rotation period of 69.8 ± 0.6 d.
4.2 Two-zone modelling
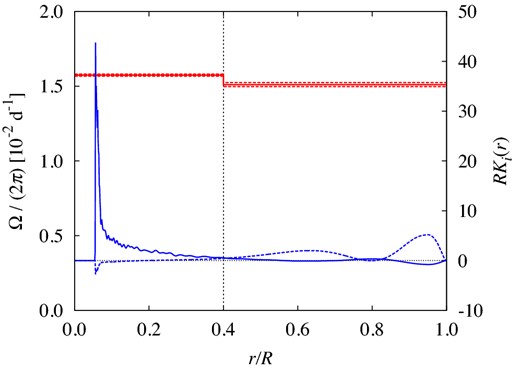
The profile of the cyclic rotation frequency, Ω/(2π), inferred by two-zone modelling (red lines) and the corresponding averaging kernels multiplied by the total radius, R (blue lines). The red dashed lines designate the (1σ) error level. The blue solid curve represents K1(r) for the core rotation, while the blue dashed curve means K2(r) for the envelope rotation. The boundary between the core and the envelope is set to the fractional radius of 0.4, which is indicated by the vertical dotted line.
To attempt better localizations of the averaging kernels, we applied the optimally localized averaging method (see e.g. Sekii 1997, for a succinct review in a helioseismic context) to the same mode set. Probably due to the lack of low-order g modes, however, we were unable to produce significantly better averaging kernels. We therefore prefer the two-zone modelling result for its simplicity.
5 DISCUSSION AND CONCLUSION
Our best model for KIC 9244992 is slightly metal-poor and has a mass of 1.45 M⊙. The star could be an SX Phe star as suggested by Balona & Nemec (2012). If we assume that [Fe/H] ≈log (Z/Z⊙) and adopt Z⊙ = 0.014, then Z = 0.010 corresponds to [Fe/H]=−0.15, which agrees with the value in the KIC, although this argument is not strong because of the uncertainty on the KIC value of ±0.3. However, the metal deficiency is not sufficient to identify the star as an SX Phe star; McNamara (2011) suggests [Fe/H] ≲ −1 for SX Phe stars. Hence, it might be appropriate to regard KIC 9244992 as a δ Sct/γ Dor star having a slightly metal-poor composition.
In order to examine the excitation/damping of pulsations in F stars, and to make predictions for the instability range of γ Dor stars in the HR diagram, the effect of the interaction between convection and pulsation must be taken into account. Dupret et al. (2005) performed such analyses and found that the excitation of g modes in models with mixing length twice the pressure scaleheight (α = 2) is consistent with the observed range of γ Dor variables (although that distribution is still controversial; Grigahcène et al. 2010; Uytterhoeven et al. 2011; Tkachenko et al. 2013). Our best model is slightly cooler than the theoretical red edge for α = 2, although the effective temperature spectroscopically estimated for KIC 9244992 is consistent with the theoretical instability range. The 1.6-M⊙ model of Dupret et al. (2005) predicts the excitation of dipole g modes with periods longer than about 0.7 d (the upper limit depends on Teff), while, in KIC 9244992, almost consecutive dipole g modes between periods of 0.56 and 1.04 d and a dipole mode at 0.2 d are excited, hence a few short-period dipole modes detected in KIC 9244992 are outside the predicted period range. The theoretical model also predicts the excitation of quadrupole (l = 2) g modes with periods longer than about 0.5 d. This is consistent with the identification of two outliers at periods of 0.66 and 0.87 d in Fig. 4 as quadrupole g modes (n = −42 and n ∼ −54 to − 57, respectively). We also note that there are still many low-amplitude peaks remaining in the g-mode range (bottom panel of Fig. 2), that could be l ≥ 2 g modes.
The rotational splittings of p modes indicate that the surface of KIC 9244992 rotates slowly, with a period of ≈66 d or longer. Combining the rotation period and the radius ≈2 R⊙ of our best model yields an equatorial rotation velocity of 1.5 km s−1. It will be challenging to measure such a small rotational velocity by spectroscopic analysis. The slow and nearly uniform rotation found for KIC 9244992 is similar to the main-sequence star KIC 11145123 (Kurtz et al. 2014), whose equatorial rotation velocity is also found to be ∼1 km s−1. Both stars are near the end of main-sequence stage.
In the wholly convective Hayashi phase, stars probably rotate rigidly because of large turbulent viscosity. After the Hayashi phase, if angular momentum is conserved locally in radiative layers, the central region rotates faster than the envelope, because of an increase in the central mass concentration. The difference would become about factor 3 at the ZAMS, and about factor 10 near the end of the main-sequence evolution (Kurtz et al. 2014). Clearly, a strong mechanism for angular momentum transport must be acting during the main-sequence stage to result in the nearly rigid rotation observed in KIC 9244992 and KIC 11145123. The results obtained for these two stars may indicate that low-mass stars, in general, may rotate slowly and nearly rigidly at the very end of the main-sequence evolution. This proposition must be confirmed (or negated) by asteroseismic analyses for many δ Sct/γ Dor hybrid stars in the future. If true, it has important implications not only for the angular momentum transport during main-sequence evolution, but also for the internal rotation of sub-giants and red giants, for which A-F stars are progenitors.
It was found recently in several sub-giants and red giants that the contrast of rotation rates between the core and the envelope is much weaker than theoretically expected (Deheuvels et al. 2012, 2014). Angular momentum must be redistributed much faster than the present models predict, during evolution before stars become red giants. Stimulated by the discovery, some theoretical attempts to explain this observational fact have been made. For example, Eggenberger, Montalbán & Miglio (2012) pointed out the necessity of an additional mechanism of angular momentum transport during main-sequence and post-main-sequence evolution in order to reproduce the weak contrast of rotation between the core and the envelope. Marques et al. (2013) modelled angular momentum transport by parametrizing turbulent diffusivity and computed a series of stellar evolutionary models. They found it hard to reproduce the observed property of weak contrast of rotation between the core and the envelope, and concluded that much more efficient mechanisms of angular momentum transport should be at work to explain rotation periods of red giant cores. A similar conclusion was reached by Cantiello et al. (2014) after detailed calculations taking account of rotationally induced instabilities and circulations, as well as magnetic fields. The role of internal gravity waves has also been reviewed by Mathis & Alvan (2013) and Fuller et al. (2014).
We have found in this paper that KIC 9244992, an F star near the TAMS, rotates slowly and nearly rigidly. The result is similar to that obtained by Kurtz et al. (2014) for KIC 11145123. If this property is general; i.e. if all A-F stars (1.3 ≲ M/M⊙ ≲ 2) rotate uniformly at the end of main sequence, angular momentum transport during the main-sequence evolution must be much more efficient than included in the present evolution models. In addition, evolutionary models to reproduce slow core rotation in giants also have to reproduce the uniform rotation at the TAMS. It is important to analyse many more δ Sct/γ Dor hybrid stars, as well as to search for efficient mechanism of angular momentum transport.
We thank NASA and the Kepler team for their revolutionary data. This work was initiated with support from a JSPS Japan–UK Joint Research grant. DWK thanks the JSPS for a Furusato Award that partially funded this work. We thank Bill Paxton and the MESA project team for developing the efficient stellar evolution code mesa. HS and MK were partially supported by JSPS KAKENHI Grant Number 26400219.
REFERENCES
APPENDIX A: PERIOD SPACINGS OF g MODES
In this appendix, we briefly discuss the effect of atomic diffusion, which we have included in our evolution calculations to obtain a smooth distribution of the Brunt–Väisälä frequency. Fig. A1 shows period spacings of g modes as a function of the period for selected models; black and green lines are for models with and without atomic diffusion, respectively. Fig. A2 shows the runs of hydrogen abundance (upper panel) and of the Brunt–Väisälä frequency for each model shown in Fig. A1. In the late stage of main-sequence evolution, the period spacing varies wildly as a function of the period if the atomic diffusion is not activated; this is in stark contrast to the cases with atomic diffusion. The difference is caused by a moderate difference in the gradient of the run of the Brunt–Väisälä frequency at the outer boundary of the μ-gradient zone (wiggles in N are not important); smoothing of the distribution by atomic diffusion results in a large reduction of the oscillations of the period spacings, which is consistent with the observed relations of KIC 9244992 and KIC 11145123. This indicates that in a real star some mechanism of smoothing the distribution of chemical abundance must be at work – atomic diffusion or turbulent diffusive mixing. In our two slowly rotating stars, atomic diffusion seems more appropriate.
Period versus period-spacing relations at selected evolutionary stages are compared between models with (black lines) and without (green lines) atomic diffusion. Also shown are the relations of KIC 9244992 and KIC 11145123. The number along each line indicate the central hydrogen abundance.
The runs of hydrogen abundance (upper panel) and Brunt–Väisälä frequency (lower panel) at the stage corresponding to each curve in Fig. A1.
