


Abstract
The cosmic history of the growth of supermassive black holes in galactic centres parallels that of star formation in the Universe. However, an important fraction of this growth occurs inconspicuously in obscured objects, where ultraviolet/optical/near-infrared emission is heavily obscured by dust. Since the X-ray flux is less attenuated, a high X-ray-to-optical flux ratio (fx/fo) is expected to be an efficient tool to find out these obscured accreting sources. We explore here via optical spectroscopy, X-ray spectroscopy and infrared photometry the most extreme cases of this population (those with fx/fo > 50, EXO50 sources hereafter), using a well-defined sample of seven X-ray sources extracted from the 2XMM catalogue. Five EXO50 sources (∼70 per cent of the sample) in the bright flux regime explored by our survey (f(2−10 keV) ≥ 1.5 × 10⁻¹³ erg cm−2 s−1) are associated with obscured AGN (NH > 1022 cm−2), spanning a redshift range between 0.75 and 1 and characterized by 2–10 keV intrinsic luminosities in the QSO regime (e.g. well in excess to 1044 erg s−1). We did not find compelling evidence of Compton thick active galacic nuclei (AGN). Overall, the EXO50 type 2 QSOs do not seem to be different from standard X-ray-selected type 2 QSOs in terms of nuclear absorption; a very high AGN/host galaxy ratio seems to play a major role in explaining their extreme properties. Interestingly, three out of five EXO50 type 2 QSO objects can be classified as extreme dust-obscured galaxies (EDOGs, f24 μm/fR ≥ 2000), suggesting that a very high AGN/host ratios (along with the large amount of dust absorption) could be the natural explanation also for a part of the EDOG population. The remaining two EXO50 sources are classified as BL Lac objects, having rather extreme properties, and which are good candidates for TeV emission.
1 INTRODUCTION
The study of high-z-obscured quasars (type 2 QSOs: the high luminosity counterpart of Seyfert 2 galaxies) is one of the hot topics of current extragalactic astronomy. Their observed distributions (e.g. redshift, flux and absorption) and physical properties (e.g. bolometric luminosity, black hole mass and accretion rate), compared to those of unobscured QSOs, are key parameters to understand and to test the orientation-based unified schemes (Antonucci 1993) for active galacic nuclei (AGN) and to constrain the contribution of QSOs to the X-ray background (e.g. Gilli, Comastri & Hasinger 2007; Treister, Urry & Virani 2009). Even more important, there are now increasing evidence that the formation and growth of galaxies and their nuclear supermassive black holes (SMBHs, MBH > 106 M⊙) are intimately related; feedback from actively accreting SMBH, AGN, must play a fundamental role in regulating both star formation and accretion throughout galaxy's history (e.g. Silk & Rees 1998; Granato et al. 2004; Di Matteo, Springel & Hernquist 2005; Croton et al. 2006; Hopkins et al. 2008; Menci et al. 2008; King 2010; Faucher-Giguère & Quataert 2012). Although the nature of this relationship is still poorly understood, there are hints that most of the SMBH accretion takes place during an obscured quasar phase. The infrared (IR), optical and X-ray spectral analysis of a large sample of obscured quasars probably represents one of the best methods to test a possible coevolution between massive galaxies and AGN activity (see e.g. Hopkins et al. 2006) and to investigate if and how the AGN feedback can affect the galaxy evolution (see e.g. Bower et al. 2006). Indeed, in these sources the properties of the host galaxy can be studied using the optical and near-IR (NIR) data, where the absorbed AGN is supposed to contribute marginally, while the AGN properties can be investigated using the X-ray and mid-IR (MIR) data where, conversely, the AGN emission is dominant (see Ballo et al. 2014 and references therein). Obscured QSOs, a rare class of objects, are thus expected to have large values of the X-ray-to-optical flux ratio. Furthermore, since the dust extinction increases in the ultraviolet (UV) while the X-ray absorption goes in the opposite direction, i.e. strongly decreasing going towards the high energies, a redshift dependence is also expected (∼(1 + z)3.6; Fiore et al. 2003). However, in spite of the outstanding progress, obtained by using medium and deep X-ray surveys (see e.g. Brusa et al. 2010 and references therein), the weakness, both in the X-ray and in the optical band, of the selected sources with high values of the X-ray-to-optical flux ratio usually prevents from a detailed analysis of the individual objects (see e.g. Koekemoer et al. 2004; Civano, Comastri & Brusa 2005).
To explore the most extreme examples of obscured QSOs in the bright flux regime, we have started a project focused on the very ‘high’ X-ray-to-optical flux ratio, fx/fo (see equation 1), population, namely those sources with fx/fo > 50 (more than 15 times the average values of unobscured broad-line AGN; e.g. Caccianiga et al. 2004; Della Ceca et al. 2004; Civano et al. 2012) and with fx > 10−13 erg cm−2 s−1. In this way, we should efficiently select the best candidates to be obscured QSOs; at the same time, the source brightness ensures that the optical spectroscopic identification can be achieved1 for sources with reasonably good quality X-ray data (>few hundred counts) to carry out a reliable X-ray spectral analysis. Hereafter, we will call these sources EXO50 – for ‘extreme X-ray-to-optical flux ratio’. One example of such extreme obscured objects is XBS J021642.3−043553 with fx/fo ∼ 200, for which the presence of a type 2 QSO at z ∼ 2 was spectroscopically confirmed with VLT/FORS (Severgnini et al. 2006). Using the redshift information and the spectral energy distribution (SED), we estimated a stellar mass of ∼1011 M⊙ for the host galaxy, which supports the strong link between high-redshift massive galaxies and powerful obscured high-redshift QSOs. In spite of the importance of obscured QSOs in the cosmological context, only less than a dozen of such extreme fx/fo sources have been found and studied so far with good X-ray and optical data (see e.g. Gandhi, Fabian & Crawford 2006; Severgnini et al. 2006; Campisi et al. 2009; Del Moro et al. 2009; Brusa et al. 2010, 2015; Perna et al. 2014).
Here we discuss the first results obtained from this project on a small, but statistically complete and representative, subsample of seven EXO50 objects with fx ≥ 1.5 × 10⁻¹³ erg cm−2 s−1. It is worth mentioning that other two interesting (and rare) classes of extragalactic sources are expected to show up in the high fx/fo domain explored here, namely BL Lac objects and high redshift (i.e. z > 0.6 in order to have the 4000 Å break shifted at longer wavelengths than the R-band filter) clusters of galaxies. Clusters of galaxies, however, are not expected to be represented in our sample since we have restricted our search only to the point-like X-ray sources, thus strongly minimizing their possible selection.
This paper is organized as follows: in Section 2, we discuss the strategy used to define a statistically representative sample of sources with fx/fo > 50. In Section 3, we present the data accumulated so far (in the radio, IR, optical and X-ray energy ranges) on the seven EXO50 objects discussed here, while their properties, source by source, are discussed in Section 4. In Section 5, we compare the broad-band, from IR to X-rays, properties of these EXO50 sources with other similar objects found in the literature. Summary and conclusions are presented in Section 6. Throughout this paper, we consider the cosmological model with (Ho, ΩM, Ωλ) = (70, 0.3, 0.7); results from other papers have been rescaled to this cosmological framework. All the optical/IR magnitudes reported here are in the Vega system. Unless differently quoted, X-ray luminosities are intrinsic (i.e. unabsorbed) luminosities in the rest-frame 2–10 keV energy range. In this paper, we use the term type 1 and type 2 AGN as broad or narrow line (FWHM, full width at half-maximum of the permitted emission lines <1500 km s−1) AGN, irrespective to their intrinsic X-ray luminosity, while we use the term type 1 QSO and type 2 QSO (or obscured QSO) as broad or narrow AGN with an intrinsic 2–10 keV luminosity in excess to 1044 erg s−1. Finally, errors are at 90 per cent confidence level for the X-ray spectral parameters derived using xspec (as usually done in X-ray astronomy) and 68 per cent for all the other quantities.
2 THE EXO50 SAMPLE
We define EXO50 the sources with fx/fo > 50; these are a rare class of X-ray emitting objects, as typically AGN have fx/fo = 1–10 (see e.g. Caccianiga et al. 2004; Della Ceca et al. 2004; Civano et al. 2012). For instance, in the XMM–Newton Bright Survey (XBS, Della Ceca et al. 2004; Caccianiga et al. 2008), a complete sample of bright (f(0.5−4.5 keV) ≳ 7 × 10⁻¹⁴ erg cm−2 s−1) X-ray-selected sources almost completely identified (spectroscopic identification level ∼98 per cent), EXO50 objects represent only ∼0.5 per cent of the source population.
To construct our sample of EXO50 sources in the bright flux regime, we used one of the largest well-defined and complete X-ray source sample derived so far (discussed in Mateos et al. 2008), based on the 2XMM source catalogue2 (Watson et al. 2009).
First we have considered the following selection criteria:
‘point-like’ X-ray sources (parameters EP_EXTENT and EP_EXTENT_ML in the source catalogue equal to 0), in order to minimize the presence of clusters of galaxies which is another possible class of high fx/fo sources;
north of −10 deg declination, in order to be accessible to optical investigation from the Italian Telescopio Nazionale Galileo (TNG), from the Large Binocular Telescope (LBT) and from the Spanish Gran Telescopio Canarias (GTC);
sources selected in the 2–10 keV energy band with a f2−10 keV > 10−13 erg cm−2 s−1;
only serendipitous sources (e.g. sources that are not related to nearby galaxies or to the XMM–Newton pointing) have been taken into consideration. We have also excluded the serendipitous sources already classified as non-AGN or non-BL Lacs.
Starting from a source list of 9431 sources (see Mateos et al. 2008), these first selection criteria provide us with a list of about 600 X-ray emitting objects.
The second step was to select the X-ray sources with fx/fo > 50, using
optical source archives [e.g. Automatic Plate Measuring (APM) catalogues, Sloan Digital Sky Survey – SDSS, etc.];
optical imaging data from archives (STScI Digitized Sky Survey, ESO archive, etc.);
imaging data from our dedicated observing programmes (e.g. TNG imaging).
We have looked at and visually inspected all the selected X-ray sources for possible optical counterparts, using a search radius of 4 arcsec (see Caccianiga et al. 2008), and derived their R magnitude. For all the sources reported and discussed here (see Table 1), the offset between the X-ray and the optical position, derived a posteriori, is below 2.1 arcsec, fully consistent with the results obtained by Caccianiga et al. (2008) from the analysis of the X-ray-to-optical offset for the X-ray sources belonging to the XBS. The accumulated magnitudes, combined with the observed 2–10 keV fluxes, have been used to compute the fx/fo ratio and thus to select EXO50 sources.
The complete sample of EXO50 objects discussed in this paper. Columns are as follows: (1) number used to mark the object in the plots shown in Section 5; (2) source name; (3) X-ray flux in the 2–10 keV energy band (MOS normalization) corrected for Galactic absorption in units of 10−13 erg cm−2 s−1; (4) R-band magnitude; (5) X-ray-to-optical flux ratio; (6) optical spectroscopic classification; (7) redshift; (8) intrinsic absorption and 90 per cent confidence interval in units of 1022 cm−2 from fits to X-ray spectra; (9) power-law photon index, Γ, in the X-ray energy range, and 90 per cent confidence interval; (10) intrinsic X-ray luminosity in the 2–10 keV rest frame energy range, in units of 1045 erg s−1; (11) radio flux at 1.4 GHz in mJy.
| No. | 2XMMName | fx | R | fx/fo | ID | z | N|$_{\rm H}^a$| | Γa | Lx | fr |
|---|---|---|---|---|---|---|---|---|---|---|
| 10−13 cgs | 1022 cm −2 | 1045 cgs | mJy | |||||||
| (1) | (2) | (3) | (4) | (5) | (6) | (7) | (8) | (9) | (10) | (11) |
| 1 | J022256.9−024258 | 3.50 | 22.1 ± 0.4 | 72 | AGN2 | 1.004 | 7.5|$^{+3.2}_{-2.9}$| | 1.80|$^{+0.4}_{-0.4}$| | 1.9 | 429 ± 14 |
| 2 | J100038.9+050955 | 1.63 | 23.6 ± 0.4 | 138 | – | – | >0.4b | 1.9c | – | – |
| 3 | J121026.5+392908 | 36.1 | 19.16d ± 0.02 | 50 | BLLac | 0.617 | 0.06|$^{+0.004}_{-0.002}$| | 2.23|$^{+0.01}_{-0.01}$| | 6.4 | 19.0 ± 0.7 |
| 4 | J121134.2+390054e | 8.2 | 20.77d ± 0.05 | 50 | BLLac | 0.890 | 0.19|$^{+0.04}_{-0.04}$| | 2.21|$^{+0.07}_{-0.06}$| | 3.7 | 10.6 ± 0.6 |
| 5 | J123204.9+215254e | 10.0 | 23.9 ± 0.4 | 1118 | AGN2 | 0.763 | 3.61|$^{+1.03}_{-0.92}$| | 1.31|$^{+0.25}_{-0.21}$| | 1.9 | – |
| 6 | J135055.7+642857 | 1.5 | 25.0 ± 0.8 | 458 | – | – | >0.1b | 2.02|$^{+0.13}_{-0.08}$| | – | 183.5 ± 5.5 |
| 7 | J143623.8+631726 | 2.53 | 22.2d ± 0.2 | 55 | AGN2 | 0.893 | 1.46|$^{+0.39}_{-0.24}$| | 1.69|$^{+0.15}_{-0.11}$| | 0.84 | – |
Notes: aFor all the sources, the best-fitting spectral model in the X-ray energy band is a simple absorbed power-law model; bThe 90 per cent lower limit on NH obtained assuming z = 0; cThis parameter has been fixed; dFor these sources the R-band magnitude has been obtained from the SDSS r ‘model’ magnitudes assuming r − R = 0.27 (rSDSS AB = RVega + rAB(Vega) with rAB(Vega) = 0.27); eFor these two sources, we propose here a different redshift with respect to that already reported in the literature. See Section 4 for details.
In this paper, we consider a first complete sample of EXO50 sources having fx > 1.5 × 10⁻¹³ erg cm−2 s−1; this sample is composed by the seven EXO50 objects reported in Table 1. In Fig. 1, we show the fx/fo distribution of the sample composed by all the serendipitous point-like sources in the covered area having fx > 1.5 × 10⁻¹³ erg cm−2 s−1(i.e. the starting sample, 310 objects). In the same figure, we show how extreme the seven sources are with respect to the starting sample; the EXO50 sources discussed here represent only ∼2 per cent of the population considered. We stress that according to the selection criteria discussed above and the optical material at our disposal, these seven objects are the only EXO50 sources, north of −10 deg declination, with fx > 1.5 × 10⁻¹³ erg cm−2 s−1 in the sky survey area defined in Mateos et al. (2008); the sky coverage investigated to find out these seven objects is about 60.4 deg2.
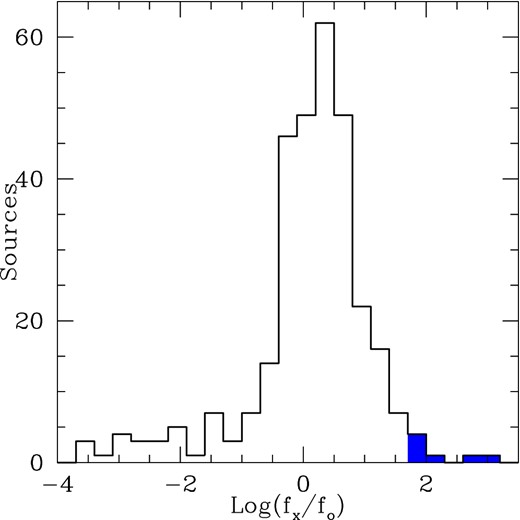
Histogram of the fx/fo distribution of the starting sample with fx > 1.5 × 10⁻¹³ erg cm−2 s−1(310 objects). We also show as filled histogram the fx/fo distribution of the seven EXO50 sources discussed in this paper.
As detailed in the following sections, out of the seven EXO50 sources two are BL Lac objects, three are confirmed type 2 QSO and two remain spectroscopically unidentified, although their broad-band properties strongly suggest an obscured QSO nature. Using the java software galaxycount (Ellis & Bland-Hawthorn 2007) and considering the optical magnitudes of the proposed optical counterparts (see Table 1), we estimate less than 0.3 normal galaxies by chance in the total area covered from the seven error boxes, assuring us about the reliability of the spectroscopic identification proposed here.
3 OBSERVATIONS AND DATA REDUCTION
3.1 Optical imaging
In Fig. 2 (left-hand panels), we present the optical finding charts of the seven sources discussed here (1 arcmin×1 arcmin) produced using data from dedicated TNG observing runs (R filter) or from the SDSS (r filter).
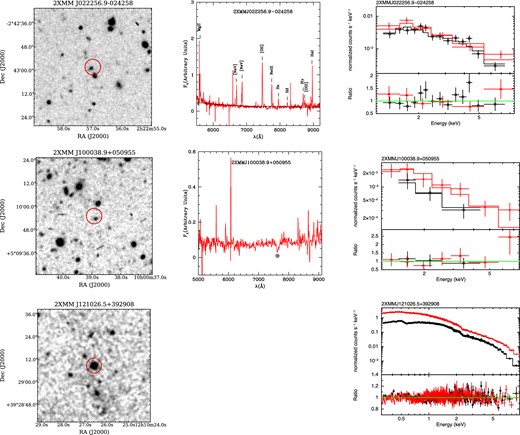
Left-hand panels: optical finding chart (1 arcmin×1 arcmin) for the seven EXO50 objects reported in this paper produced using material from dedicated TNG observing runs (R filter; sources: 2XMM022256.9−024258, 2XMM100038.9+050955, 2XMM123204.9+215254, 2XMM135055.7+642857) or from SDSS (r filter; sources: 2XMM121026.5+392908, 2XMM121134.2+390054, 2XMM143623.8+631726). The circle is 4 arcsec radius around the X-ray position. Middle panels: the optical spectra of the EXO50 objects observed at the GTC. The solid black line in the spectroscopically identified objects represents the underline galaxy component used to reproduce the optical spectrum, except for 2XMMJ121134.2+390054, for which we show the galaxy component (blue line), the AGN component (continuum plus broad emission lines, red line) and the combined component (galaxy plus AGN; black line). The spectral lines used to classify the objects are also marked. 2XMMJ121026.5+392908 is a well-known object and its redshift and classification has been taken from the literature. Right-hand panels: X-ray data (observer frame) and residuals for the EXO50 objects discussed here. All the objects are well fitted with an absorbed power-law model. Red filled triangles: pn data. Black open circles: MOS data.
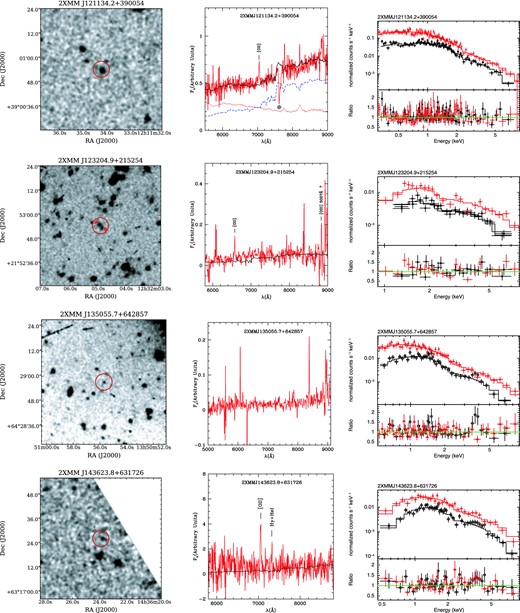
– continued
TNG raw images were reduced following the standard CCD reduction process using iraf 2.14. All images were de-biased and corrected for flat-field effects. We combined the different exposures for each source and the resulting images were flux calibrated using standard stars and the standard extinction curve for the observatory. Finally, we did an astrometric calibration of each image; the astrometric accuracy of our imaging is typically better than ∼0.3 arcsec. The R magnitudes were estimated with iraf routines following the standard procedure of aperture photometry centred at the source position.
3.2 Optical spectroscopy and identification
The optical spectra for six of our sources were taken at GTC during three different observing runs (see Table 2) using the R500R grism on the OSIRIS instrument.3 For the reduction, we used the standard iraf long-slit package following the standard steps. The resulting spectra (see Fig. 2 middle panels, in arbitrary units) give us spectroscopic information (classification and redshift) for four out of the six GTC sources. For the remaining two sources (2XMMJ100038.9+050955 and 2XMMJ135055.7+642857), the spectra are inconclusive and do not allow us to derive any relevant information. The source 2XMMJ121026.5+392908 is a well-known object and its redshift and classification have been taken from the literature. In total, we have spectroscopically identified (using the GTC data as well as data from the literature) five EXO50 objects; two sources remain still spectroscopically unidentified, although the data at other wavelengths discussed in Sections 4 and 5 strongly suggest an obscured QSO nature.
Optical follow-up spectroscopic observations. Columns are as follows: (1) source name; (2) programme ID; (3) instrument/grism used (4) number of exposures and exposure times in seconds; (5) slit width in arcsec; (6) dates of the observations. In parenthesis, we have indicated the number of exposures.
| 2XMMName | Programme | Instrument/grism | Exposure (s) | Slit Width (arcsec) | Dates |
|---|---|---|---|---|---|
| (1) | (2) | (3) | (4) | (5) | (6) |
| J022256.9−024258 | GTC18-10B | OSIRIS/R500R | 6 × 1100 | 1.2 | 2-Sep-2010 (4), 19-Sep-2010 (2) |
| J100038.9+050955 | GTC44-11A | OSIRIS/R500R | 4 × 1800 | 1.0 | 10-Apr-2011 |
| J121134.2+390054 | GTC18-10B | OSIRIS/R500R | 2 × 600 | 1.2 | 27-Jan-2011 |
| J123204.9+215254 | GTC44-11A | OSIRIS/R500R | 2 × 1800 | 1.0 | 10-Apr-2011 (1), 11-Apr-2011 (1) |
| J135055.7+642857 | GTC44-11A | OSIRIS/R500R | 3 × 1800 | 1.0 | 10-Apr-2011 |
| J143623.8+631726 | GTCMULTIPLE2-09A | OSIRIS/R500R | 7 × 1500 | 1.2 | 17-Apr-2009 (1), 19-Apr-2009 (3), 25-May-2009 (3) |
3.3 WISE All-Sky Survey data
The Wide-field Infrared Survey Explorer (WISE; Wright et al. 2010) has recently carried out an all sky survey in the medium IR regime, detecting hundreds of millions of objects. The estimated 5σ point sources sensitivities (in unconfused regions) in the four observed channels (W1 = 3.4 μm, W2 = 4.6 μm, W3 = 12 μm and W4 = 22 μm) are better than 0.08, 0.11, 1 and 6 mJy, while the angular resolution (FWHM) are 6.1, 6.4, 6.5, 12 arcsec, respectively; the astrometric precision for high signal-to-noise ratio (SNR) sources is better than 0.15 arcsec. To add the WISE information to our study, we have cross-correlated our EXO50 sample with the WISE All-Sky source catalogue4 using a positional tolerance, from the X-ray source position, equal to 4 arcsec. All our sources have been detected by WISE (see below) and a posteriori the offset between the WISE and the optical position of our sources is below 2 arcsec. The results of this cross-correlation are reported in Table 3. We found a single WISE counterpart for all the seven sources discussed here. The detections reported in Table 3 have a significance greater than 7σ in all bands, with the exception of 2XMMJ100038.9+050955, 2XMMJ123204.9+215254 and 2XMMJ143623.8+631726, detected in the W4 band at 6.1σ, 3.6σ and 3.9σ, respectively. Two sources, 2XMMJ121026.5+392908 and 2XMMJ121134.2+390054, are not detected in the W3 and W4 bands.
IR (WISE) data for the EXO50 sources discussed here. Columns are as follows: (1) number used to mark the object in the plots shown in Section 5; (2) source name; (3) X-ray-to-optical flux ratio; (4) optical spectroscopic classification and redshift; (5) W1 magnitude (3.4 μm) and 1σ error; (6) W2 magnitude (4.6 μm) and 1σ error; (7) W3 magnitude (12 μm) and 1σ error. The magnitude lower limits correspond to the 95 per cent confidence level as reported in the WISE catalogue; (8) W4 magnitude (22 μm) and 1σ error. The magnitude lower limits correspond to the 95 per cent confidence level as reported in the WISE catalogue; (9) Log of the rest frame 12.3 μm luminosities (|$\nu _{12.3 \,\mu \mathrm{m}} \times L_{12.3 \,\mu \mathrm{m}}$| in erg s−1) computed as described in Section 3.3.
| n | 2XMMName | fx/fo | ID(z) | W1 | W2 | W3 | W4 | Log(νLν) |
|---|---|---|---|---|---|---|---|---|
| (12.3 μm) | ||||||||
| (1) | (2) | (3) | (4) | (5) | (6) | (7) | (8) | (9) |
| 1 | J022256.9−024258 | 72 | AGN2(z = 1.004) | 16.02 ± 0.06 | 14.89 ± 0.07 | 11.08 ± 0.09 | 8.07 ± 0.15 | 45.61 |
| 2 | J100038.9+050955 | 138 | – | 16.22 ± 0.08 | 14.29 ± 0.05 | 10.33 ± 0.06 | 7.97 ± 0.18 | – |
| 3 | J121026.5+392908 | 50 | BLLAC(z = 0.617) | 14.86 ± 0.04 | 14.59 ± 0.06 | >12.34 | >8.66 | – |
| 4 | J121134.2+390054 | 50 | BLLAC(z = 0.890) | 15.21 ± 0.04 | 15.03 ± 0.08 | >12.50 | >9.45 | – |
| 5 | J123204.9+215254 | 1118 | AGN2(z = 0.763) | 15.35 ± 0.05 | 13.84 ± 0.04 | 10.19 ± 0.05 | 8.48 ± 0.30 | 45.10 |
| 6 | J135055.7+642857 | 458 | – | 14.90 ± 0.03 | 13.85 ± 0.03 | 10.46 ± 0.04 | 8.47 ± 0.15 | – |
| 7 | J143623.8+631726 | 55 | AGN2(z = 0.893) | 15.09 ± 0.03 | 14.05 ± 0.04 | 11.36 ± 0.09 | 8.91 ± 0.28 | 45.10 |
Using a simulated sample with random positions of ∼1600 objects, we estimated that the probability to have a random WISE source inside a circle of 2 arcsec radius is ∼1 per cent (i.e. 0.07 WISE sources expected by chance in the seven error circles investigated here), implying that all the detected WISE counterparts are very likely associated with the high fx/fo sources.
Flux densities at 3.4, 4.6, 12 and 22 μm have been computed from the magnitudes reported in Table 3 by assuming the magnitude zero-points of the Vega system corresponding to a power-law spectrum (fν ∝ ν−α) with α = 1 (see Wright et al. 2010). The differences in the computed flux densities expected using flux correction factors that correspond to a Δα = ±1 are lower than 0.8, 0.6, 6 and 0.7 per cent in the W1, W2, W3 and W4 band, respectively (Wright et al. 2010).
3.4 XMM–Newton spectroscopy
In Table 4, we report details for the XMM–Newton data used for the X-ray spectral analysis of each source discussed here. The XMM–Newton data were cleaned and processed with the XMM–Newton Science Analysis Software (sas) and were analysed with standard software packages (ftools, xspec; Arnaud 1996). Event files produced from the pipeline were filtered from high-background time intervals and only events corresponding to patterns 0–12 for MOS and 0–4 for pn were used. All spectra were accumulated from a circular extraction region with a radius of 20–30 arcsec, depending on the source off-axis distance. Background counts were accumulated in nearby circular source-free regions, using an area usually about a factor of 4 larger than the one used to extract the source counts. The X-ray spectra usually cover the 0.3–10 keV energy range; the total (MOS1+MOS2+pn) net (background-subtracted) counts range from ∼102 to ∼3 × 10⁵ counts. The ancillary response matrix and the detector response matrix were created by the xmm-sas tasks arfgen and rmfgen at each source position in the European Photon Imaging Camera (EPIC) MOS and pn detectors. To improve the statistics, the MOS1 and MOS2 spectra obtained by using the same filter were combined a posteriori by using the ftools task mathpha; in this case, ancillary and detector response matrices for the MOS1 and MOS2 detectors for each source were combined by using the tasks addrmf and addarf. For all the sources but 2XMMJ100038.9+050955, we grouped the spectra in bins containing more than 20 (source+background) counts and used the χ2 minimization technique; in the case of 2XMMJ100038.9+050955, we grouped the spectra in bins containing 10 (source+background) counts and use the Cash statistics. In the case of 2XMMJ121026.5+392908, two XMM observations were used; pn (MOS) data from the two independent data set were combined together and the ancillary and detector response matrices were created using the same procedures quoted above. We fitted pn and MOS spectra simultaneously in the 0.3–10 keV band, tying together all pn and MOS parameters except for a relative normalization, which accounts for the differences between pn and MOS flux calibrations (see Mateos et al. 2009). In the following, derived fluxes and luminosities refer to the MOS instrument.
EPIC XMM–Newton observation details. Column are as follows: (1) 2XMM source name; (2) obsid of the XMM–Newton observation; (3) Galactic absorbing column density along the line of sight in units of 1020 cm−2; (4) EPIC instrument; (5) EPIC filter; (6) exposure time after removing high-background intervals, in units of ks; (7) net counts in the energy range 0.3–10 keV.
| Name | obsid | NH | Instr. | Filter | Net exp. time | Net counts |
|---|---|---|---|---|---|---|
| (1) | (2) | (3) | (4) | (5) | (6) | (7) |
| J022256.9−024258 | 0037981601 | 2.34 | MOS1&2 | Thin | 26.1 | 265 |
| pn | Thin | 7.9 | 127 | |||
| J100038.9+050955 | 0204791101 | 2.41 | MOS1 | Med | 16.1 | 27 |
| pn | Med | 12.5 | 63 | |||
| J121026.5+392908 | 0112830501, | 2.00 | MOS1&2 | Med | 161.5 | 119 876 |
| 0112830201 | pn | Med | 68.9 | 175 724 | ||
| J121134.2+390054 | 0112190201 | 1.84 | MOS1&2 | Med | 27.8 | 2311 |
| pn | Med | 8.9 | 2488 | |||
| J123204.9+215254 | 0112650301 | 1.80 | MOS1 | Thin | 19.3 | 248 |
| MOS2 | Med | 19.5 | 250 | |||
| pn | Thin | 13.1 | 447 | |||
| J135055.7+642857 | 0147540101 | 1.70 | MOS1&2 | Med | 44.6 | 873 |
| pn | Med | 18.9 | 1064 | |||
| J143623.8+631726 | 0204400301 | 1.37 | MOS1&2 | Med | 46.7 | 862 |
| pn | Med | 12.7 | 648 |
For the spectral modelling, we considered a simple absorbed power-law model that takes into account both the Galactic hydrogen column density along the line of sight (from Dickey & Lockman 1990) and a possible intrinsic absorption at the source redshift (abundances relative to the solar one as reported in Wilms, Allen & McCray 2000). In the X-ray spectral modelling we made use, when available, of the redshifts obtained from the optical spectroscopy. All the X-ray spectra are well fitted by this simple model; the results are reported in Table 1 along with the corresponding flux (corrected for Galactic absorption) and intrinsic luminosity (i.e. corrected for both Galactic and intrinsic absorption) in the standard 2–10 keV energy band. The X-ray spectra are shown in Fig. 2 (right-hand panels). In the case of 2XMMJ100038.9+050955, the spectral quality does not allow us to constrain the power-law photon index and the intrinsic absorption at the same time, so we have fixed the power-law photon index Γ to 1.9, a common value for unabsorbed AGN (Mateos et al. 2010; Corral et al. 2011; Lanzuisi et al. 2013).
4 RESULTS
Before discussing the properties of each single object in this sample, we summarize here their main properties. From optical spectroscopy, out of the seven EXO50 sources two are classified as BL Lac objects, three are classified as type 2 QSO and two remain unidentified. The three sources classified as type 2 QSO are in the redshift range 0.7–1 and are characterized by an intrinsic X-ray absorbing column density, NH, in the range between 1.5 and 8 × 1022 cm−2. For the two unidentified objects, the X-ray analysis provides lower limits to the intrinsic NH of 4 × 1021 cm−2 and 1021 cm−2, respectively. There are no Compton thick AGN (NH in excess to ∼1024 cm−2) amongst the three type 2 QSO, neither is suspected their presence in the two still spectroscopically unidentified sources, since their X-ray spectra are at odds with that usually observed in Compton thick AGN (e.g. the presence of a prominent iron line at 6.4 keV, rest frame or a very flat X-ray spectrum). The two BL Lac objects are at z = 0.62 and 0.89 and, as it will be discussed in Section 5.7, they are rather extreme in their SED.
For the three EXO50 sources spectroscopically identified as type 2 QSOs (see below), we report in Table 3 the rest-frame 12.3 μm luminosity obtained by interpolating the observed luminosity (i.e. not corrected for reddening) in the W3 (observed frame, 12 μm) and W4 (observed frame, 22 μm) WISE bands and using the measured spectral index between 12 and 22 μm; the same spectral index has been used to evaluate the K-correction. Gandhi et al. (2009), studying a sample of type 1 and type 2 Seyferts, showed that the observed luminosity around 12.3 μm rest frame (|$\nu _{12.3 \,\mu \mathrm{m}} \times L_{12.3 \,\mu \mathrm{m}}$|) should represent an accurate proxy for the AGN intrinsic power; in powerful AGN the contribution expected from the host galaxy at these wavelengths is marginal (<10 per cent; Ballo et al. 2014). Overall, the derived IR luminosities are in the range typical of luminous infrared galaxies (LIR > 1011 L⊙) and ultra luminous infrared galaxies (LIR > 1012 L⊙, see e.g. Sanders & Mirabel 1996). Assuming a bolometric correction factor to the 12.3 μm luminosity of ∼10.8, appropriate for high luminosity AGN (see Ballo et al. 2014) the implied bolometric luminosities for the three spectroscopically identified type 2 QSO are in the range 1.5–4.5 × 1046 erg s−1.
2XMMJ022256.9−024258; fx/fo = 72
A single source (R = 22.1) is evident in the optical finding chart within the X-ray error circle (see Fig. 2). The optical spectrum of this object shows several narrow (observed FWHM <1000–1500 km s−1) emission lines that we associate with Mg ii λ2798, [Ne v] λ3346, 3426, [O ii] λ3728, [Ne iii] λ3869, Hϵ, Hδ, Hγ, [O iii] λ4364 and He iλ4471 at z = 1.004. The permitted emission lines (Hγ and Mg ii λ2798) have widths similar to the forbidden ones. The Hγ has a FWHM of 550–600 km s−1 that is close to the instrumental resolution. The Mg ii λ2798 has a strongly asymmetric profile, which is difficult to analyse with the present data, being the line at the border of the sampled wavelength range; the FWHM of this line is likely below 1500 km s−1. It is worth noting the presence in this object of the [Ne v] λ3426 line, a reliable signature of nuclear activity since it cannot be produced in starburst/star-forming galaxies (see e.g. Gilli et al. 2010; Mignoli et al. 2013). The X-ray spectrum is well described by an absorbed power-law model with an NH of ∼7.5 × 1022 cm−2 ; the intrinsic, rest-frame, 2–10 keV luminosity is ∼1.9 × 1045 erg s−1. Based on the optical and X-ray spectral properties (optical line widths, intrinsic NH and intrinsic 2–10 keV luminosity in excess to 1044 erg s−1), we classify this source as a type2 QSO. 2XMMJ022256.9−024258 is detected in all the WISE bands (see Table 3).
2XMMJ022256.9−024258 also has strong radio emission associated with the radio source 4C-02.11. The total 1.4 GHz radio flux from the FIRST survey (White et al. 1997) is ∼340 mJy corresponding to a radio power of ∼1.7 × 1034 erg s−1 Hz−1 at z = 1.004. The source is also detected in the lower spatial resolution NVSS survey (Condon et al. 1998). The total NVSS radio flux density (power) is 429 ± 14 mJy (2.18 ± 0.07 × 1034 erg s−1 Hz−1); the radio flux density from the NVSS is a more reliable measure of the total radio flux, since the VLA-B configuration used for the FIRST survey could miss some of the diffuse extended emission. For this source, we also found in the literature fluxes at 178 MHz (f178 MHz = 2.6 ± 0.65 Jy; Gower, Scott & Wills 1967) and 4.85 GHz (f4.85 GHz = 0.116 ± 0.012 Jy; Griffith et al. 1995); assuming a power-law model, the derived radio spectral index is ∼0.94, consistent with the typical values of lobe-dominated AGN (Kellermann & Owen 1988).
In Fig. 3, we show the radio intensity contours from the FIRST radio survey overlaid on the optical image; the radio counterpart of 2XMMJ022256.9−024258 is a double radio source having the typical Fanaroff–Riley type II morphology (i.e. sharp edge lobes and bright hotspots); the absolute optical magnitude (MR ≃ −24, assuming a K-correction of ∼2 mag, typical of a late type galaxy, see Fukugita et al. 1995) and the total radio power (∼2.2 × 1034 erg s−1 Hz−1) are consistent with the FR II classification according to the dividing line in the MR–Lradio plane between FR I and FR II radio galaxies (see Ghisellini & Celotti 2001).
 Figure 3.
Radio (FIRST) contour plots superimposed to a CCD R image (taken at the TNG) of 2XMMJ022256.9−024258; the red hatch indicates the object responsible for the X-ray emission. The radio contours start from 0.2 mJy with a multiplicative step of ∼1.58. The large blue bar at the bottom is 1 arcmin wide: at the redshift of the source 1 arcmin corresponds to ∼0.48 Mpc. North is upwards, east is on the left.
The projected separation of the two bright hotspots is ∼41 arcsec on the sky, corresponding to a physical projected size of ∼0.33 Mpc at the redshift of the source. Given the discussed radio properties, the object is clearly a radio-loud and lobe-dominated AGN. In this respect, we note that the measured size and total radio luminosity are fully consistent with that observed in other radio quasars (see fig. 4 in Kuźmicz & Jamrozy 2012).
 Figure 4.
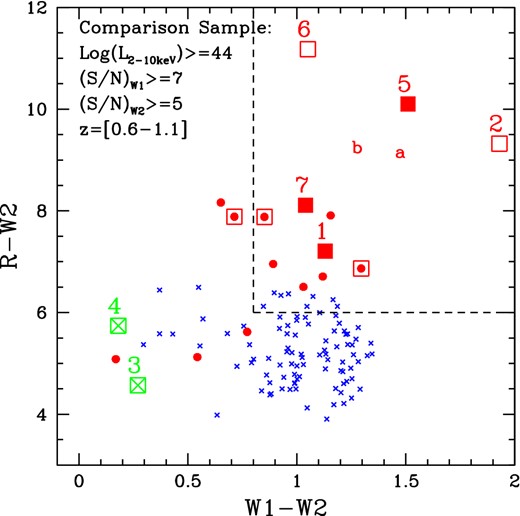
Left-hand panel: relationship between the measured fx/fo (in logarithmic units) and the intrinsic 2–10 keV luminosity for our sample of EXO50 objects and for the comparison sample of AGN assembled as described in Section 5.1. Large squares: our sample of EXO50 objects (filled-red for type 2 QSO, open-red for unidentified objects and open-crossed-green for BL Lac objects) the numbers close to the large squares mark the EXO50 objects as reported in Tables 1 and 3. The labels (a) and (b) mark the position of the objects XBSJ021642.3−043553 (z ∼ 2, source a) and XID2028 (z ∼ 1.6, source b) discussed in section 5.2. Filled red circles: type 2 AGN from the comparison sample; small blue crosses: type 1 AGN from the comparison sample; the dashed diagonal corresponds to the relation between fx/fo and the intrinsic 2–10 keV luminosity for obscured AGN, while the two dotted lines corresponds to a scatter of about 0.5 dex around this relation. Right-hand panel: the fx/fo ratio as a function of the optical–IR colour R − W1 (a proxy of the usual R − K colour) for the EXO50 objects and for the sample of QSO W1/W2 as described in the text; the vertical dashed line (R − W1 = 6.5) corresponds roughly to R − K = 5. The horizontal dashed line correspond to fx/fo = 50. Symbols and colours are as in the left-hand panel.
Considering the broad-band properties discussed above, 2XMMJ022256.9−024258 can be considered another example of the rare class of radio loud type 2 QSO, with overall properties very similar to those shown by e.g. AXJ0843+2942 (Della Ceca et al. 2003), 6C0905+39 (Erlund et al. 2008) or 4C+39.29 (Gandhi et al. 2006). Indeed according to the data reported in Erlund et al. (2008, see their fig. 3), this object is one of the most powerful sources currently known; its intrinsic X-ray luminosity (∼2 × 1045 erg s−1), if compared with its 178 MHz luminosity (∼1.3 × 1035 erg s−1 Hz−1), is more than a factor 10 above the locus sampled by the narrow line radio galaxies at z < 1.0 in the 3CRR catalogue and similar to that observed in broad-line radio galaxies and QSOs (see fig. 3 in Hardcastle, Evans & Croston 2009).
2XMMJ100038.9+050955; fx/fo = 138
The optical magnitude of the single object in the error circle (see Fig. 2) is R = 23.6. The gathered optical spectrum, unfortunately characterized by a very low SNR, seems to be rather flat and featureless, thus we have no redshift information for 2XMMJ100038.9+050955. The source is detected in all the WISE bands while there is no radio detection at the source position. Assuming that 2XMMJ100038.9+050955 is an absorbed QSO and using the relation between fx/fo and the intrinsic 2–10 keV luminosity (Brusa et al. 2010, see Section 5), we can estimate a redshift z ∼ 1.0 (in the range 0.6–1.6 taking into account a scatter of 0.5 dex in the relation, see Fig. 4, left-hand panel). At z ≃ 1.0, the intrinsic 2–10 keV luminosity would be ∼9 × 1044 erg s−1 while the intrinsic NH ∼ 5 × 1022 cm−2.
2XMMJ121026.5+392908; fx/fo = 50
This source was the only one not observed during our GTC run; it is a well-known BL Lac object at z = 0.617 (Caccianiga et al. 2002; Plotkin et al. 2010). The observed optical magnitude (R = 19.16), the radio (19 ± 0.7 mJy at 1.4 GHz from the NVSS) and the X-ray (∼3.6 × 10⁻¹² erg cm−2 s−1in the 2–10 keV band) fluxes allow us to compute multiwavelength spectral indices5 (αRX = 0.54; αOX = 0.61; αRO = 0.50) which are fully consistent with the BL Lac classification (Stocke et al. 1991; Caccianiga et al. 1999). The measured αRX (<0.8) suggests a high-frequency-peaked BL Lac object (HBL) in which the low-energy component of their usual, double-peak, SED peaks between the UV band and X-rays (Padovani & Giommi 1995). The observed X-ray spectrum is well described by a featureless power-law model (|$\Gamma = 2.23^{+0.01}_{-0.01}$|) with intrinsic NH = 6 × 1020 cm−2 and intrinsic 2–10 keV luminosity of ∼6.4 × 1045 erg s−1. In the WISE survey, 2XMMJ121026.5+392908 is detected only at 3.4 and 4.6 μm (WISE band W1 and W2, respectively).
2XMMJ121134.2+390054; fx/fo = 50
The optical object clearly visible at the centre of the error circle (see Fig. 2) has a magnitude R = 20.77. 2XMMJ121134.2+390054 is a well-known object since the epoch of the Einstein Extended Medium Sensitivity Survey (Stocke et al. 1991) and it is classified as a BL Lac object (MS1209+3917; Rector et al. 2000). The observed optical magnitude, radio (10.6 ± 0.6 mJy at 1.4 GHz from NVSS) and X-ray (∼8.2 × 10⁻¹³ erg cm−2 s−1) fluxes imply multiwavelength spectral indices (αRX = 0.58; αOX = 0.62; αRO = 0.56) fully consistent with the BL Lac classification (Stocke et al. 1991; Caccianiga et al. 1999). As for 2XMMJ121026.5+392908 discussed above, also 2XMMJ121134.2+390054 can be classified as a HBL object.
From the analysis of the optical spectrum shown in Fig. 2, we reach the conclusion that the only clear feature is that at ∼7048 Å, most likely associated with [O ii] λ3727 Å at z = 0.89; we estimate an observed equivalent width (EW) of ∼12–15 Å, that rescaled to z = 0 imply an EW ∼6–8 Å, very close to the limit used to classify a source as a BL Lac object (EW < 5 Å; Stocke et al. 1991).
While our spectroscopic classification as a BL Lac object agrees with previous results, the redshift proposed here (z = 0.89) is significantly different from that proposed by Rector et al. (2000, z = 0.602). These latter authors did not find any evidence of emission line(s) in their spectrum, and based their tentative redshift determination on low SNR absorption features. We are confident that the line observed at ∼7048 Å is real and this line does not have any reliable identification if the object is at z = 0.602. Moreover at the proposed redshift (z = 0.89), we were able to reproduce quite well also the shape of the underlying optical continuum (see Fig. 2). Finally, we note that this source is strongly variable: at least a factor of 5.5 in the X-ray domain (by comparing the measured 0.1–2.4 keV flux with the flux in the ROSAT All Sky Survey) and a factor of 3 in the optical domain (by comparing our magnitude with the Vmag = 20 reported in Rector et al. 2000), so this variability could explain the clear different shape from the optical spectra reported in Rector et al. (2000) and that reported here (see Fig. 2).
At z = 0.89, the observed X-ray spectrum is well described by a featureless power-law model (|$\Gamma = 2.21^{+0.07}_{-0.06}$|) with intrinsic NH = 1.9 × 1021 cm−2 ; the intrinsic 2–10 keV luminosity is ∼3.7 × 1045 erg s−1. The intrinsic absorption is significantly in excess to the Galactic value and this is at odds with what is usually observed in BL Lacs and, in particular, in HBL objects (see e.g. Massaro et al. 2011a and references therein). On the other end, the X-ray spectrum could be intrinsically curved due to the bump expected in HBL, peaking between the UV and X-ray bands. We therefore fitted the X-ray data with a broken power-law model filtered by the Galactic absorption; we find a good fit (|$\chi _{\nu }^{2}$| = 1.1 for 194 d.o.f.) with best-fitting parameters |$\Gamma _1 = 1.57^{+0.1}_{-0.2}$|, |$\Gamma _2 = 2.30^{+0.10}_{-0.13}$| and |$E_{\rm c} = 1.23^{+0.2}_{-0.28}$|, which are consistent with the results reported in Massaro et al. (2011a) on a sample of HBL sources. The intrinsic 2–10 keV luminosity obtained with the broken power-law model is equal to that previously reported in Table 1. In analogy with the other confirmed BL Lac object in the sample (2XMMJ121026.5+392908), in the WISE survey this source is detected only at 3.4 and 4.6 μm.
2XMMJ123204.9+215254; fx/fo = 1118
Two optical sources (labelled with A and B in the finding chart reported in Fig. 2) are clearly present inside the X-ray error circle; they have an R magnitude of R = 23.94 ± 0.41 (source A) and R = 24.73 ± 0.64 (source B). An optical spectrum of source A, obtained summing up two independent exposures, is shown in Fig. 2; the spectrum has a clear red continuum and a significant line at ∼6569 Å. Assuming this line to be [O ii] λ3727 Å at z = 0.763, another observed feature is in very good agreement with being [O iii] λ5007 Å ; these two features are clearly seen in both the single exposures and are not associated with strong sky lines. We have also tried to take an optical spectrum of the source B, but the source is very faint and no useful information could be extracted from the very noisy spectrum.
2XMMJ123204.9+215254 is detected in all the WISE bands discussed here. The WISE position is coincident with a source detected in the K band (K = 18.07 ± 0.05; see Del Moro et al. 2009) and both are significantly closer to the brightest optical source (source A), strongly suggesting that the most probable optical counterpart of the X-ray source 2XMMJ123204.9+215254 is the source A. In the following of this paper, we therefore assume that the 2XMMJ123204.9+215254 is spectroscopically identified with a type 2 QSO at z = 0.763.
2XMMJ123204.9+215254 was previously discussed in Del Moro et al. (2009), who report an IR spectrum taken at the Subaru telescope (with the MOIRCS instrument) clearly revealing the presence of a line at the observed frame of 1.8837 μm. Lacking optical spectroscopy and a deep optical image, these authors discussed several possible identifications for the IR line and suggested the Hα line at z = 1.87 as its most probable origin. As discussed above, our optical spectroscopy at the GTC suggests a lower redshift of z = 0.763. In this case, the NIR feature reported in Del Moro et al. (2009, observed at 1.8837 μm) could be associated with the line complex He iλ10830+Paγ10941, a strong and quite common feature in AGN (see Glikman, Helfand & White 2006), expected to be at ∼1.92 μm (at z = 0.763), slightly higher than the observed feature. However, the observed NIR line falls in a wavelength range dominated by the effect of atmospheric absorption, so it is difficult to determine the intrinsic line centroid; all in all, we consider the association of the IR line with the He iλ10830+Paγ10941 complex as highly plausible. On the contrary, none of the faint features that we see in the optical spectrum could be associated with any relevant emission lines from an AGN in the case of z = 1.87.
At the proposed lower redshift (z = 0.763), the X-ray spectrum is described by an absorbed power-law model having a very flat photon index, Γ = 1.31 ± 0.23, and an intrinsic |$N_{\rm H} = 3.6^{+1.03}_{-0.92}\times 10^{22}$| cm−2. The intrinsic 2–10 keV luminosity is ∼1.9 × 1045 erg s−1. Since the best-fitting photon index is rather flat, we test the stability of the measured NH and luminosity assuming a typical AGN photon index (Γ = 1.9); we derive an intrinsic |$N_{\rm H} = 5.9^{+0.73}_{-0.65}\times 10^{22}$| cm−2 and an intrinsic 2–10 keV luminosity of ∼2.3 × 1045 erg s−1 in good agreement with the previous values. We note that 2XMMJ123204.9+215254 is not only the object with the highest fx/fo in this sample, but (to our knowledge) it is the non-transient spectroscopically identified source with the highest fx/fo discovered so far.
2XMMJ135055.7+642857; fx/fo = 458
A very faint object (R = 25.0) is visible at the centre of the error circle. Unfortunately, the optical spectrum is very noisy and no features are clearly detected; we have no redshift information for this object. The X-ray spectrum is described by a power-law model with photon index Γ ∼ 2 and absorbing column density greater than ∼2 × 1021 cm−2 (obtained assuming z = 0). An emission line is possibly detected in the EPIC-MOS spectrum (see the residuals in Fig. 2, where the model does not include the line). However, no compelling evidence of the presence of this line in the EPIC-pn is found, although different spectral binnings were tried.
If this line is real, and associated with the Fe Kα emission line (the most prominent feature in the X-ray spectrum of an AGN), the implied redshift would be z ∼ 0.65, the absorbing column density ∼4 × 1021 cm−2 and the intrinsic 2–10 keV luminosity ∼2.5 × 1044 erg s−1; the line has an observed equivalent width of EW ∼ 400 eV. Interestingly, the source is also a strong (and compact) radio source, detected at 15 GHz (236 ± 1 mJy; Richards et al. 2011), 8.4 GHz (∼376 mJy; Healey et al. 2007) and at 1.4 GHz (183.5 ± 5.5 mJy; NVSS survey). The broad-band spectral indices (αRX = 0.88; αOX = 0.31; αRO = 1.15), computed with the fluxes reported above, and the possible presence of a Fe Kα line in the X-ray spectrum are not consistent with a BL Lac classification. We remind that the X-ray source is point-like and detected almost in the centre of the EPIC fields, so a high-z cluster of galaxies is very unlikely.
The radio spectrum is very flat (indeed almost inverted, with a maximum at ∼8 GHz) suggesting that this source could be classified as a gigahertz peaked-spectrum radio source, a class of sources supposed to be young radio galaxies which are often characterized by high intrinsic absorption (see e.g. Guainazzi et al. 2006).
Assuming that this source is an absorbed QSO and using the relation between fx/fo and the intrinsic 2–10 keV luminosity (see Section 5), we can estimate a redshift z ∼ 1.7 (z in the range 1.1–2.7, inconsistent with the redshift estimated by the putative iron line), with an intrinsic 2–10 keV luminosity ∼3 × 1045 erg s−1 and an intrinsic NH ∼ 1.2 × 1022 cm−2. This source is detected in all the WISE bands.
2XMMJ143623.8+631726; fx/fo = 55
A faint object with optical magnitude R = 22.16 is present in the centre of the error circle (see Fig. 2). The optical spectrum of this object is shown in Fig. 2; the two marked lines can be associated with [O ii] λ3728 and Hγ+He i (observed FWHM < 1100 km s−1) at z = 0.893. The observed X-ray spectrum is described by an absorbed power-law model with intrinsic NH = 1.46 × 1022 cm−2 ; the intrinsic 2–10 keV luminosity is ∼8.4 × 1044 erg s−1. The source is detected in all the WISE bands; there are no radio detections at the source position. We classify this source as a type 2 QSO.
5 DISCUSSION
Having defined a small but representative sample of bright EXO50 objects, it is now instructive to compare their broad-band properties with those of other samples of AGN, both absorbed and unabsorbed, from the literature.
5.1 The comparison sample
We have assembled an heterogeneous sample of spectroscopically confirmed X-ray selected type 1 and type 2 AGN from a few surveys carried out during the last few years using XMM–Newton data: the COSMOS survey (Brusa et al. 2010), the XMS survey (Barcons et al. 2007; Carrera et al. 2007) and the XBS survey (Della Ceca et al. 2004; Caccianiga et al. 2008). This first large comparison sample, composed by 882 type 1 AGN and 487 type 2 AGN, will be used below (see Fig. 4, left-hand panel) to discuss the position of absorbed and unabsorbed AGN in the fx/fo versus Lx plane.
As a second step, and in order to compare the optical–IR photometric properties of the EXO50 objects with objects having similar luminosities and redshifts, we have considered in the comparison sample only the high luminosity (intrinsic L(2−10 keV) > 1044 erg s−1) sources (i.e. the type 1 QSO and type 2 QSO) in the redshift range between 0.6 and 1.1; we have cross-correlated this latter sample of sources with the WISE All-Sky source catalogue, using a searching radius equal to 2 arcsec (consistently with the results obtained between the cross-correlation of the EXO50 sources and the WISE catalogue, see Section 3.3).
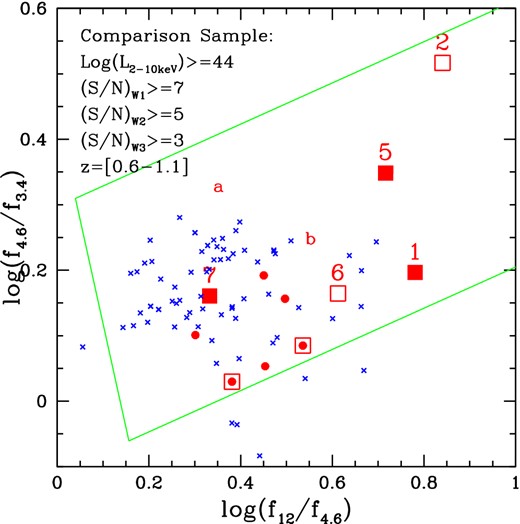
The WISE-QSO sample to be used in the comparisons depends also on the WISE band(s) considered; to obtain meaningful colour distributions, we use a similar approach followed by Yan et al. (2013) and base our comparisons (see below) on the following two WISE-X-ray-selected QSO samples: the QSO W1/2 sample (S/NW1 ≥ 7 and S/NW2 ≥ 5; 94 type 1 QSO and 11 type 2 QSO), the QSO W1/2/3 sample (S/NW1 ≥ 7, S/NW2 ≥ 5 and S/NW3 ≥ 3; 72 type 1 QSO and 7 type 2 QSO); the QSO W1/2/3 sample is obviously a subset of the QSO W1/2 sample
5.2 The X-ray-to-optical flux ratio versus Lx and the optical–IR colour
In Fig. 4, left-hand panel, we report the EXO50 objects discussed in this paper and the comparison sample of type 1 and type 2 AGN from the literature. In the comparison, sample 12 objects have fx/fo > 50 and all but two6 have been classified as type 2 QSO. Unfortunately, the large majority of these 12 sources (some of them will be highlighted in some figures reported below) are faint both in X-ray and in the optical domain, so only a couple of these interesting objects have been discussed in some detail in the literature. In particular, we have the type 2 QSO XBS J021642.3−043553 (z = 1.98, fx/fo ∼ 200, L(2−10 keV) ∼ 3 × 1045 erg s−1; see Severgnini et al. 2006) and the type 2 QSO XMMC_150.54703+1.61869 (XID2028, z = 1.59, fx/fo ∼ 60, L(2−10 keV) ∼ 8 × 1044 erg s−1; see Brusa et al. 2010, 2015); both objects are considered as prototypes of the obscured QSO population at high redshift, where the coexistence between massive galaxies (∼ few times 1011 M⊙ as estimated in the above papers) and powerful QSOs has been proved. Furthermore, in the case of XMMC_150.54703+1.61869, a recent paper (Perna et al. 2014) reports the discovery of a massive outflow (>630 M⊙ yr−1), extending out to 10 Kpc from the central black hole and having a total energetic in full agreement with the prediction by AGN feedback models.
The dashed diagonal line in Fig. 4 (left-hand panel) corresponds to the relation between fx/fo and the intrinsic 2–10 keV luminosity for obscured AGN initially proposed in Fiore et al. (1999) and revised by Brusa et al. (2010), while the two dotted lines corresponds to a scatter of about 0.5 dex around this relation. As discussed in the previous section, three EXO50 objects are spectroscopically identified as type 2 QSOs (the sources number 1, 5 and 7 in the figure); taking into consideration the scatter that we see for the other type 2 AGN, these three EXO50 objects seems to follow the same relationship between fx/fo and the intrinsic 2–10 keV luminosity.
It is worth noting the position of the two EXO50 objects spectroscopically identified as BL Lac objects (the sources number 3 and 4); both objects seem to have a larger X-ray luminosity for a given fx/fo if compared with the absorbed AGN population. This is indeed expected, since BL Lacs have SED strongly dominated by the beamed emission from the jets. Their high fx/fo therefore is not due to obscuration (as for the type 2 QSO where the optical luminosity is very likely dominated by the host galaxy) but to the intrinsic shape of the SED (see also below).
In Fig. 4 (right-hand panel), we plot the fx/fo ratio as a function of the optical–IR colour (R − W1) for our EXO50 objects and for the QSO W1/W2 sample defined in Section 5.1. The colour R − W1 can be considered a good proxy for the usual R − K colour and the vertical dashed line (R − W1 = 6.5) corresponds7 roughly to R − K = 5, the value used to define an object as an extremely red object (ERO; see e.g. Elston, Rieke & Rieke 1988; Daddi et al. 2000). X-ray emitting EROs studied so far strongly suggest that the bulk of this population is composed by obscured AGN (see e.g. Mignoli et al. 2004; Brusa et al. 2005; Severgnini et al. 2005) and the results obtained here support this view.8
A clear trend between the measured fx/fo and the optical–IR colours is present. This trend, visible both for the type 1 QSO and for the type 2 QSO samples (see also Brusa et al. 2005), could be partially explained as due to the effect of absorption (see also Section 5.6). As previously said, the nuclear optical fluxes are more depressed (indeed completely blocked in the case of type 2 QSO where we should see only the host galaxy) by circumnuclear matter if compared with the IR and X-ray fluxes. As already noted in Caccianiga & Severgnini (2011), the effect of absorption is important also in type 1 AGN and this explain why we see the trend also in type 1 QSOs. A further support to this hypothesis comes from the observation that, for the type 1 QSOs in Fig. 4 (right-hand panel) belonging to the XBS survey (for which we have X-ray and optical spectral information), there is a clear evidence that the sources with the higher fx/fo and redder colours are also those with the higher intrinsic NH.
Two out of three of the EXO50 sources classified as type 2 QSO are on the ‘EROs’ side of the diagram (R − W1 > 6.5); the only object just outside the EROS locus is 2XMMJ2256.9−024258 (the EXO50 object at z ∼ 1 associated with the double and bright radio source 4C-02.11), although its position in the plot is not significantly different from the other sources considering the scatter on the fx/fo versus R − W1 relation. The position of the two unidentified EXO50 in the fx/fo versus R − W1 plot (Fig. 4, right-hand panel, open squares), in the R − W2 versus W1 − W2 plot (Fig. 5, open squares) and in the fx/fo versus R − W2 plot (Fig. 7, open squares) strongly suggest an obscured QSO nature; if we assume that the two unidentified sources follow the fx/fo–Lx relation, their intrinsic Lx would be 2.5 × 1044–2.5 × 1045 erg s−1 (which would imply a redshift in the range 0.6–1.6) for 2XMMJ100038.9+050955 and 9 × 1044–9 × 1045 erg s−1 (which would imply a redshift in the range 1.1–2.7) for 2XMMJ135055.7+642857.
The optical–IR R − W2 colour versus the IR colour W1 − W2 for the EXO50 objects and for the comparison QSO W1/2 sample (see Section 5). The zone in the plot enclosed by the dashed line (R − W2 > 6 and W1 − W2 > 0.8) corresponds to the place where it is possible to select type2 QSO candidates (Yan et al. 2013). Symbols and colours are as in Fig. 4; we have also marked the sources with fx/fo > 50 in the comparison QSO samples using empty squares. The numbers mark our EXO50 objects as reported in Tables 1 and 3. The labels (a) and (b) mark the position of the objects XBSJ021642.3−043553 (z ∼ 2, source a) and XID2028 (z ∼ 1.6, source b) discussed in section 5.2.
5.3 The optical–IR flux ratio versus the IR colours
The optical–IR colours (R − W2) for our EXO50 objects and for the comparison QSO W1/2 sample as a function of the IR colour W1 − W2 are shown in Fig. 5. We have also marked the place (W1 − W2 > 0.8 and R − W2 > 6) where, according to Yan et al. (2013), it is possible to select type 2 QSO candidates. The two EXO50 objects spectroscopically identified as BL Lac objects seem to have optical–IR properties different from the bulk of the AGN population (see also Massaro et al. 2011b for similar results based on WISE MIR colours). We stress that our EXO50-type 2 QSO objects are amongst the most extreme sources in these diagrams (see fig. 1 5 in Yan et al. 2013 for a comparison with the SDSS QSO sample).
As can be seen, all the QSOs, regardless of their spectroscopic or fx/fo properties, span a very similar range of the IR (W1 − W2) colour, although there are a couple of our EXO50 objects with extreme W1 − W2 colours (source 2 and source 5, namely 2XMMJ100038.9+050955 and 2XMMJ123204.9+215254). On the contrary, the optical–IR colours (R − W2 or R − W1, see also Fig. 4, right-hand panel) have to be in some way correlated with the X-ray-to-optical flux ratio properties, and with the optical spectroscopic classification (see also the results reported in Fig. 7).
The observed quite similar range of the W1 − W2 colours in type 1 and type 2 QSOs (in agreement with similar results previously reported in e.g. Mateos et al. 2013) suggests that the absorption is probably not the only (and the more important) parameter in shaping the AGN IR continuum (between ∼1.7 and 3 μm rest frame assuming an average redshift of 0.8). On the contrary, the observed separation of the different classes of AGN in the R − W2 colour clearly indicates that the absorption could be an important parameter in shaping the optical–IR observed properties. We will discuss these topics in Section 5.6.
5.4 The IR colours diagnostic plot
In Fig. 6, we show the WISE MIR colours (this time as a ratio between fluxes) for our EXO50 objects and for the QSO W1/2/3 sample defined above; the two EXO50 BL Lac objects are not reported here, since they are not detected at 12 μm. The solid wedge represents the locus populated by luminous AGN according to Mateos et al. (2012). As shown in Mateos et al. (2012) and confirmed here, we see that the technique is highly effective at identifying both type 1 and type 2 QSOs. The position of the different kinds of QSOs in the WISE MIR colour plot does not seem to suggest a big difference between absorbed and unabsorbed AGN in the MIR domain, in good agreement with recent results reported in Mateos et al. (2013).
WISE MIR colours for the EXO50 objects and for the comparison QSO W1/2/3 sample (a subset of the QSO W1/W2 sample reported in Fig. 5, see Section 5.1 for details). Note that the two BL Lacs are not reported here since they are not detected at 12μm. The solid wedge represents the AGN locus according to Mateos et al. (2012, see Section 5 for details). Symbols and colours are as in Fig. 4; we have also marked the sources with fx/fo > 50 in the comparison QSO samples using empty squares. The numbers mark the EXO50 objects as reported in Tables 1 and 3. The labels (a) and (b) mark the position of the objects XBSJ021642.3−043553 (z ∼ 2, source a) and XID2028 (z ∼ 1.6, source b) discussed in section 5.2.
It is worth noting that three EXO50 objects clearly stand out from the zone populated by the bulk of AGN; two of these objects are spectroscopically identified and, interestingly, are the sources with the highest X-ray luminosity (namely 2XMMJ123204.9+215254 and 2XMMJ022256.9−024258).
5.5 The relation between EXO50 objects and EDOGs
The three EXO50 sources on the top-right zone of Fig. 5 (the sources 2, 5 and 6) have R − W4 above 15 (see Tables 1 and 3), implying a f24 μm/fR well in excess of ∼3000. These three sources can be classified as extreme dust-obscured galaxies (EDOGs, f24 μm/fR ≥ 2000; Lanzuisi et al. 2009), i.e. extreme examples of dust-obscured galaxies (DOG, f24 μm/fR ≥ 1000; see Dey et al. 2008; Fiore et al. 2008), a class of galaxies first discovered with the Spitzer Space Telescope. In these objects, the high IR-to-optical ratios imply that large amounts of dust are absorbing the optical light and re-emitting it in the IR. DOGs and EDOGs may play an important role in the formation of the most massive galaxies in the local Universe and, in particular, represent an important evolutionary step in the AGN–galaxy connection (see Lanzuisi et al. 2009 and reference therein).
A sample of 44 EDOGs from the Spitzer Wide-area InfraRed Extragalactic (SWIRE) survey having X-ray coverage (with XMM–Newton or Chandra) has been selected and studied by Lanzuisi et al. (2009); the source redshifts (both spectroscopic and photometric) are in the range between ∼0.7 and ∼2.5. About 95 per cent of the detected sources9 (23 objects) are consistent with being obscured by neutral gas with an intrinsic column density (mostly derived using X-ray hardness ratios) typically in the range between 1022 to few times 1023 cm−2. Their intrinsic 2–10 keV luminosities (in excess to 1043 erg s−1) fall well within the AGN X-ray luminosity range and ∼55 per cent of them can be classified as type 2 quasars, on the basis of their absorption properties and X-ray luminosity. It is also worth noting that, among the EXO50 sources defined here, about 40 per cent can be classified as EDOGs (∼60 per cent excluding the BL Lac objects). Unfortunately, two of our EXO50 EDOGs are still unidentified, preventing us to make a proper comparison with the work of Lanzuisi et al. (2009). We can only say that the absorption properties of the only identified EXO50 EDOG (source number 5) are fully consistent with the main results obtained from Lanzuisi et al. (2009): the source is an absorbed QSO with an intrinsic absorbing column density ∼3 × 1022 cm−2. For the remaining two, the type 2 QSO hypothesis is very likely.
5.6 Are the EXO50 type 2 QSO objects different from standard X-ray-selected type 2 QSO?
Overall, the EXO50 type 2 QSO do not seem to be different from standard X-ray-selected type 2 QSOs in terms of nuclear absorption (in the range of few times 1022 up to 8 × 1023 cm−2), so other factors may play a possible role in explaining their extreme properties.
To investigate how the fx/fo and the optical-to-IR colours change as a function of (a) the intrinsic absorption of the AGN component; (b) the luminosity contrast between the intrinsic AGN and the host galaxy; and (c) the redshift, we have used a very simple toy model to describe the SED of the AGN+host galaxy complex.
As unobscured AGN SED we have used the type 1 QSO UV-to-IR template described in Polletta et al. (2007) adding the X-ray component assuming a fx/fo (as defined in Section 2) ≃1 (typically observed in unabsorbed AGN), while for the host galaxy we have used a Sc galaxy template; similar trends to those discussed below are obtained if we assume a different morphology for the host galaxy template. Full details on the AGN and host SED as well as on the procedure summarized below can be found in Ballo et al. (2014).
The UV-to-IR AGN template is absorbed at the source redshift using the extinction curve of the Galactic Centre (Chiar & Tielens 2006) before summing it up with the galaxy template; the X-ray absorption is tied to the optical obscuration assuming a Galactic gas to dust ratio (NH/Av =1.9 × 1021 cm−2; Bohlin, Savage & Drake 1978). The variables of this simple toy model are thus the redshift, the AGN dust extinction (and consequently the X-ray absorption) and the ratio between the intrinsic AGN emission and the host galaxy emission (normalized for our convenience at ∼4.6 μm, observed frame).
In Fig. 7, we show the expectations of this toy model in the fx/fo versus R − W2 plane at a redshift of 0.6 (solid line) and 1.1 (dashed line, respectively the lower and the upper envelope of the investigated redshift range) for two values of dust extinction (Av = 5.27 and 52.7, corresponding to NH ≃ 1022 and 1023 cm−2, respectively) and for three values of the AGN to host galaxy ratio (10, 20 and 100). In the figure, we have also reported the position of the sources belonging to the QSO W1/2 sample as well as our type 2 QSO EXO50 sources. The big star marks the position where the toy model converges, for all the AGN/host ratios used here, when NH < few times 1020 cm−2. As can be seen, the expected position of the unabsorbed AGN is fully consistent with the data for the type 1 QSO in the comparison sample.
Fig. 7 clearly suggests that several factors may concur in explaining the extreme properties of the EXO50 type 2 QSO. For a fixed absorption or AGN/host ratio, the higher is the redshift, the higher is the fx/fo and the redder are the optical-to-IR colours (cf. Fiore et al. 2003). However from a deeper look to the data, this redshift effect alone is not able to explain the extreme properties of all the EXO50 objects; for example the source number 5 (namely 2XMMJ123204.9+215254 at z = 0.76) cannot be explained with the redshift effect but requires very high AGN/host ratios; a very high AGN/host galaxy ratio indeed may be required also for 2XMMJ100038.9+050955 and 2XMMJ135055.7+642857 (sources 2 and 6, respectively) if their redshifts turn out to be similar to that of 2XMMJ123204.9+215254. For comparison, we note that the eight type 2 QSO with fx/fo in the range between 5 and 15 reported in Fig. 7 belong to the XBS survey and have been studied in detail by Ballo et al. (2014); these sources have an AGN to host galaxy ratio at 4.6 μm (observed frame) between a few and ≃ 20.
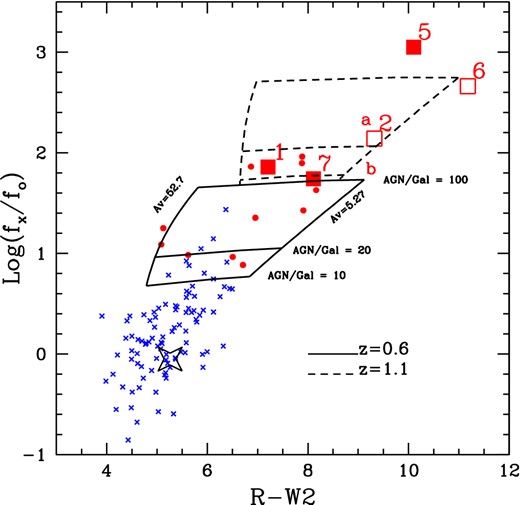
The fx/fo ratio as a function of the optical–IR colour for our EXO50 type 2 QSO objects and for the comparison sample. We also report the expectations from the toy model at z = 0.6 and 1.1 for two values of optical obscuration (Av = 5.27 and 52.7 corresponding to NH ≃ 1022 and 1023 cm−2, respectively) and three values (10, 20, 100) of AGN/host ratio at ∼4.6 μm ; the big star marks the position where the toy model converges for all the AGN/host ratio used here when NH < few times 1020 cm−2 (i.e. at the unabsorbed type 1 view). Symbols and colours are as in Fig. 4. The numbers mark our EXO50 objects as reported in Tables 1 and 3. The labels (a) and (b) mark the position of the objects XBSJ021642.3−043553 (z ∼ 2, source a) and XID2028 (z ∼ 1.6, source b) discussed in Section 5.2. See Section 5.6 for details on the modelling.
A wide range in the intrinsic luminosity ratio between the AGN and the host galaxy could also explain the observed wide range of the W1 − W2 colours in type 1 QSO and type 2 QSO (see Section 5.3), with the AGN component increasing, on average, going from the left (W1 − W2 = 0, corresponding to α ≃ −2) to the right (W1 − W2 = 2, corresponding to α ≃ 4.3) of the abscissa in Fig. 5. Finally, as already discussed in the previous section, the sources with the highest fx/fo are also the sources with extreme optical–IR properties. Therefore, a high AGN/host ratio (along with the large amount of dust absorption) could be a natural explanation to account for the extreme properties for a part of the EDOG population. This also implies that the IR luminosities measured in these objects are mainly due to the AGN component rather than to starburst activity.
5.7 The BL Lacs in the EXO50 sample
Finally, although the statistics of EXO50 objects is very limited, it is worth noting that ∼30 per cent of the EXO50 sources in the bright flux regime explored by our survey is represented by BL Lac objects. At the 2–10 keV flux limit of ∼1.5 × 10⁻¹³ erg cm−2 s−1, the derived surface density is ∼3 × 10⁻² deg−2. This surface density is a lower limit to the real surface density of BL Lac objects, since we are considering here only the BL Lacs with fx/fo > 50, and corresponds to a fraction between ∼8 and ∼30 per cent of the density of X-ray-selected BL Lacs at similar fluxes (the exact fraction depending on their cosmological evolution properties; e.g. Wolter et al. 1991). Their position in the several plots discussed here deviates significantly from the rest of the sample. The very high fx/fo selection used here allows us to pick up the most extreme BL Lacs (HBL type) in the αOX–αRX plane (see also Costamante et al. 2001). This is clearly evident in Fig. 8, where we show the αOX−αRX plane for the BL Lacs objects in the BZCAT catalogue (Massaro et al. 2009) with the position of the two EXO50 sources identified as BL Lacs overlaid; only less than 1 per cent of the BL Lacs discovered so far have broad-band spectral indices as extreme as the ones discovered here using the fx/fo > 50 selection.

The αOX–αRX plane for the BL Lacs objects in the BZCAT catalogue (black open circle) and for the two EXO50 sources (open-crosses-green symbols) spectroscopically identified as BL Lacs reported in this paper.
BL Lac objects are sources emitting non-thermal radiation across the entire electromagnetic spectrum from a relativistic jet that is viewed closely along the line of sight, thus causing strong relativistic amplification (e.g. Urry & Padovani 1995). Their SED is characterized by two broad peaks, now almost commonly interpreted as due to synchrotron and inverse Compton radiation. In this respect, the BL Lac objects reported here should have the synchrotron peak emission around 0.1 keV (see fig. 1 in Costamante et al. 2001), indicating the presence of high energy electrons: these extreme BL Lacs are good candidates for TeV emission that, if detected at these redshifts, could provide important constraints both on the physical process at work in such sources, and on the intensity and spectrum of the diffuse extragalactic background light (see e.g. Costamante 2013). Presently (end of July 2014), there are about 50 blazars detected at TeV energies.10 Two out of the six detected blazars at z > 0.3 are HBL (with z = 0.34 and >0.6) like the ones discussed here; the X-ray and radio fluxes of these two high-z TeV detected HBL are comparable with the fluxes of our sources and, therefore, we expect that these objects are potentially detectable at TeV energies even with the facilities currently available.
6 SUMMARY AND CONCLUSIONS
Obscured QSOs are expected to display large values of X-ray-to-optical flux ratio, fx/fo where fx refers to the observed 2–10 keV flux (corrected for Galactic absorption) and fo is the optical flux derived from the R magnitude. In this paper, we have defined a small, but statistically complete and representative sample of seven point-like X-ray sources characterized by an extreme X-ray-to-optical flux ratio, fx/fo{>50 (i.e more than 15 times the average values of unobscured broad-line and soft X-ray-selected AGN), and with fx > 1.5 × 10⁻¹³ erg cm−2 s−1. The sky coverage investigated to find out these seven objects is about 60.4 deg2, implying a density of ∼1.2 EXO50 sources/deg2 at the sampled fluxes. We have spectroscopically identified (using the GTC data as well data from the literature) five EXO50 objects; two sources remain still unidentified, although the data at other wavelengths discussed here strongly suggest an obscured QSO nature.
We have discussed in detail the broad-band properties of each EXO50 source in our sample, and we have compared them with those of a comparison sample of X-ray-selected AGN/QSO from the literature.
The main results of this investigation are the following:
about 70 per cent of the EXO50 sources in the bright flux regime explored by our survey are associated with obscured AGN (NH > 1022 cm−2), spanning a redshift range between 0.75 and 1 and characterized by 2–10 keV intrinsic luminosities in the QSO regime (e.g. well in excess to 1044 erg s−1). This result confirms the suggestion that the fx/fo ratio can be used as a proxy of obscuring material and it is a very efficient tool for the selection of obscured QSOs (see also Lanzuisi et al. 2013). If compared with other samples of type 1 and type 2 QSO, the EXO50- type 2 QSO objects are amongst the most extreme sources in the several optical–IR diagrams investigated. Overall, the EXO50 type 2 QSO do not seem to be different from standard X-ray-selected type 2 QSOs in terms of nuclear absorption; a very high AGN/host galaxy ratio seems to play a major role in explaining their extreme properties. Interestingly, three out of five EXO50 type 2 QSO objects can be classified as EDOGs (f24 μm/fR ≥ 2000), a source population that may play an important role in the formation of the most massive galaxies in the local Universe. Similarly to what we have found for the EXO50 type 2 QSOs, we suggest that a very high AGN/host ratios (along with the large amount of dust absorption) could be the natural explanation for the observed properties for part of the EDOG population. Two recent papers (Perna et al. 2014; Brusa et al. 2015) find the presence of massive outflows in objects similar to the ones discussed here. Unfortunately, the optical spectra presented in this paper does not have the quality required to study in any detail the presence of outflows; an approved LBT programme on this topic is ongoing;
the remaining EXO50 sources are represented by BL Lac objects. Interestingly, the very high fx/fo selection used here allows us to pick up rather extreme BL Lacs, which are good candidates for TeV emission. If detected, they could provide important constraints both on the physical process at work, and on the intensity and spectrum of the diffuse extragalactic background light.
This research has made use of data obtained from the XMM–Newton satellite and data obtained from the High Energy Astrophysics Science Archive Research Center (HEASARC), provided by NASA's Goddard Space Flight Center. We acknowledge partial financial support from ASI grants (no. I/023/05/0, n. I/088/06/ and I/037/12/0) and from the Italian Ministry of Education, Universities and Research (PRIN2010-2011, grant no. 2010NHBSBE). The research leading to these results has received funding from the European Commission Seventh Framework Programme (FP7/2007-2013) under grant agreement no. 267251 ‘Astronomy Fellowships in Italy’ (AstroFIt). SM and FJC acknowledge financial support by the Spanish Ministry of Economy and Competitiveness through grants AYA2010-21490-C02-01 and AYA2012-31447 and from the ARCHES project, funded by the 7th Framework of the European Union (project no. 313146). AR acknowledges financial support by the Spanish Ministry of Economy and Competitiveness through grant AYA2012-31447. Based on data from the WISE, which is a joint project of the University of California, Los Angeles, and the Jet Propulsion Laboratory/California Institute of Technology, funded by the National Aeronautics and Space Administration. Funding for the SDSS and SDSS-II has been provided by the Alfred P. Sloan Foundation, the Participating Institutions, the National Science Foundation, the US Department of Energy, the National Aeronautics and Space Administration, the Japanese Monbukagakusho, the Max Planck Society and the Higher Education Funding Council for England. The SDSS Web Site is http://www.sdss.org/. Based on observations made with the Telescopio Nazionale Galileo – operated by the Centro Galileo Galilei- and the Gran Telescopio de Canarias installed in the Spanish Observatorio del Roque de los Muchachos of the Instituto de Astrofisica de Canarias, in the island of La Palma (Spain). We thank the anonymous referee for useful comments that have improved the quality of the paper.
At the chosen X-ray flux limit of fx ∼ 10−13 erg cm−2 s−1, a source with fx/fo ∼ 50 (300) has an optical R magnitude of ∼23 (∼25).
We use here the public available All-Sky Data Release that covers >99 per cent of the sky (2012 March release; see http://wise2.ipac.caltech.edu/docs/release/allsky/).
|$\alpha _{{\rm RX}} = -{{\rm log}(f_{5\,\mathrm{GHz}}/f_{2\,\mathrm{keV}}) \over 7.68}$|; |$\alpha _{{\rm OX}} = -{{\rm log}(f_{2\,\mathrm{keV}}/f_{2500\,{{\rm A}\!\!\!\!\!^{^\circ}}}) \over 2.605}$|; |$\alpha _{{\rm RO}} = -{{\rm l og}(f_{5\,\mathrm{GHz}}/f_{2500\,{{\rm A}\!\!\!\!\!^{^\circ}}}) \over 5.38}$| where f5 GHz, f2 keV and f2500 Å are the K-corrected fluxes at 5 GHz, 2 keV and 2500 Å, respectively.
These two sources, classified as broad-line AGN, are CL0016_3 (z = 1.09) from the XMS survey and XMMC_150.13303+2.30324 (z = 1.6) from the COSMOS survey.
This correspondence has been derived from the analysis (not reported here) of the sources in the COSMOS survey where we have both R, K and W1 magnitudes.
We note that both objects from the literature discussed in the previous section are EROs (R − K ≥ 5 for XBS J021642.3−043553 and R − K = 6.46 for XMMC_150.54703+1.61869).
An inadequate X-ray coverage is probably the cause of the non-detection of the remaining ones.
