


Abstract
We present a free-form mass reconstruction of the massive lensing cluster MACS J0416.1−2403 using the latest Hubble Frontier Fields data. Our free-form method finds that the extended lensing pattern is generated by two elongated, closely projected clusters of similar mass. Our lens model identifies new lensed images with which we improve the accuracy of the dark matter distribution. We find that the bimodal mass distribution is nearly coincident with the bimodal X-ray emission, but with the two dark matter peaks lying closer together than the centroids of the X-ray emission. We can reproduce this behaviour with our hydrodynamical model, concluding that the clusters are significantly deflected around each other with the plane of the collision lying close to the line of sight. The projected mass profiles of both subclusters are well constrained in the region 30–165 kpc because of the many interior lensed images, leading to surprisingly flat mass profiles of both components at distances 30–100 kpc from the centre, in agreement with recent simulations of self-interacting dark matter. Using N-body simulations, we discuss the extent to which this may be generated by projection effects in our model as the cores graze each other. The relative velocity between the two cores is estimated to be about 1200 km s−1 and mostly along the line of sight so that our simulation is consistent with the relative redshift difference between the two cD galaxies (δz ≈ 0.04).
1 INTRODUCTION
Strong gravitational lensing is entering a new era of enhanced precision with the arrival of the new Hubble data from the Cluster Lensing And Supernova survey with Hubble (CLASH; Postman et al. 2012a) and now from the Hubble Frontier Fields1 (HFF) programs. Clusters observed under these programs routinely contain tens of multiply lensed systems with well-defined colours to help identify counterimages. The most massive clusters with the largest quantity of strong lensing information are often the most complex with highly convoluted critical curves and disturbed gas indicating ongoing high-speed encounters between massive substructures (Zitrin et al. 2011a; Menanteau et al. 2012; Molnar & Broadhurst 2014). Modelling such complexity is a challenge for conventional parametric models with choices that need to be made when representing, for example, the centroids of substructures with multiple idealized halo components (Kneib et al. 1996; Sharon et al. 2005; Halkola, Seitz & Pannella 2006; Limousin et al. 2007; Nakajima & Morikawa 2007; Nieuwenhuizen & Morandi 2013)
Attempts to generalize lens modelling in this context have been possible in terms of smooth grids or low-order polynomials to permit some flexibility. Previously, we have explored this problem in two ways, with application to the benchmark Hubble data for A1689. First, by a compromise semiparametric method assuming mass approximately traces light (Broadhurst et al. 2005) with an expansion of the potential to third order to model the shape of the cluster mass component. This has been successful in achieving sufficient precision to locate many sets of multiple images and has been developed further for the CLASH data (Zitrin et al. 2011b, 2012, 2013) but still does not allow for the possibility that the dynamics of the dark matter (DM) may differ significantly from that of the member galaxies during cluster collisions. A more general free-form approach was developed by Diego et al. (2005a,b, 2007), based on a pixelated grid representing the lens plane so that arbitrary mass distributions can be constructed up to the resolution of the grid scale which is effectively set by the surface density of strongly lensed images. This method does not provide sufficient accuracy to find new systems so that it must rely on lensed systems secured by other models. More recently we have found it very advantageous to incorporate the known position of member galaxies in the grid solution, to account for the local deflections and additional multiple images typically produced by member galaxies, so that meaningful solutions can be found (Sendra et al. 2014; Diego et al. 2015). Here we employ this method to model the complex merging cluster MACS J0416.1−2403 (hereafter MACS J0416), relying on previously known and our own multiply lensed image identifications.
In parallel, image identification has benefited from a better understanding of the optimization of colour information for redshift estimation. By utilizing overlapping broad-bands of the CLASH program covering the ultraviolet (UV) to the near-infrared (NIR), we can maximize the photometric redshift accuracy possible with Hubble and have provided reliable examples of the most distant galaxies known, as in the case of the z ≃ 11 candidate lensed by MACS 0647 (Coe et al. 2013), where multiple images are identified both photometrically and geometrically. Improving on the CLASH program, the current HFF program is destined to leave a legacy of exquisite lensing data for a sample of the largest cluster lenses known. The greater depth attained by the HFF program promises a wealth of faint multiply lensed galaxies for a higher resolution mapping, as the first data examples have begun to reveal (Atek et al. 2014; Jauzac et al. 2014; Johnson et al. 2014; Lam et al. 2014; Richard et al. 2014; Zheng et al. 2014).
The cluster A2744 was the first cluster completed within the HFF program. More recently, new data from the HFF have been acquired for the cluster MACS J0416, a massive merging galaxy cluster at redshift z = 0.4. A first analysis based on CLASH data on MACS J0416 was performed by Zitrin et al. (2013, hereafter Z13). In that paper the authors identified 70 multiple images from 23 background galaxies. The strong lensing analysis of Z13 reveals a very elongated structure for the DM distribution. In a recent paper, Jauzac et al. (2014, hereafter J14), published a parametric analysis that extends the number of candidate systems to more than 50. Also in two additional very recent papers, six of the HFF clusters are studied using strong lensing (Johnson et al. 2014), or a joint strong–weak lensing analysis (Richard et al. 2014). Among these clusters, the cluster MACS J0416 is also included. A detailed comparison of our results with those derived using parametric methods is beyond the scope of this paper and will be considered in a future paper.
Colliding clusters are of special interest for their potential to examine the nature of DM through the dynamics of DM and the hydrodynamics of colliding hot gas (Springel & Farrar 2007; Mastropietro & Burkert 2008). In particular, colliding clusters have been used to set stringent limits on the scattering cross-section of DM, see Markevitch et al. (2004) and also Kahlhoefer et al. (2014) for a recent discussion. Some of the properties of DM can be tested if offsets are observed between the peaks of the DM and baryonic components. In Kahlhoefer et al. (2014) the authors conclude that small separations between the DM and the luminous galaxies are only possible right after the collision but not for more relaxed systems. If MACS J0416 is in the turnaround phase, as suggested in Mann & Ebeling (2012), we should not expect a separation between the DM and the galaxies for values of the DM cross-section σ/m ∼ 1 cm2 g−1 or less. In the case of self-interacting DM, de Laix, Scherrer & Schaefer (1995) and Spergel & Steinhardt (2000) aim to explain a claimed flattening of cluster core density profiles. In addition, Rocha et al. (2013) study simulations of self-interacting DM showing that it is possible to derive constraints on the DM self-interaction cross-section from the fact that such systems have survived the collision.
In a paper based on X-ray and optical data, Mann & Ebeling (2012) classify by eye MACS J0416 as an example of a post-collision merger and they add that the cluster could be even in the phase after turnaround. However, due to relatively poor X-ray data, the pre-collision scenario cannot be ruled out. Deeper X-ray observations could reveal more definitively whether a merger is ongoing if the temperature is observed to be enhanced between the two subclusters (Ricker & Sarazin 2001; Molnar et al. 2013). Chandra data reveal an offset between the peaks in the X-ray emissivity and the cD galaxies (Mann & Ebeling 2012), which is consistent with the post-merger scenario (see also Fig. 1). The fact that one of the X-ray peaks is ahead of one the two main cD galaxies would be consistent with the turnaround scenario or a projection effect.
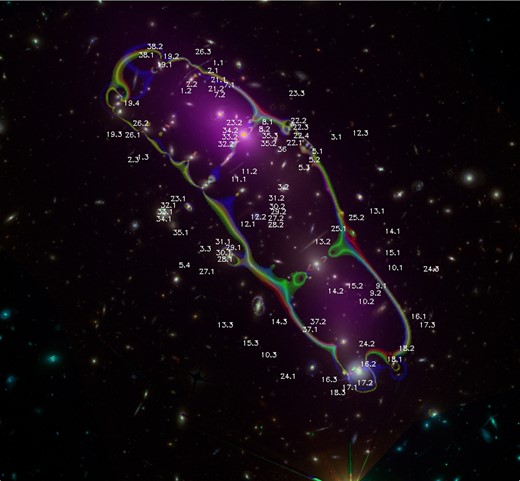
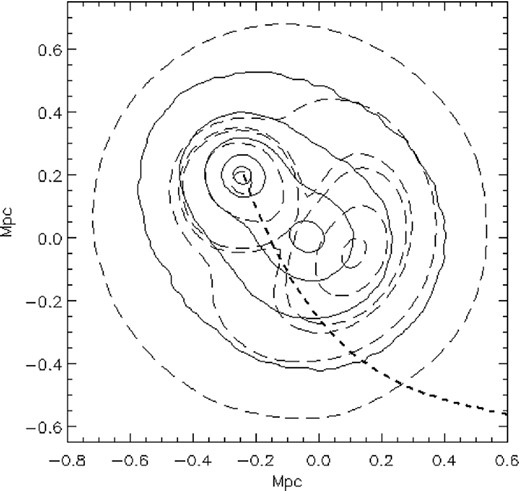
Relative position of the systems used in the reconstruction. The critical curve (zs = 3) corresponds to the three cases described in Section 4.1. These cases represent three different solutions where the assumptions about the member galaxies are varied. Red, green and blue colours are for cases (i), (ii) and (iii), respectively. Cases (i) and (ii) are nearly indistinguishable in terms of their critical curves. The two blue purple regions correspond to the peaks of the X-ray emission from Chandra. The field of view is 2.4 arcmin and north is up.
In this paper we introduce the HFF imaging data in Section 2. We examine the data for multiple images in Section 3 and describe the method we use for the free-form modelling in Section 4. In Section 5 we analyse the DM distribution derived. In Section 7 we compare the DM distribution with the distribution of the gas via a hydrodynamical model we have constructed for this purpose. In Section 8 we measure the core mass profiles of the two main lensing mass components, and presenting our conclusions in Section 9.
Throughout the paper we assume a cosmological model with ΩM = 0.3, Λ = 0.7, h = h100 = 100 km s−1 Mpc−1. For this model, 1 arcsec equals 3.87 kpc/h100 at the distance of the cluster.
2 HFF DATA
In this paper we used public imaging data obtained from the Advanced Camera for Surveys (ACS; filters: F450W, F606W and F814W) and the Wide Field Camera 3 (WFC3; filters: F105W, F125W, F140W and F160W), retrieved from the Mikulski Archive for Space Telescope (MAST). Some of these bands were not available at the time when the analysis of Z13 was made. The new colour bands are useful to identify systems that match (or do not match) in colour but also to go deeper in magnitude. New observations on this cluster are planned for the near future in the optical bands. The data used in this paper consist of 50 per cent of the data that will be available in the near future. The data was compiled after combining data from several programs with the following PI, M. Postman (proposal ID 12459), J. Lotz (proposal ID 13496) and S. Rodney (proposal ID 13386).
We combined all the filters into three colour bands to produce the colour image of the new candidate systems shown in Appendix A. The image was processed in Fourier space to reduce the contribution of large angular scale modes due to diffuse light from the member galaxies and later combined to produce a colour image. The Fourier filtering introduces artificial changes in the brightness of sources around bright sources (galaxies and stars). The different angular resolutions of the optical and infrared (IR) bands introduce also an element of uncertainty when processing the images in Fourier space so images that fall near bright sources may have their colours slightly distorted. We have checked that the colours of our candidates agree in the original colour image (that does not include the filtering in Fourier space).
3 LENSING DATA
Our strong lensing data set is primary based on the system identification of Z13. Some of the photometric redshifts in that work have been updated with the recently published ones in J14 (that appeared at the time when we where finalizing this paper). Although the compilation of J14 supersedes the systems published in Z13, we rely on the early identification of Z13 and leave for a different paper the analysis based on the systems of J14 (some of which are more reliable than others). In that work, the authors extend the original set of 23 systems in Z13 to over 50 candidate systems. A proper comparison of our results and theirs will be published in a separate paper and once the full HFF data set is available. However, in Section 6 we make a small comparison in one of the new systems that is common to both data sets. Despite the fact that the system used in our work and theirs is different, a simple consistency test shows a high degree of agreement between our solution and theirs.
Our strong lensing data set is listed in Table A1 in Appendix A. Systems 1–23 are taken directly from Z13 and systems 24–38 are new candidates identified in this work. Systems 6 and 20 in Z13 are dubious and have been removed after colour comparison with the new addition of the IR data from the HFF program. Some of the counterimages in Z13 have deliberately not being used in this work as the proximity of multiple candidates makes it difficult to secure the identification. However, we should note that most of these counterimages are in general in good agreement with our lens model so their inclusion in our analysis should have a small impact in the reconstructed mass. A few of the arclets in Z13 have been rematched, in particular 12.3 (we use a different candidate from Z13 at one of their predicted positions), 15.3, 19.4 and 22.4. The new selection of systems is based on a combination of colour matching (after including the new data from the HFF program) and comparison with a lens model. The lens model used for this comparison is obtained after using the 23 original systems of Z13 and our free-form algorithm. The lens model allows us also to identify new system candidates in the new optical+IR data by predicting the positions where counterimages are expected (for a given redshift) and also by predicting the right orientation and morphology of the lensed images. A few examples showing relensed images involving systems 2 and 3 are shown in Appendix in Fig. A7. The relensed image of the special new system 35 is shown (and discussed) also in Section 6.
Stamps from the complete data set in Table A1 are also shown in Appendix A as well as in this website.2 The relative positions of the images defining our lensing data set are shown in Fig. 1. Fig. 1 shows the data set together with the critical curves derived in this work (see Section 4.1). In purple colour, we also show an adaptively smoothed version of the X-ray emission from Chandra data3 for reference. The Chandra data have been smoothed using the code ASMOOTH (Ebeling, White & Rangarajan 2006).
4 RECONSTRUCTION METHOD
We use the improved method, wslap+, to perform the mass reconstruction. The reader can find the details of the method in our previous papers (Diego et al. 2005a,b, 2007, 2015; Ponente & Diego 2011; Lam et al. 2014; Sendra et al. 2014). Here we give a brief summary of the most essential elements.
4.1 Fiducial galaxies
The member galaxies defining the fiducial field are all elliptical galaxies selected from the red sequence plus two very luminous (and possibly massive) spiral galaxies that lay near the critical curves. The selected galaxies are shown in Fig. 3. In the reconstruction, we need to assume some masses for the fiducial field (cluster members). We explore three different alternatives.
The light of the galaxies traces their mass (LTM). We select the member galaxies from the red sequence and make their masses proportional to the optical flux in the F814w band. That is, no analytic profile is assumed for these galaxies. The mass distribution is assumed to be proportional to the light distribution in the F814w band. The total mass of the galaxy field is then normalized to have 7.0 × 10¹³ M⊙/h. In this case there is only on parameter, C1, in the vector |$\boldsymbol {X}$| that rescales the entire fiducial field.
Like the above but the two main cD galaxies have now their own parameter C, hence we have three parameters C1 for the non-cD galaxies, C2 for the north-east (NE) cD galaxy and C3 for the SW galaxy. The solution for this particular case can be downloaded from this website4 together with an idl code to visualize the model and the systems used in this work.
Instead of assuming that the mass follows the light, we associate a circularly symmetric Navarro–Frenk–White (NFW) profile to each galaxy (Navarro, Frenk & White 1997). The masses take different values than the ones in cases (i) and (ii) and also we use three fiducial fields like in case (ii).
The fiducial masses for these three cases are shown more explicitly in Fig. 3.
5 DARK MATTER DISTRIBUTION
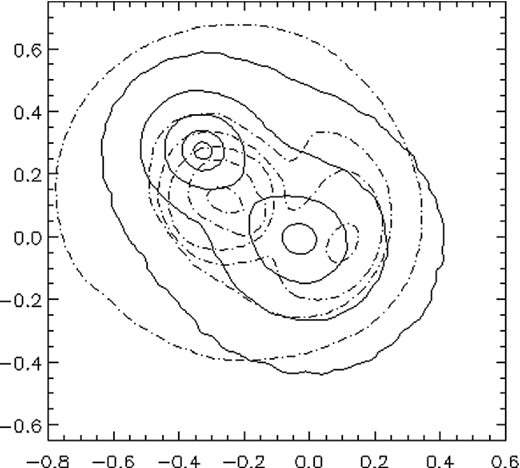
The mass reconstruction is shown in Fig. 2 for the three cases discussed in Section 4.1. The field of view has been rotated by 45° (counterclockwise) so the NE cluster is now at the left and the south-west (SW) cluster is now to the right. Projections along the main axes in the cluster are shown in the left-hand and bottom panels for each case.
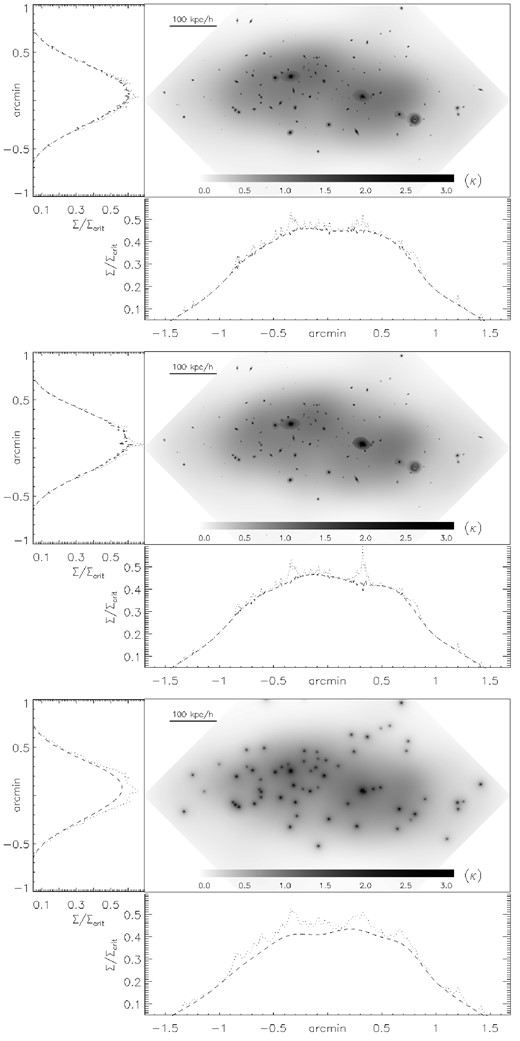
Reconstructed mass in MACS J0416 in units of its convergence (for zs = 3). Two-dimensional convergence (κ) map and the mean value of the projected convergence along the y- and x-axis, respectively. The two curves correspond to the total mass (dotted) and to the grid-only mass (dashed). The convergence maps have been saturated beyond k = 3 for clarity purposes. The top panel is for case (i) described in Section 4.1. The middle panel is for case (ii). The bottom panel is for case (iii).
A striking result is the relatively high symmetry between both subclusters suggesting a mass ratio of 1:1 for this merger. From the morphological point of view, both subclusters seem to have similar masses and morphologies when projected in the two orthogonal directions. The extended soft DM halo is divided in two subhaloes, each associated with one of the two cD galaxies in the cluster. These subhaloes do not show a peculiar symmetry, in particular there is no clear evidence for the elliptical spheroids assumed in parametric methods but rather the soft DM halo shows a rather irregular shape. When comparing the three reconstructions, we find that the assumptions made on the fiducial field play a secondary but not entirely negligible role. Comparing cases (i) and (ii), the solution seems to prefer the two main cD galaxies having larger mass associated with their haloes. The same result is observed when all the haloes are assumed to follow a (symmetric) NFW profile as seen in case (iii). It can be also observed that when the galaxies take more mass this is at the expense of the mass in the grid component, maintaining the total mass more or less constant. This type of degeneracy is expected in this particular cluster due to the relatively small number of radial arcs that fall close to the main cD galaxies. The mass distribution around these galaxies remains then relatively unconstrained.
Fig. 3 shows the contours of the soft component (grid only) superimposed on the fiducial galaxies for the three cases described in Section 4.1. The three cases reproduce almost identical results around the position of the critical curves. However, small differences can be appreciated in the central region with the models showing some dependency with the assumptions made about the central cD. Interestingly, a shift can be appreciated between the position of the cD galaxies and the peak of the diffuse component in all three cases. The shift is more pronounced when the two cD galaxies are unlocked from the remaining galaxies, case (ii). When the two cD galaxies are locked to the other galaxies, case (i), the grid takes on the possible missing mass around these two galaxies shifting the peak of the diffuse mass closer to the position of the galaxies. This is made more evident in Fig. 2 above, where in case (ii) we appreciate a higher contribution from the main cD to the cluster mass than in case (i). In case (iii) we observe a smaller shift between the peaks of the soft DM haloes and the two main galaxies. In this case, the more extended nature of the fiducial galaxies reduces the relative importance of the grid as the superposition of the extended haloes in the fiducial galaxies can reproduce some of the soft features that otherwise would be reproduced by the grid. Case (iii) can be considered as a case where the galaxies compete more with the grid than in cases (i) or (ii) or more mathematically, the base defined by the grid+galaxies is less orthogonal than the other two cases. When comparing the soft DM component with the X-ray emission, there are small offsets between the two components but these offsets depend on the assumptions made for the fiducial galaxies. Also, the peak in the X-ray emission is not well defined and depends on the resolution at which the X-rays are smoothed. Deeper X-ray observations are needed to better constrain the position of the X-ray peaks.
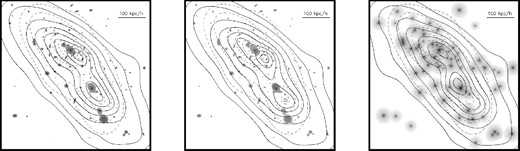
Contours of the reconstructed mass of the grid component compared with the fiducial galaxy field. From left to right, cases (i), (ii) and (iii), respectively, and described in Section 4.1. In all cases, the contours correspond to 0.1, 0.2, 0.4, 0.6, 0.75, 0.85, 0.93 and 0.98 times the maximum of the soft component. In all panels, the dashed contours show the smoothed X-ray emission from Chandra. North is up.
The fact that the DM peak from the soft DM halo (grid) may be shifted with respect to the position of the cD galaxies is an interesting feature. The largest offset between the soft DM component and the cD galaxies is observed in case (ii) and corresponds to ≈60 kpc in the south DM peak. Since the galaxies can be truly considered as collisionless, the DM could have its peak shifted with respect to the main galaxies if they have a significant cross-section per unit mass, σ/m. This case has been recently studied by Kahlhoefer et al. (2014) where they consider a value of σ/m ≈ 1 cm2 g−1. They find that small shifts (10–30 kpc) are expected only immediately after the collision between the two clusters. In Randall et al. (2008) similar shifts between the DM and the galaxies are observed in simulations with self-interacting DM particles. However, current limits on the cross-section of DM per unit mass (σ/m < 1 cm2 g−1; Markevitch et al. 2004) imply that the shifts should be smaller than 30 kpc (see fig. 5 in Randall et al. 2008 which is valid if the cross-section is independent of velocity). The apparent large offset observed in our solution in the south DM peak and the fact that the DM peak shifts position in relation to the neighbour cD galaxy in case (iii) suggests that the position of the DM peak in the south may not be sufficiently constrained. On the other hand, the north DM peak shows a more reasonable offset, 15–30 kpc, that appears also in the same side of the neighbour cD for the three solutions presented in Fig. 3. This picture is consistent with the presence of more radial images around the north cD galaxy that, hence, should be constrained better than the south peak. If the offset in the north peak is real, from fig. 5 in Randall et al. (2008) it would imply a DM self-interaction cross-section of σ/m ≈ 0.5–0.7 cm2 g−1. Regarding the elongated shape of the DM halo, Kahlhoefer et al. (2014) find that the baryonic and the DM particles exhibit different profiles with the galaxies showing a tail moving ahead (in the direction of the movement of the halo) of the DM halo and the DM showing a more elongated tail in the opposite direction of the movement. The contours in Fig. 3 show a clear elongation of the DM haloes in the axis of the merger. Interestingly, the halo in the SW shows a more pronounced elongation. This picture is consistent with the situation discussed in Kahlhoefer et al. (2014) if a non-negligible value for σ/m ≈ 1.5 h−1 cm2 g−1 is assumed. Another possibility is that the elongation may be due to our reconstructed mass distribution being also sensitive to the projected mass of the plasma. If the plasma is displaced with respect to the DM, this could produce an elongation in the projected mass distribution in the direction of the displacement. This possibility will be discussed in more detail in Section 7. The fact that the elongation traces the shape of the maxima of the X-ray contours suggests that this scenario is possible. In Lam et al. (2014), a similar excess of mass not directly linked to the observed galaxies is also found in a region with significant X-ray emission.
Regarding the masses contained in the galactic component, for case (i), the derived total mass of the fiducial galaxies is 8.21 × 10¹² M⊙ h−1. For case (ii), the derived masses of the two main cD galaxies are 1.13 × 10¹² M⊙ h−1 for the NE cD galaxy and 1.95 × 10¹² M⊙ h−1 for the SW cD galaxy. The combined total mass of the remaining fiducial galaxies equals 5.36 × 10¹² M⊙ h−1. For case (iii), the derived masses of the two main cD galaxies are 1.41 × 10¹² M⊙ h−1 for the NE cD galaxy and 1.34 × 10¹² M⊙ h−1 for the SW cD galaxy. The combined total mass of the remaining fiducial galaxies equals 2.08 × 10¹³ M⊙ h−1. The higher galaxy masses in case (iii) can be attributed to their larger angular size that takes away some of the mass from the grid component.
In order to get an estimate of the integrated mass as a function of radius, and given the high asymmetry of this cluster, we integrate the masses following the contours of the cluster. Using the contours (similar to the ones shown in Fig. 3) we can define an effective radius, |$R_{\rm eff}= \sqrt{A/\pi }$|, where A is the area enclosed by a given contour. By setting different thresholds in the projected mass maps we can build a set of contours, each with a given enclosed area, A, and Reff. The integrated mass is shown in Fig. 4 as a function of Reff. The mass in the y-axis corresponds to the combined total mass of the two subclusters above a given threshold (with an associated radius, Reff). In Fig. 4 we also show a power law, M( < Reff) = 10−4(Reff/h−1 kpc)2 M⊙ h−1 that fits nicely the integrated mass in the regime 5–50 kpc h−1. A mass growing as the square of the radius is expected for a surface mass density that is constant with radius. The nearly flat behaviour of the surface mass density in the region 5–50 kpc h−1 is made more evident when we compute the radial profiles of each subcluster after masking the other one out.
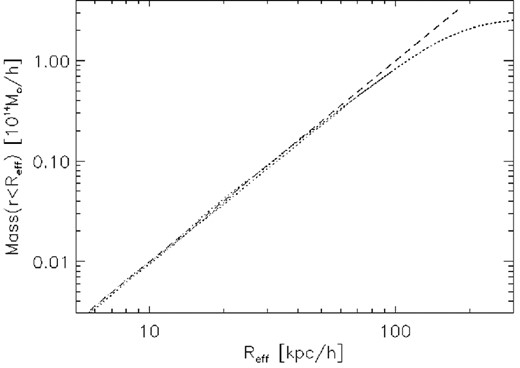
The dotted line corresponds to the integrated mass as a function of effective radius (see text). The dashed line is a power law, |$M \propto R_{{\rm eff}}^2$|.
Fig. 5 shows the circularly averaged profiles for each subcluster in the three cases discussed above. The profiles are centred in the corresponding cD galaxy. The dotted line is for the NE cluster and the dashed line is for the SW cluster. The profiles for each subcluster are computed after excluding the other one from the calculation. The division between the two clusters (and the mask) is defined by a straight line going between the bottom left-hand corner to the top right-hand corner of Fig. 3. The profile is computed in units of the critical surface mass density assuming a redshift of zs = 3. The two profiles are almost identical, both in their amplitudes as well as in their slopes with the exception of the very central region where the cD profile dominates. The profiles beyond 30 arcsec (115 kpc h−1) show a sharp decline. Part of this decline is due to the fact that the profile is an average of an elongated surface mass density distribution. Beyond 30 arcsec, the profiles behave very differently in the two orthogonal directions as shown in Fig. 2. Hence, we should expect the profile to retain some of the features in the x and y projected profiles in Fig. 2. However, it is important to emphasize that the profiles in Fig. 5 are derived for each subcluster while masking the other one so the highly asymmetric distribution of the double cluster is somewhat attenuated. Another reason for the decline of the profile at large radii is the lack of constraints. As shown in our earlier works, our algorithm underestimates the real DM distribution when going into the outer radii where there is no strong lensing constraints (see Diego et al. 2005a; Sendra et al. 2014 for a discussion of this effect based on simulated data). On the other extreme, the inner part of the profiles depends on the assumptions made in the profiles of the fiducial field for the member galaxies and it is affected by uncertainties on these profiles. The lack of constraints in the very central region limits also the accuracy at which this part of the profile can be estimated. This is made evident by the larger variability of the three solutions of the profile in the central region. However, the mass distribution in the range 5–30 arcsec (20–115 kpc h−1) can be trusted. The mass profiles in this range show little dependency with the assumptions made on the fiducial field. A similar trustworthy region was studied in more detail in Sendra et al. (2014) using simulations. In that paper we found that both, the very central and tail, regions of the profile showed systematic biases with respect to the input model while at intermediate radii the reconstructed profile reproduced with accuracy the input model. In Fig. 5 we also plot as a reference the projected surface mass density (in terms of the same critical surface mass density) of a NFW profile. A simple NFW profile cannot fit the mass distribution of each subhalo. Modifications of the NFW profile, like a cored NFW profile, are needed to produce a better fit.
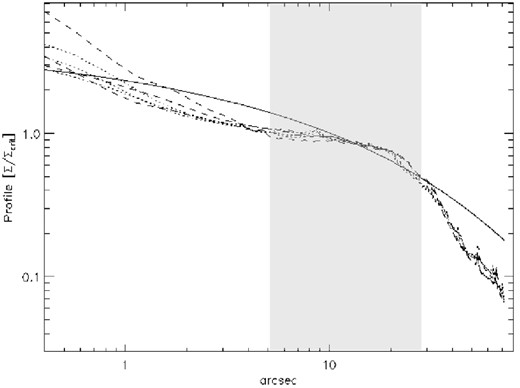
Profiles of the two cluster haloes for the three different cases. The profiles are centred in the two main cD galaxies. The NE halo corresponds to the dotted lines and the SW halo corresponds to the dashed lines. In the computation of the profiles, we have masked the other half of the cluster. The solid line corresponds to a projected NFW model with a truncation radius of R200 = 2.5 Mpc h−1 and C = 10. The shaded region marks the regime that is effectively constrained by the lensing data.
The precision of the solution can be quantified by comparing the positions of the observed arcs with the positions predicted by the lens model. In Fig. 6 we show a histogram of the difference between predicted and observed positions for case (ii). The other cases produce similar results. This graph can be compared directly with fig. 19 in Grillo et al. (2014). In that paper, and for the same cluster, it is presented the results for three different parametric methods. Our results show a larger difference but this does not necessarily mean a poorer reconstruction. As discussed in Diego et al. (2005a,b, 2015) and Sendra et al. (2014) and in more detail in Ponente & Diego (2011),5 reproducing the position of the observed arcs with high precision leads necessarily to biased mass reconstructions at least in our free-form reconstruction method. The larger error in our reconstructed positions is a direct consequence of our requirement of not reproducing exactly the observed positions. A free-form solution with errors comparable to those presented in Grillo et al. (2014) is possible but that solution is expected to be more biased with respect to the true (but unknown) underlying mass distribution. Whether a similar bias is present in parametric methods is an open question.
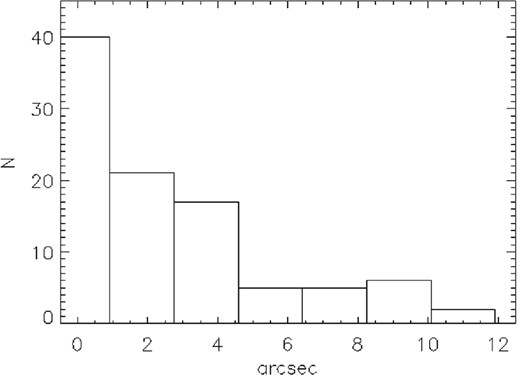
Difference between predicted and observed central position for the arcs used in our reconstruction. This difference corresponds to case (ii). The other cases produce similar results.
Because of the error that needs to be allowed in the solution in order to avoid biased solutions, it is difficult to determine which one of the three solutions presented above is the best one. If the DM around galaxies are more extended like in case (iii) then we should expect case (iii) to be better, if on the contrary the DM traces light in a tight way like in cases (i) and (ii) then these solutions would be better than case (iii). In terms of reproducing the observed data set the three solutions are more or less equivalent.
6 THE CURIOUS CASE OF SYSTEM 35
In this section we explore in more detail the new system 35. Despite being a relatively bright system with distinctive features, it was not matched in the previous work of Z13. The reason maybe the fact that there are two possible images that could be the predicted third counterimage of this system. Usually, these kind of ambiguity are found in systems that exhibit none or few morphological features, are unresolved or too faint. However, system 35 shows a relatively complex morphological and colour-rich structure that should, in principle, make it relatively easy to identify its counterimage(s). This new system is also interesting because the two central counterimages are very close to the northern cD galaxy and they are sensitive to the density profile in the innermost part of the cluster. Images 35.2 and 35.3 are challenging to reproduce by lens models due to the fact that they are merging into a single image (or splitting from one single image) and hence are very sensitive to the small fluctuations in the gravitational potential at the centre but at the same time this offers a good opportunity to study in detail the potential surrounding the northern cD galaxy. In Fig. 7 we show the two possibilities for system 35, option A at redshift zs ≈ 1.65 and option B at redshift zs ≈ 1.05 (these redshifts are estimated from the lens model). The same plot shows also the predicted lensed images based on the two possibilities for the third counterimage. Both options reproduce the position, orientation and some of the colour and morphological features of the observed images. The apparent size of the relensed image is better reproduced in the option B. On the other hand, option A contains a very compact nucleus that is more consistent with the observed double nucleus in 35.2 and 35.3 while the nucleus appears more blurred in option B. Based on the presence of the nucleus we adopt option A as the counterimage but noting that option B is equally valid (in terms of being fit by the model). Preliminary results (work in preparation) show that the size is better reproduced with option A when we consider a multiresolution grid that increases the resolution of the matter distribution around the central NW cD galaxy.
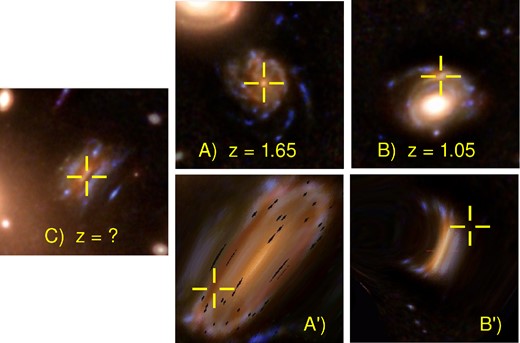
The two possible configurations for system 35. The two counterimages 35.2 and 35.3 are shown in the left-hand column in the figure marked C). 35.2 and 35.3 are merging into a single image. Note the double nucleus at the position of the cross-column. The top row shows the two possibilities, A) and B) for the counterimage 35.1, each one at a different redshift. The bottom row shows the corresponding predicted relensed images, A’) and B’), based on our model for case (ii). The situation is similar for the models of cases (i) and (iii). The field of view is 7.2 arcsec in all cases. The crosses mark the observed positions of the nucleus.
Interestingly, in the recent paper by J14, the authors consider option B in their analysis although they assume a slightly different redshift for the system (zs = 1). Although a more detailed and quantitative comparison with J14 will be done in a subsequent paper, the fact that their alternative definition of system 35 (redefined as system 28 in their work) is coincident with the option B for system 35 discussed above, suggests that, at least in the regions of the cluster proved by system 35, the free-form model derived in this paper and the parametric model derived in J14 are consistent to a high degree. The ambiguity in system 35 can be eliminated once a spectroscopic redshift of the system 35 is obtained. The redshift will unambiguously determine which one of the options, A or B, is the correct one. This system is a good text book example of the ambiguity inherent to strong lensing where highly distorted images are difficult to match even if these images are bright and well resolved and there is a relatively accurate model for the lens.
7 GEOMETRY AND DYNAMICS OF THE MERGER
Multiwavelength observations of merging galaxy clusters offer an opportunity to interpret them in the context of the dynamical state and geometry of the merging. The offsets between the peaks of the DM surface density and X-ray emission in the merging cluster are important in terms of understanding the physics of the collision (i.e. initial masses of the two components, the impact parameter and infall velocity). The fact that offsets are observed between the X-ray and the inferred local minima of the gravitational potential (at the positions of the cD galaxies) suggests that the intracluster gas is being affected by ram pressure, and displaced from the potential well. This phenomenon has been observed in different clusters with the most famous being the bullet cluster. In these cases, the intracluster gas always lags behind the moving gravitational potential due to ram pressure acting on the gas. In the bullet cluster, the system is observed after the first core passage, and the two clusters are moving in a plane close to the plane of the sky, so projection effects are negligible. In our case, MACS J0416, there is no obvious way to tell the orientation of the plane of the collision relative to the line of sight by looking at the positions of the DM peaks in the image of the surface mass density. If we assume that the collision is taking place in the plane of the sky, the X-ray emission of the SW clump is displaced with respect to its DM peak in the opposite direction (or opposite side) that one would expect if the system is just after the first core passage. If the system is being observed before the collision, and the two clusters are on a course to their first core passage, the X-ray peak in the SW would be on the right-hand side but the magnitude of the shift is too large, since the plasma is expected to dissociate from the DM at the time of closest approach.
Alternatively, if the collision happens in a plane that is close to normal to the plane of the sky, projection effects can help to explain the relative positions of the DM and X-ray peaks. Figs 8 and 9 show an example from a hydrodynamical simulation that resembles the case of MACS J0416. The merging simulations were carried out using the publicly available parallel Eulerian code, flash, developed at the Center for Astrophysical Thermonuclear Flashes at the University of Chicago (Fryxell et al. 2000; Ricker 2008). The highest resolution was 12.7 kpc, which were used at the merging shocks and the cluster centres. We adopted a box size of 13.3 Mpc on a side to contain both clusters without losing mass from the simulation box. Our self-consistent N-body/hydrodynamical simulations included only shock heating and no other non-gravitational effects. Initially, the clusters were assumed to be spherical, with the gas following a non-isothermal β model in hydrostatic equilibrium within the DM (with an NFW density profile). A detailed description of the initial set-up for our simulations can be found in Molnar, Hearn & Stadel (2012).
Simulated merging cluster with the two components moving close to the line of sight. Because of projection effects, the peak of the X-ray emission (dashed contours) shows an offset with respect to the DM (solid contours) to the right of the SW clump, opposite to what we would expect from the gas of an in-falling cluster held back by ram pressure moving SW. The projected trajectory of the smaller halo with respect to the bigger one is also shown.

As in Fig. 3, solid contours correspond to the DM component and dashed contours to the X-ray surface brightness. Our simulation in Fig. 8 is projected along an axis with 21° inclination angle of the plane of the collision relative to the line of sight. The morphology resembles that of MACS J0416: The peaks of the DM and X-ray emission are almost in the same line. The DM peaks are located closer to each other than the X-ray peaks. The large offset between the peak of the DM and X-ray emission of the infalling cluster is due to the ram pressure separating the gas from the DM component as it passes through the main cluster (this can be appreciated better in Fig. 9). Our 3D simulation shows that the gas of the infalling cluster is trailing the DM peak as expected. However, due to projection effects, in our simulated image, the X-ray peak in the SW seems to be located ahead of the DM peak in the SW (Fig. 8). With virial concentration parameters of 5 and 8, our simulation has smaller masses (2 and 0.5 × M⊙) and a larger infall velocity (4500 km s−1), and produces a larger offset between the DM and the X-ray emission, therefore, it is likely that a smaller infall velocity is necessary to produce the observed morphology.
The scenario, where the collision happens along an axis close to the line of sight, is also supported by the difference in spectroscopic redshifts between the two cD galaxies. These redshifts where recently estimated in Ebeling, Ma & Barrett (2014). The NE cD galaxy has a spectroscopic redshift of z = 0.4002 ± 0.0003 while the SW cD has a redshift of z = 0.3963 ± 0.0003. The difference in redshift can be translated to a sizable relative velocity, δvrad ≈ 1200 km s−1 (about twice the average of the expected relative infall velocities of massive clusters; see fig. 15 of Thompson & Nagamine 2012) suggesting that this cluster may be a good candidate for Sunyaev–Zel'dovich (SZ) studies with increased pressure. The same redshift difference can be observed when looking at the surrounding galaxies as can be seen from Fig. 10, suggesting that MACS J0416 consists of two clusters moving against each other in a direction close to the line of sight, and that they are close enough so that the X-ray morphology is highly disturbed indicating a collision between the two gas components.
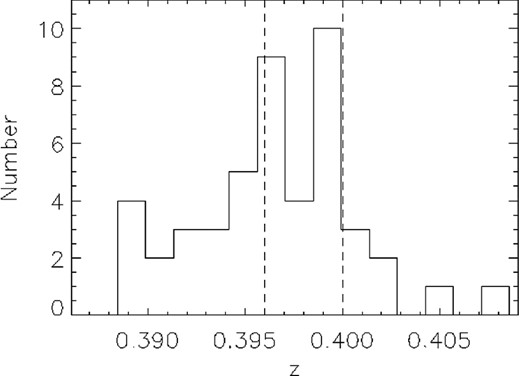
Histogram of the galaxies with spectroscopic redshifts in the field (see Ebeling et al. 2014). The two vertical dashed lines mark the redshifts of the two cD galaxies.
It is interesting to note that our merging simulation predicts that the SZ peak of this system is also displaced from the DM peaks. In Fig. 11, we show contours of the DM surface mass density and SZ amplitude in the same projection as in Fig. 8. In this figure, we see a secondary SZ peak associated with the SW clump (infalling cluster) coinciding with the X-ray peak, due to the bulk of the gas of the infalling cluster. The main SZ peak, however, which dominates the SZ signal, and might be observable with lower angular resolution SZ instruments due to its high amplitude and large beam filling factor, shows an offset from the mass centre of the main cluster on the collisional axis displaced towards the infalling cluster (SW). For our particular simulation we expect the SZ to exhibit a different morphology than the X-rays. Thus, the combination of SZ plus X-ray would allow us to resolve some of the degeneracies due to projection effects.
Like in Fig. 8. Solid lines represent the DM surface mass density, but instead of the X-ray emission, we show the projected SZ amplitude as dot–dashed contours. Note how the main peak of the projected SZ traces better the axis of the collision.
8 A VERY FLAT CORE REGION
This cluster has an unusual flat profile at around 10–20 arcsec. In Z13 it was already shown that the projected mass profile between 10 and 20 arcsec is extremely shallow. Our model confirms this result as shown in Fig. 5 with a break in the slope at a radius of ≈20 arcsec (about 80 kpc h−1). The result is even more significant if the baryonic component is subtracted from the mass profile. In the very central region, and depending on the assumed model for the fiducial galaxies, the total reconstructed mass gradually increases again towards the centre. Observationally, the density profiles at the centre of galaxy clusters can be estimated with rich strong lensing data, like the HFF data, which are still relatively scarce. Recently, some progress has been made that improves our understanding on the distribution of DM near the centre of clusters. In a sample of relaxed clusters, Newman et al. (2013) found that the total density in the central region of these clusters has a cusp with no sign of a plateau. However, in a separate paper, Newman et al. (2013) estimated the contribution to the total mass of the stellar component and found that when removed from the total mass, the remaining DM profile was shallower than expected from standard NFW profiles. Similar flattening has been observed recently in other clusters, especially in non-relaxed clusters (Z13; Rau, Vegetti & White 2014) suggesting a possible connection between the slope of the density profile and the dynamical state of the cluster.
Although the lensing data in MACS J0416 lack the sensitivity to constrain the very central region (r < 1 kpc) we should expect an additional flattening of the profile in the very centre at least for the NE galaxy. This is suggested by the significant flattening that is also observed in the light profile of the NE cD galaxy as shown in Fig. 12 (meanwhile the SW cD galaxy does not show this feature, at least not in a pronounced way). The profile in Fig. 12 is computed as the average over concentric rings. The flattening in the galaxy is probably the result of scouring by a massive black hole (or black hole binary) at the centre of the galaxy (Postman et al. 2012b; Rusli et al. 2013; Lopez-Cruz et al. 2014; Thomas et al. 2014). Stars in radial trajectories that approach the centre of the galaxy would be ejected by the black hole(s) towards larger radii, flattening the brightness profile of the galaxy (Thomas et al. 2014). The impact parameter, rb, defined as the radius at which the Sérsic profile breaks, is about rb ≈ 1 kpc (see Fig. 12). According to Rusli et al. (2013), the radius rb scales with the mass of the black hole. A similar correlation is observed between the black hole mass and the velocity dispersion of the galaxies (Gebhardt et al. 2000). For the observed rb ≈ 1 kpc, the scaling laws in Rusli et al. (2013) predict a mass for the supermassive black hole of MBH ≈ 1010 M⊙.
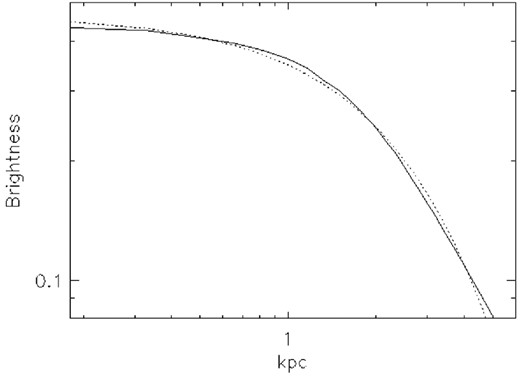
Brightness profile of the NE cD galaxy (solid line) showing the break in the profile at around 1 kpc. The brightness is in arbitrary units. For comparison we show a core Sérsic profile with index break radius rb = 1.2 kpc (dotted line). A definition of the break radius can be found, for instance, in Rusli et al. (2013).
The same black hole that scours the centre of the galaxy of stars would flatten as well the distribution of DM particles reducing the fraction of radial orbits towards the centre of the galaxy. Hence, we should expect also a flattening in the DM distribution in the very central region (r < 1 kpc). However, this mechanism could not explain the flattening at larger radii (15–100 kpc h−1). More energetic phenomena, probably involving the past collision of the two clusters, are required in order to explain the plateau at r ≈ 10–20 arcsec (40–80 kpc h−1). Other mechanisms play a role in determining the intrinsic shape of the profile in the central region. Adiabatic compression of the DM by the infalling baryons can enhance the density profile in the very central region (Blumenthal et al. 1986; Gnedin et al. 2004). On the other hand, this effect is opposed by the same infalling baryons that can heat up the core by dynamical friction and can transfer the orbital energy of the infalling baryons to the DM (El-Zant et al. 2004). Active galactic nuclei (AGN) feedback can contribute also to the flattening of the central region (Martizzi et al. 2012). However, all these effects act on scales up to 10–15 kpc and could not explain a flattening extending up to 100 kpc. The dynamics of the merger could have an impact on larger scales and offer an alternative explanation to the shape of the profile. However, a flattening of the scale observed in this cluster is difficult to explain with simulations. Ricker & Sarazin (2001) studied mergers of clusters for different mass ratios and impact parameters. Their simulations include both DM and baryons. For mass ratios similar to MACS J0416, they find that the DM profiles are not strongly affected after the collision and the profiles do not show a plateau at any radius. The same result can be observed in our simulations as it is shown in Figs 8 and 13 and also in simulations from our archive of merging clusters (Molnar et al. 2012), where both clumps conserve their cusps after the collision. In Dekel, Devor & Hetzroni (2003), the authors argue that merging of cuspy haloes inevitably leads to a cusp, thus implying that the two subclusters in MACS J0416 must have had their cusps suppressed before the merger by some mechanism. Simulations of collisions of cored clusters (with cores of about 100 kpc) suggest that the core can survive the collision (Ritchie & Thomas 2002). However, these simulations do not explain how the core is formed. Despite the need of simulations to understand the role of merger dynamics on the profiles of cluster similar to MACS J05416, simulations are often difficult to interpret, especially in the central region of clusters. Different codes may produce different results depending on their implicit assumptions. As shown in Mitchell et al. (2009), smoothed particle hydrodynamics (SPH) N-body simulations tend to produce more massive cores than Eulerian mesh codes although the discrepancy gets reduced when the refinement level is increased in the mesh code.
Profiles of the simulated haloes shown in Fig. 8. The flattening in the very central region is partially due to resolution.
Alternatively, if the DM is self-interacting, the probability of interaction increases with the speed of the DM particles. A cluster collision offers a unique opportunity to boost the chance of interaction from the increased relative velocity of the interacting particles. One interesting clue can be found in Rocha et al. (2013). In that work, the authors simulate large-scale structure under the assumption that DM can self-interact (with a higher probability at the cores of haloes). Interestingly, for cross-sections σ/m ≈ 1 cm2 g−1 they find that in haloes of masses Mvir = 2 × 10¹⁴ M⊙ the profile exhibits a plateau corresponding to core scales of about 150 kpc. The plateau extends from the centre up to about 70 kpc and at the centre the density is about an order of magnitude lower than in the corresponding standard NFW profile. In our case, if the impact parameter of the two clusters is about 200 kpc, the chance of interaction between DM particles should be smaller than in the case of a head-on collision. However, it is still important to emphasize how the characteristics of the cored profiles in Rocha et al. (2013) strikingly resemble the observed profiles in MACS J0416 so this possibility still offers a possible interesting explanation. Moreover, the fact that this cluster went through a collision would imply that even a smaller than 1 cm2 g−1 cross-section could be enough to cause a similar effect since the increase in relative velocity due to the collision could compensate the decrease in the cross-section. A lower than 1 cm2 g−1 value for σ/m is also preferred by observations of more relaxed clusters where such a flattening of the central region is not observed.
Finally, another probable mechanisms that can, in principle, contribute to disrupting the core are tidal forces. In Fig. 8, the DM haloes show a small elongation. Since the initial model is symmetric the tidal effects must be present at the time we are witnessing this encounter. However, when looking at the DM profiles of the simulated cluster (and shown in Fig. 13) we do not observe a flattening of the profile in the centre suggesting that tidal forces may have a small impact on shaping the very central region of the clusters. The effect that tidal forces have on stretching the cores of merging clusters will be studied in a subsequent paper.
It is not clear that the extent of these effects would still be sufficient to explain the observed profiles. More likely, a combination of different effects would be the most plausible explanation. If DM is self-interacting, a small cross-section together with some of the mechanisms described above plus projection effects could lead to a flattening of the central region in colliding clusters. If DM self-interaction plays a significant role, similar shallow profiles should be observed in other post-collision clusters, in particular in the morphologically disturbed HFF clusters, where the DM distribution can be inferred directly from gravitational lensing. Improved observations on this cluster will be available soon from a multiwavelength perspective, in optical bands with the remaining HFF data (improved photo-z for the lensing systems and potentially new systems), in X-ray with already planned Chandra observations may reveal shocks and a better location of the peaks in the X-ray emission; in radio with also planned deep Very Large Array (VLA) observations may reveal possible evidence of past merging activity and confirm the shock activity. Together they will throw some light on this interesting cluster.
9 CONCLUSIONS
We find significant positional offsets between the DM and plasma given the precision of our lens model in particular for the SW component, which we have shown is plausibly generated by displacement of the gas during the encounter. We also notice that two main DM components have very shallow profiles surrounding each of the two main cD galaxies. Our dynamical simulation shows that tidal stretching of the DM is expected to be observed at the post-encounter stage of the collision indicated by our model and hence qualitatively may help to understand, at least partially, the cores we find. These tidal effects highlight the importance of free-form modelling over the parametric approach, for which idealized forms can only hope to approximate such interesting complexities.
The bimodal redshift distribution of the cluster members, together with results from hydrodynamical simulations, suggests that this cluster is colliding in a plane that is close to the line of sight. Our hydrodynamical model predicts an SZ peak lying midway between the two main lensing peaks and significantly offset from the X-ray emission. This is possibly due to the enhanced gas pressure during the encounter.
Our DM reconstructed distribution shows an elongation in the direction of a peak in the X-ray data suggesting that the lensing distortions may be sensitive also to the mass of the plasma. The two density profiles associated with each subhalo are almost identical suggesting a ratio close to 1:1 for this merging cluster. The profiles also exhibit a plateau at around 40–100 kpc which could be interpreted as the result of dynamical distortions of the subcluster profiles, or projection effects but also as possible evidence of self-interacting DM with an increased probability of interaction during the collision. Detailed lensing observations of merging galaxy clusters, like those from the HFF, together with more detailed simulations of merging clusters may help clarify this situation.
This work is based on observations made with the NASA/ESA Hubble Space Telescope operated by the Association of Universities for Research in Astronomy, Inc., under NASA contract NAS 5-2655. JMD acknowledges support of the consolider project CAD2010-00064 and AYA2012-39475-C02-01 funded by the Ministerio de Economia y Competitividad. JMD also acknowledges the hospitality of the Department of Physics and Astronomy at University of Penn during part of this research. The scientific results reported in this paper are based in part on data obtained from the Chandra Data Archive. We would like to thank Harald Ebeling for providing us with the code ASMOOTH (Ebeling et al. 2006) that was used to smooth the Chandra data. The authors would like to thank the HFF team for making the data for this work available to the community. The authors would also like to thank the anonymous referee for the many useful comments and suggestions that have helped improved the paper.
ivo://ADS/Sa.CXO#obs/10446
Fig. 4 in that paper is incorrect. See http://arxiv.org/abs/1110.3979 for the correct fig. 5.
REFERENCES
APPENDIX A: COMPILATION OF ARC STAMPS AND POSITIONS
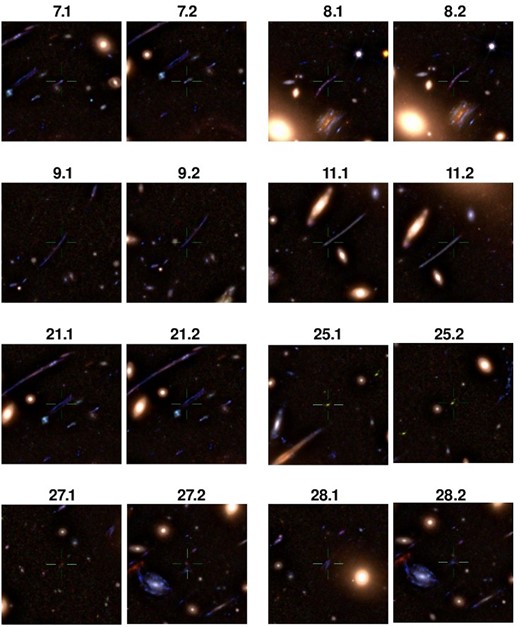
Stamps for double systems 7, 8, 9, 11, 21, 25, 27 and 28. Images have been filtered to reduce light glare from member galaxies.
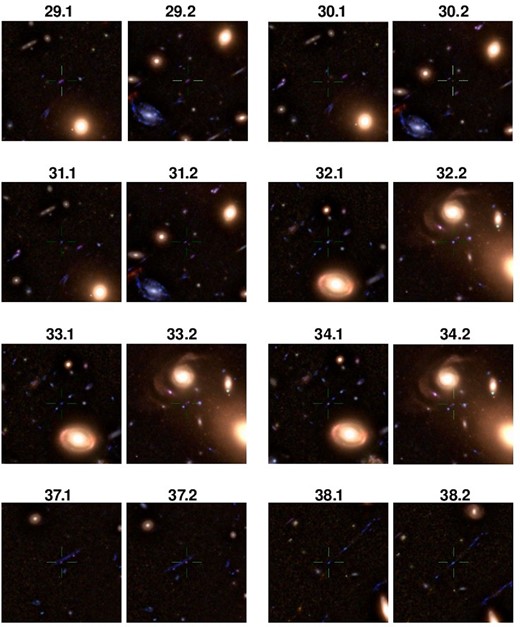
Like in Fig. A1 but for systems 29–34, 37 and 38.
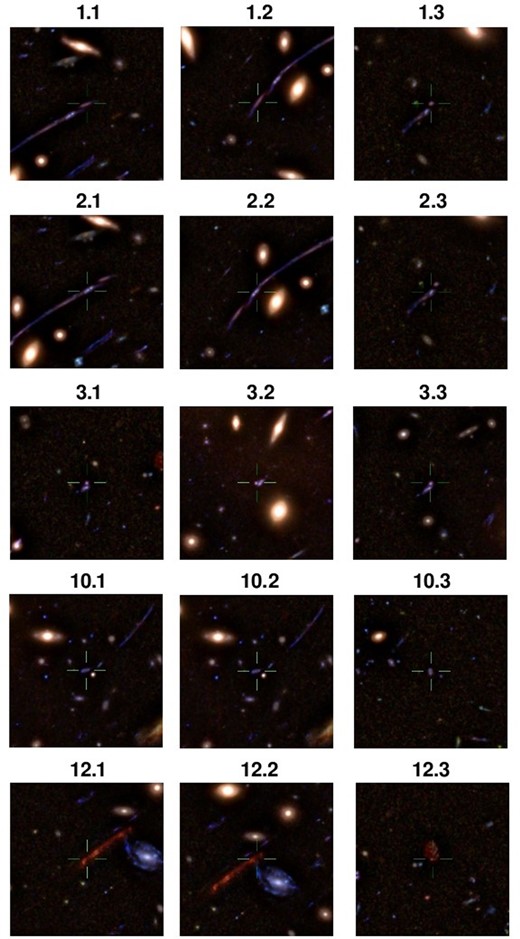
Stamps for triple systems 1, 2, 3, 10 and 12.
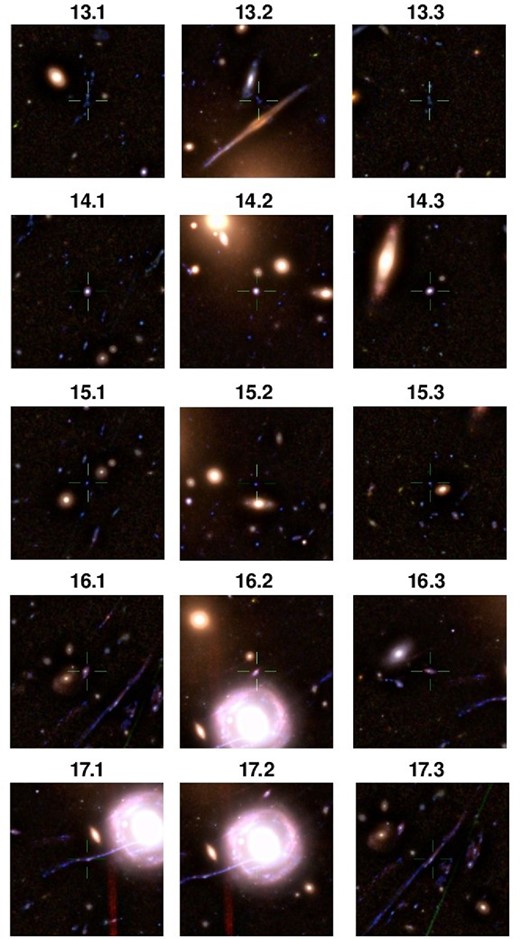
Like in Fig. A3 but for systems 13–17.
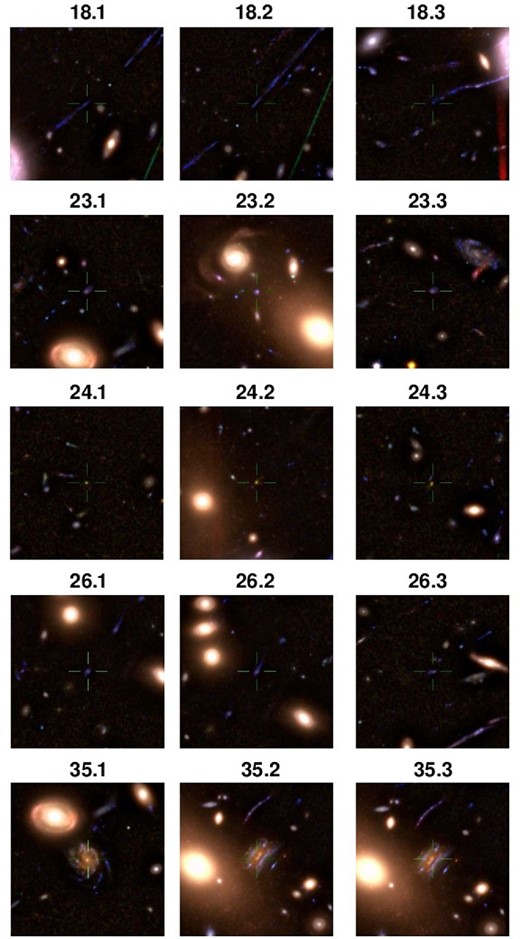
Like in Fig. A3 but for systems 18, 23, 24, 26 and 35.
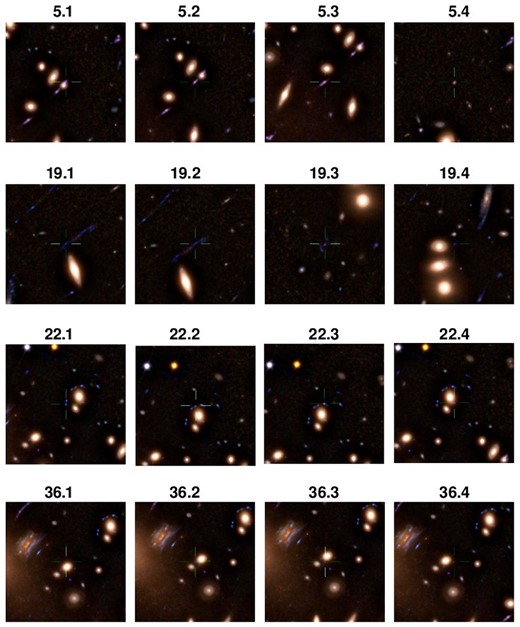
Stamps for quadruple systems 5, 19, 22 and 36.
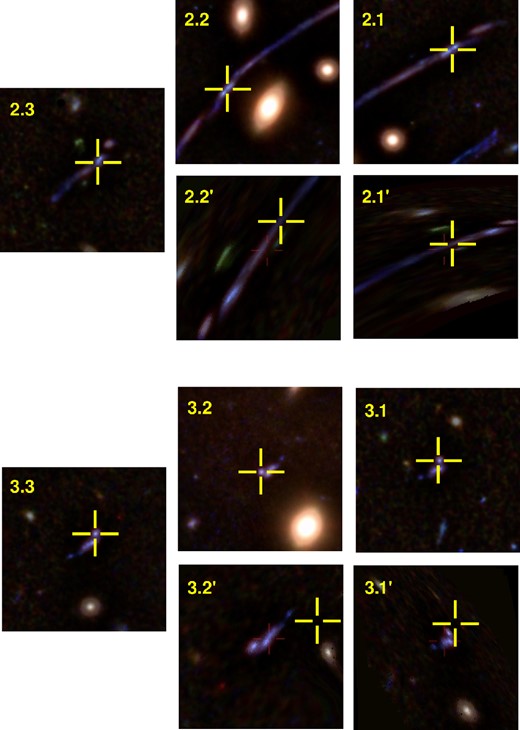
Examples of relensed images compared with the observed ones. Top group: relensed system 2. The image on the left, 2.3, is the one used to delense the galaxy into the source plane. On the right we show the observed (2.2, 2.1) and predicted (2.2′, 2.1′) counterimages. Bottom group: like the top group but for the relensed system 3. The crosses mark the observed positions. We use the model in case (ii) for the predicted images. In all cases the field of view is 7.2 arcsec.
Full strong lensing data set. The first column shows system ID following the original notation of Z13. The second and third columns show the coordinates of each arclet. The fourth column includes the redshifts used in our study (taken from Z13 when appropriate). Some of these redshifts are photometric and some are based on colour and/or predicted by the lens model. The last column contains additional useful information. In this column, ‘gz’ indicates that the redshift has been derived by the lens model. System 4 and system 3 are almost overlapping in position and could be in fact the same system but are treated as two different systems following Z13. Candidates marked with (*) correspond to new arclet candidates identified in this work. Arclet 12.3 is found at the position predicted by Z13. Because of the possibility of confusion by multiple faint arclets with similar colours and falling into the same region, we have not used the following arclets from Z13 7.3, 9.3, 10.3, 11.3, 12.3(updated), 15.3(updated), 21.3. Systems 6 and 20 from Z13 have been discarded completely due to bad colour agreement after adding the new IR data.
| ID | RA J2000 | Dec. J2000 | z | Notes |
|---|---|---|---|---|
| (h:m:s) | (°:′:′′) | |||
| 1.1 | 04:16:09.780 | −24:03:41.73 | 1.896 | Spect z |
| 1.2 | 04:16:10.435 | −24:03:48.75 | 1.896 | |
| 1.3 | 04:16:11.365 | −24:04:07.21 | 1.896 | |
| 2.1 | 04:16:09.884 | −24:03:42.77 | 1.8 | |
| 2.2 | 04:16:10.321 | −24:03:46.93 | 1.8 | |
| 2.3 | 04:16:11.394 | −24:04:07.86 | 1.8 | |
| 3.1 | 04:16:07.388 | −24:04:01.62 | 2.25 | |
| 3.2 | 04:16:08.461 | −24:04:15.53 | 2.25 | |
| 3.3 | 04:16:10.036 | −24:04:32.56 | 2.25 | |
| 4.1 | 04:16:07.398 | −24:04:02.01 | 2.25 | Same as 3.1? |
| 4.2 | 04:16:08.437 | −24:04:15.53 | 2.25 | Same as 3.2? |
| 4.3 | 04:16:10.051 | −24:04:33.08 | 2.25 | Same as 3.3? |
| 5.1 | 04:16:07.773 | −24:04:06.24 | 2.3 | |
| 5.2 | 04:16:07.839 | −24:04:07.21 | 2.3 | |
| 5.3 | 04:16:08.043 | −24:04:10.01 | 2.3 | |
| 5.4 | 04:16:10.454 | −24:04:37.05 | 2.3 | |
| 7.1 | 04:16:09.552 | −24:03:47.13 | 2.0 | |
| 7.2 | 04:16:09.752 | −24:03:48.82 | 2.0 | |
| 8.1 | 04:16:08.783 | −24:03:58.05 | 2.4 | |
| 8.2 | 04:16:08.840 | −24:03:58.83 | 2.4 | |
| 9.1 | 04:16:06.486 | −24:04:42.90 | 2.3 | |
| 9.2 | 04:16:06.605 | −24:04:44.78 | 2.3 | |
| 10.1 | 04:16:06.244 | −24:04:37.76 | 2.3 | |
| 10.2 | 04:16:06.833 | −24:04:47.12 | 2.3 | |
| 10.3 | 04:16:08.807 | −24:05:01.94 | 2.3 | |
| 11.1 | 04:16:09.410 | −24:04:13.32 | 0.8 | |
| 11.2 | 04:16:09.196 | −24:04:11.11 | 0.8 | |
| 12.1 | 04:16:09.230 | −24:04:25.74 | 2.5 | |
| 12.2 | 04:16:09.011 | −24:04:23.72 | 2.5 | |
| 12.3 | 04:16:06.956 | −24:04:00.57 | 2.5 | New(p12.3) |
| 13.1 | 04:16:06.619 | −24:04:22.03 | 3.0 | |
| 13.2 | 04:16:07.711 | −24:04:30.61 | 3.0 | |
| 13.3 | 04:16:09.681 | −24:04:53.56 | 3.0 | |
| 14.1 | 04:16:06.296 | −24:04:27.62 | 1.7 | |
| 14.2 | 04:16:07.450 | −24:04:44.26 | 1.7 | |
| 14.3 | 04:16:08.598 | −24:04:52.78 | 1.7 | |
| 15.1 | 04:16:06.292 | −24:04:33.67 | 2.0 | |
| 15.2 | 04:16:07.065 | −24:04:42.90 | 2.0 | |
| 15.3 | 04:16:09.175 | −24:04:58.71 | 2.0 | New(*) |
| 16.1 | 04:16:05.774 | −24:04:51.22 | 2.0 | |
| 16.2 | 04:16:06.799 | −24:05:04.35 | 2.0 | |
| 16.3 | 04:16:07.583 | −24:05:08.77 | 2.0 | |
| 17.1 | 04:16:07.170 | −24:05:10.91 | 2.5 | |
| 17.2 | 04:16:06.866 | −24:05:09.55 | 2.5 | |
| 17.3 | 04:16:05.599 | −24:04:53.69 | 2.5 | |
| 18.1 | 04:16:06.258 | −24:05:03.24 | 2.8 | |
| 18.2 | 04:16:06.016 | −24:05:00.06 | 2.8 | |
| 18.3 | 04:16:07.416 | −24:05:12.28 | 2.8 | |
| 19.1 | 04:16:10.909 | −24:03:41.08 | 2.7 | |
| 19.2 | 04:16:10.777 | −24:03:39.85 | 2.7 | |
| 19.3 | 04:16:11.925 | −24:04:00.91 | 2.7 | |
| 19.4 | 04:16:11.580 | −24:03:52.23 | 2.7 | New(*) |
| 21.1 | 04:16:09.813 | −24:03:46.67 | 2.6 | |
| 21.2 | 04:16:09.865 | −24:03:47.32 | 2.6 | |
| 22.1 | 04:16:08.278 | −24:04:01.07 | 1.8 | |
| 22.2 | 04:16:08.204 | −24:03:59.28 | 1.8 | |
| 22.3 | 04:16:08.162 | −24:03:59.22 | 1.8 | |
| 22.4 | 04:16:08.152 | −24:04:00.87 | 1.8 | New(*) |
| 23.1 | 04:16:10.691 | −24:04:19.56 | 2.0 | |
| 23.2 | 04:16:09.505 | −24:03:59.87 | 2.0 | |
| 23.3 | 04:16:08.242 | −24:03:49.47 | 2.0 | |
| 24.1 | 04:16:08.413 | −24:05:07.85 | 5.0 | New |
| 24.2 | 04:16:06.820 | −24:04:58.83 | 5.0 | New |
| 24.3 | 04:16:05.517 | −24:04:38.16 | 5.0 | New |
| 25.1 | 04:16:07.385 | −24:04:27.03 | 4.0 | New |
| 25.2 | 04:16:07.028 | −24:04:24.00 | 4.0 | New |
| 26.1 | 04:16:11.551 | −24:04:01.05 | 2.0 | New |
| 26.2 | 04:16:11.394 | −24:03:57.75 | 2.0 | New |
| 26.3 | 04:16:10.136 | −24:03:37.95 | 2.0 | New |
| 27.1 | 04:16:10.056 | −24:04:38.79 | 4.0 | New |
| 27.2 | 04:16:08.658 | −24:04:23.49 | 4.0 | New |
| 28.1 | 04:16:09.683 | −24:04:35.37 | 2.0 | New |
| 28.2 | 04:16:08.662 | −24:04:24.15 | 2.0 | New |
| 29.1 | 04:16:09.578 | −24:04:32.19 | 2.0 | New |
| 29.2 | 04:16:08.605 | −24:04:22.11 | 2.0 | New |
| 30.1 | 04:16:09.705 | −24:04:32.79 | 2.0 | New |
| 30.2 | 04:16:08.632 | −24:04:20.88 | 2.0 | New |
| 31.1 | 04:16:09.718 | −24:04:31.71 | 2.0 | New |
| 31.2 | 04:16:08.651 | −24:04:20.64 | 2.0 | New |
| 32.1 | 04:16:10.824 | −24:04:20.43 | 2.0 | New |
| 32.2 | 04:16:09.620 | −24:04:00.27 | 2.0 | New |
| 33.1 | 04:16:10.886 | −24:04:21.15 | 2.0 | New |
| 33.2 | 04:16:09.598 | −24:03:59.97 | 2.0 | New |
| 34.1 | 04:16:10.921 | −24:04:21.63 | 2.0 | New |
| 34.2 | 04:16:09.582 | −24:03:59.82 | 2.0 | New |
| 35.1 | 04:16:10.575 | −24:04:28.02 | 1.65 | New gz |
| 35.2 | 04:16:08.803 | −24:04:02.43 | 1.65 | New gz |
| 35.3 | 04:16:08.780 | −24:04:02.06 | 1.65 | New gz |
| 36.1 | 04:16:08.509 | −24:04:03.86 | 2.0 | New |
| 36.2 | 04:16:08.547 | −24:04:04.64 | 2.0 | New |
| 36.3 | 04:16:08.514 | −24:04:04.95 | 2.0 | New |
| 36.4 | 04:16:08.441 | −24:04:04.49 | 2.0 | New |
| 37.1 | 04:16:07.931 | −24:04:54.42 | 2.0 | New |
| 37.2 | 04:16:07.841 | −24:04:53.73 | 2.0 | New |
| 38.1 | 04:16:11.271 | −24:03:38.85 | 2.0 | New |
| 38.2 | 04:16:11.148 | −24:03:37.41 | 2.0 | New |
Arclets from Z13 that are not used in this work. Systems 6 and 20 where removed completely.
| ID | RA J2000 | Dec. J2000 | Notes |
|---|---|---|---|
| (h:m:s) | (°:′:′′) | ||
| 7.3 | 04:16:11.308 | −24:04:15.99 | Many candidates nearby |
| 9.3 | 04:16:09.149 | −24:05:01.23 | Many candidates nearby. Far from prediction |
| 10.3 | 04:16:09.818 | −24:04:58.69 | The alternative 10.3 works better |
| 11.3 | 04:16:08.214 | −24:03:57.66 | No predicted third counterimage |
| 12.3 | 04:16:06.989 | −24:04:03.57 | Red galaxy nearby fits position better (and colour) |
| 15.3 | 04:16:08.560 | −24:04:55.38 | Far from model prediction |
| 21.3 | 04:16:11.047 | −24:04:07.73 | Far from model prediction |
