


Abstract
We analyse the mid-infrared (MIR) spectra of 39 Seyfert galaxies observed with the Infrared Spectrograph (IRS) on board the Spitzer Space Telescope. Our sample consists of 19 Seyfert type 1 (Sy1) galaxies, three intermediate Seyfert galaxies and 17 type 2 Seyfert (Sy2) galaxies in the nearby Universe. This sample was extracted from a larger sample, the circumgalactic environment of which was studied in a previous work by Dultzin-Hacyan et al., who found that Sy2 objects are in interaction more frequently than normal galaxies, while Sy1s are not. In this article, we study the silicate dust distribution that dominates the mid-infrared (MIR) spectra. This dust produces spectral features at 10 and 18 μm that are sensitive to the clumpiness of the dust. We measure the strength of the emission or absorption of the silicate features to find whether there is a correlation between the clumpiness of the circumnuclear dust and the active galactic nucleus (AGN) type and incidence of companions. All isolated Sy1 galaxies have clumpy dust distributions, whereas Sy1s with a close companion can have either clumpy or smooth distributions. In the case of Sy2 galaxies, those with one or more companions have mostly smooth dust distributions, whereas isolated Sy2s may have clumpy or smoothly distributed dust. Our result is at odds with the simplest formulation of the unified scheme for Seyferts and supports an evolutionary sequence where the influence of an interaction triggers a type 2 AGN, which evolves into a type 1.
1 INTRODUCTION
The unified scheme for active galactic nuclei (AGNs), currently the dominant paradigm, postulates that the diverse spectral properties that determine the diverse types of AGN correspond to different orientations between the circumnuclear dust torus surrounding the accretion disc and the line of sight (Antonucci 1993). According to this scheme, the only difference between type 1 and 2 AGNs is that the central engine of an AGN, including the broad-line region (BLR), is completely obscured when viewed along directions intercepted by the dusty torus and it is then classified as a type 2. On the other hand, when the line of sight to the central engine is clear we see a type 1 AGN. This scheme received strong support from the fact that broad lines were revealed in the spectra of Seyfert 2 (Sy2) galaxies in polarized light (Antonucci & Miller 1985). However, later on it was found that hidden BLRs are only observable in 50 per cent of Sy2 galaxies (Tran 2001, 2003), indicating the possible existence of pure type 2 objects (Gu, Maiolino & Dultzin-Hacyan 2001). These objects may intrinsically lack a BLR, which can be explained in terms of a very low accretion rate (Nicastro 2000; Elitzur 2008) or may be due to obscuration effects (Shu, Wang & Jiang 2008). Indeed, observational evidence suggests that Sy2s with polarized broad lines are more easily related to truly obscured Seyfert 1 (Sy1) nuclei, while pure Sy2s preferentially host weak AGNs. There is also evidence of non-obscured Seyfert 2 galaxies in the X-ray region (Bianchi et al. 2008; Brightman & Nandra 2008).
There are early works showing that Sy1 and Sy2 galaxies have different intrinsic properties in different wavebands (Dultzin-Hacyan & Benitez 1994; Dultzin-Hacyan & Ruano 1996). For example, optical studies suggest that Sy2 galaxies exhibit circumnuclear star-forming regions more frequently than Sy1 galaxies (Gonzalez-Delgado & Perez 1993; Gu et al. 2001); similar trends were found from IR studies (Maiolino & Rieke 1995; Maiolino et al. 1997). Also, Cid Fernandes et al. (2001) found that 50 per cent of Sy2 galaxies exhibit an intense starburst (SB). Recent results that compare near-infrared (NIR) with hard X-ray luminosities suggest that this difference is clear-cut only at low luminosities (Castro et al. 2014). Other studies, however, claim that there is no significant difference between type 1 and type 2 galaxies regarding star formation activity (Imanishi & Wada 2004).
With respect to the circumgalactic environment, the lack of type 1 AGNs in isolated pairs of galaxies (González et al. 2008) and in compact groups (Martínez et al. 2008; Bitsakis et al. 2010) is also in disagreement with the simplest formulation of the unified scheme. Furthermore, it has been shown that Sy2 galaxies are in interaction with similar mass close neighbours more often than normal galaxies, while Sy1s are not (Dultzin-Hacyan et al. 1999). It has also been shown that the frequency of interactions for Sy2s and starburst galaxies is similar (Krongold, Dultzin-Hacyan & Marziani 2002). More recent studies support this finding with observations that take into account the radial velocities of the neighbouring galaxies (Koulouridis et al. 2006a,b).
Despite the fact that the role of interactions in inducing activity is still an open issue (Koulouridis et al. 2006a,b, 2013), the above studies support a possible evolution of activity that follows the path: interactions → enhanced star formation → type II AGN → type I AGN (e.g. Krongold et al. 2002, 2003). This evolutionary sequence explains the differences between type 1 and type 2 AGNs, while at the same time being consistent with the unified scheme as a particular stage of the evolution.
In order to understand the physics of AGNs, a key issue is the nature of the obscuring medium surrounding the active nucleus. A key ingredient of the obscuring medium is thought to be a dusty torus on a parsec (pc) scale consisting of dusty clouds that are individually optically thick (Krolik & Begelman 1988). This dust in the torus reprocesses the radiation from the central engine to emerge at mid-infrared (MIR) wavelengths. The MIR spectral energy distribution (SED) is determined by the dust geometric distribution, the dust composition and the dust density distribution of the torus. Several studies have modelled the toroidal dust structure with the aim of comparing it with the observable properties. Early modelling work assumed smooth dust models (e.g. Pier & Krolik 1992, 1993; Granato & Danese 1994; Efstathiou & Rowan-Robinson 1995). More recently, several works suggested the existence of a clumpy torus (e.g. Krolik & Begelman 1988; Rowan-Robinson 1995; Nenkova, Ivezić & Elitzur 2002; Thompson et al. 2009). In particular, Nenkova et al. (2008a,b) have developed a formalism to calculate the SED of the clumpy structure.
The MIR spectra of galaxies is dominated by dust emission. Silicates, a major constituent of astronomical dust, reveal their presence through the spectral features at 10 and 18 μm. The stronger 10-μm silicate features originates from an SiO-stretching mode and the 18-μm silicate features from an SiO-bending mode (Knacke & Thomson 1973). Sirocky et al. (2008) have shown that the comparison of both silicate features is a reliable diagnostic of the dust chemistry and dust geometry around the AGN, distinguishing between smooth and clumpy distributions.
The aim of our article is to find a possible correlation between clumpiness of the circumnuclear dust distribution and AGN type and interaction incidence.
2 THE SAMPLE
The sample of Seyfert galaxies used for this study consists of 19 Sy1 galaxies, three intermediate Seyfert galaxies, and 17 Sy2 galaxies. We selected a subsample from Dultzin-Hacyan et al. (1999), which has been observed by the Infrared Spectrograph on board the Spitzer Space Telescope (Werner et al. 2004; Houck et al. 2004). The data we have used were obtained from different Spitzer programmes that have different observational goals. Therefore, our sample is not biased towards any particular type of objects with unique characteristics that may affect our conclusions. In Table 1, we present our sample and identify the original Spitzer programme from which the data were taken. The sample by Dultzin-Hacyan et al. (1999) was obtained from the catalogue of Lipovetsky, Neizvestny & Neizvestnaya (1988) and consists of 72 Sy1 galaxies (redshift 0.007 ≤ z ≤ 0.034) and 60 Sy2 galaxies (0.007 ≤ z ≤ 0.020). The V/Vmax test shows that the sample is complete to a level of 92 per cent. In order to avoid Galactic extinction, the objects were selected at high Galactic latitude, b ≥ 40°. For more details see Dultzin-Hacyan et al. (1999). In this study, the close environment of the galaxies was examined (within ≲100 kpc of the projected distance). It was found that the sample of Seyfert 2 galaxies shows an excess of large neighbours (Dn ≥ 10 kpc) with respect to non-active galaxies, whereas that of Seyfert 1 galaxies does not. The distance distribution of Sy1s is somewhat larger than that of Sy2s. However, the cut-off magnitude used to select similar-mass companions does not bias the selection. We do not consider faint companions. This result was confirmed in a three-dimensional study by Koulouridis et al. (2006a,b). In order to distinguish between physical and projected companions, these authors used a radial velocity separation criterion of δv ≲ 600 km s−1.
Sample of Seyfert galaxies.
| Name | Spitzer PID | RA (J2000.0) | Dec.(J2000.0) | mB | z | Type | Environment |
|---|---|---|---|---|---|---|---|
| Mrk 590 | 30572 | 02 14 34.7 | 01 13 57 | 13.81 | 0.02700 | Sy1 | Interacting |
| ESO 548−G81 | 30745 | 03 42 03.0 | −21 14 25 | 12.92 | 0.01148 | Sy1 | Isolated |
| NGC 2782 | 24 | 09 14 05.6 | 40 06 54 | 12.66 | 0.00854 | Sy1 | Interacting |
| 1H1142−178 | 50588 | 11 45 40.4 | −18 27 16 | 14.70 | 0.03295 | Sy1 | Interacting |
| Mrk 42 | 30715 | 11 53 42.1 | 46 12 42 | 15.20 | 0.02469 | Sy1 | Isolated |
| UGC 7064 | 3374 | 12 04 43.6 | 31 10 37 | 15.50 | 0.01341 | Sy1 | Interacting |
| NGC 4235 | 40936 | 12 17 09.8 | 07 11 28 | 13.20 | 0.00804 | Sy1 | Isolated |
| Mrk 50 | 50588 | 12 23 24.1 | 02 40 44 | 15.17 | 0.02300 | Sy1 | Isolated |
| IISZ10 | 20142 | 13 10 00.0 | −10 51 00 | 15.55 | 0.03426 | Sy1 | Isolated |
| NGC 5077 | 30256 | 13 19 31.4 | −12 39 24 | 14.00 | 0.01341 | Sy1 | Interacting |
| UM 614 | 50588 | 13 49 00.0 | 02 20 00 | 15.70 | 0.0327 | Sy1 | Isolated |
| Mrk 279 | 666 | 13 53 03.2 | 69 18 28 | 14.50 | 0.03025 | Sy1 | Interacting |
| NGC 5548 | 30572 | 14 17 59.5 | 25 08 09 | 13.10 | 0.01717 | Sy1 | Isolated |
| Mrk 290 | 20142 | 15 35 52.1 | 57 54 06 | 15.50 | 0.03062 | Sy1 | Isolated |
| NGC 7172 | 30572 | 22 02 02.1 | −31 52 11 | 12.95 | 0.00859 | Sy1 | Interacting |
| Mrk 915 | 50588 | 22 36 46.6 | −12 32 44 | 14.82 | 0.02391 | Sy1 | Interacting |
| UGC 12138 | 3374 | 22 40 17.0 | 08 03 12 | 14.64 | 0.01718 | Sy1 | Interacting |
| NGC 7469 | 14 | 23 03 15.5 | 08 52 24 | 13.00 | 0.01618 | Sy1 | Interacting |
| NGC 7603 | 3374 | 23 18 56.6 | 00 18 10 | 14.01 | 0.02900 | Sy1 | Interacting |
| Mrk 744 | 3374 | 11 39 42.8 | 31 54 33 | 13.50 | 0.00910 | Sy1.8 | Interacting |
| MCG –03–34–064 | 30323 | 13 22 24.2 | −16 43 44 | 14.64 | 0.01718 | Sy1.8 | Interacting |
| UGC 1395 | 3374 | 01 55 21.9 | 06 36 45 | 14.00 | 0.01726 | Sy1.9 | Isolated |
| NGC 0454 | 50588 | 01 12 00.0 | −55 39 00 | 14.0 | 0.01212 | Sy2 | Interacting |
| NGC 526A | 30572 | 01 23 54.5 | −53 03 54 | 14.66 | 0.01910 | Sy2 | Interacting |
| Mrk 573 | 50094 | 01 43 57.6 | 02 21 01 | 14.07 | 0.01658 | Sy2 | Isolated |
| NGC 788 | 30745 | 02 01 14.4 | −06 49 30 | 14.87 | 0.01795 | Sy2 | Isolated |
| IC 1816 | 50588 | 02 31 51.2 | −36 40 14 | 13.50 | 0.01360 | Sy2 | Isolated |
| ESO 417−G06 | 50588 | 02 56 21.5 | −32 11 05 | 13.87 | 0.01105 | Sy2 | Interacting |
| NGC 1358 | 40936 | 03 33 39.6 | −05 05 18 | 15.10 | 0.02066 | Sy2 | Interacting |
| NGC 4939 | 30572 | 13 04 14.0 | −10 20 25 | 11.99 | 0.01040 | Sy2 | Isolated |
| NGC 5347 | 30572 | 13 53 17.8 | 33 29 24 | 13.18 | 0.00796 | Sy2 | Isolated |
| NGC 5427 | 3247 | 14 03 25.6 | −06 01 53 | 11.93 | 0.00870 | Sy2 | Interacting |
| NGC 5506 | 86 | 14 13 14.6 | −03 12 29 | 13.37 | 0.00585 | Sy2 | Interacting |
| Mrk 686 | 30773 | 14 37 22.1 | 36 34 01 | 13.90 | 0.01409 | Sy2 | Isolated |
| NGC 5953 | 59 | 15 34 32.2 | 15 11 37 | 13.30 | 0.00655 | Sy2 | Interacting |
| IC 4553 | 105 | 15 34 57.1 | 23 30 07 | 14.40 | 0.01812 | Sy2 | Interacting |
| IC 5135 | 30572 | 21 48 19.5 | −34 57 10 | 13.33 | 0.01614 | Sy2 | Isolated |
| NGC 7682 | 50588 | 23 29 03.8 | 03 31 59 | 14.30 | 0.01712 | Sy2 | Interacting |
| NGC 7743 | 40936 | 23 44 21.3 | 09 55 56 | 12.90 | 0.00440 | Sy2 | Interacting |
Notes. The units of right ascension are hours, minutes and seconds and the units of declination are degrees, arcminutes and arcseconds.
Notice that, for the purpose of studying the environment, in these articles the few intermediate Seyfert galaxies were considered as type 1 or type 2 (those of type 1.5 or lower were included in the Sy1 sample and those with type 1.8 or 1.9 in the Sy2 sample). While the interpretation of intermediate Seyferts of 1.5 or lower is straightforward, as the broad component is strong, in the case of 1.8–1.9 objects their nature is more elusive. Their spectra may arise from a clear view of an intrinsically weak broad-line emission. If this is the case, these very weak broad-line objects would represent the link between type 1 AGNs and pure type 2 objects. However, their emission could also reflect scattered radiation from an obscured BLR with standard broad-line emission. In this case, they are type 2 objects. The only way to break this degeneracy is through separate observations to determine the obscuration of the nucleus and/or the line polarization.
Dultzin-Hacyan et al. (1999) estimated the fraction of interacting objects in their samples, which are only projections in the sky using statistical arguments, assuming a Poisson distribution for the field density. While this method is seen to be effective, it does not provide an exact identification of the bona fide physical companions. In order to avoid projected pairs of galaxies in our analysis, in this work we used the Sloan Digital Sky Survey (SDSS) and the NASA/IPAC Extragalactic Database (NED) to search for the nearest neighbours of each Seyfert within a projected radius of 100 h−1 kpc, a radial velocity separation δv ≲ 600 km s−1 and a magnitude limit of mB ∼ 18.5. The choice of 100 kpc was justified, as in Dultzin-Hacyan et al. (1999) it was clear that only this close environment was relevant (see their fig. 1). A radial velocity difference δv ≲ 600 km s−1 was chosen, as it is roughly the mean galaxy pairwise velocity of the Center for Astrophysics Galaxy Catalog (CfA2) as well as the Southern Sky Redshift Survey (SSRS); we note that this difference is about twice the mean pairwise galaxy velocity when clusters of galaxies are excluded (Marzke et al. 1995). This is the same procedure used by Koulouridis et al. (2006a,b), who also carried out their own survey searching for faint physical companions. Our independent search yields results fully consistent with those of these authors.
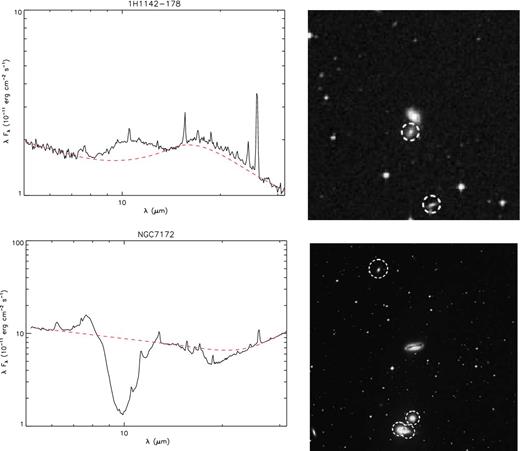
Examples of Sy1 spectra from the Spitzer IRS (black solid lines, left), the continuum-dominated spectrum of 1H1142−178 (top) and the PAH-dominated spectrum of NGC 7172 (bottom). In order to obtain the underlying continuum, we fit a cubic spline (black dashed lines) to measurements over a short-wavelength region, an intermediate interval around 14 μm and a long-wavelength region. Also, this figure shows the NED image of each object (right), with close companions in both cases (white dashed circles).
In addition to our search for physical companions, we also searched for evidence of past mergers in isolated galaxies, using both the literature and direct inspection over the SDSS images (searching for disturbed morphology). Seyfert 1 galaxy NGC 2782 was the only isolated object that showed a highly disturbed morphology, revealing a merger remnant (Torres-Flores et al. 2012, and reference there in). For this reason, we included this object in the sample of interacting Seyfert 1 galaxies. We also verified the correct Seyfert type classification of our sample. The only special case was the Seyfert galaxy NGC 7172. This object has historically been classified as a Sy2, because of the lack of broad lines in the optical spectrum. However, it has been shown recently that it has a broad component in the Paschen lines (Smajić et al. 2012). Following these authors, we consider this object as an extremely obscured Sy1.
In Table 1 we present the following information: (1) the object names, (2) the Spitzer programme identification (PID), (3) and (4) celestial coordinates, (5) B magnitudes, (6) redshifts, (7) type of Seyfert and (8) environment of our final list of AGN galaxies with archival low-resolution spectra from the Spitzer IRS.
3 DATA REDUCTION
The IRS observations cover the MIR bandpass from 5.2–38 μm. We downloaded the Basic Calibrated Data (BCDs) with the pipeline version S18.18.0 from the Spitzer Science Center (SSC) and we used the Spitzer IRS Custom Extraction (spice) software to extract the spectra. We used the staring-mode observation. The output of spice produces one spectrum per order at each nod position; these were combined using an idl (Interactive Data Language) procedure. For the subtraction of the background sky, we used two nodded observations along the slit of the same order in staring mode, applying standard iraf routines. We cleaned rogue pixels of the BCDs produced by the Spitzer pipeline using the irsclean software. We scaled the four moduli spectra using the measured flux of the long-wavelength order, which has the widest slit and is the least sensitive to pointing errors. For this purpose we developed an idl routine, which we also used to combine the spectra and correct the effect of the 14-micron teardrop. To correct the teardrop, the routine examines the excess in the 13.5–15 μm region, which is due to internal reflection. The correction was needed for the majority of the galaxies in our sample.
4 ANALYSIS
In order to calculate the silicate feature strengths, we measured the continuum over three fitting intervals: the short-wavelength interval of 5–7 μm, the intermediate interval (around 14 μm) and the long-wavelength interval of 26.5–31.5 μm. We used a cubic spline in logarithmic space over these fitting regions to determine the full continuum, following the methods suggested by Spoon et al. (2007) and Sirocky et al. (2008). According to these authors, the continuum fitted using a cubic spline resembles within 1 or 2 per cent the emergent continuum spectrum calculated using detailed modelling of synthetic ‘featureless dust’. The above intervals are adequate to fit the featureless continuum, since the dust absorption cross-section peaks around 10 and 18 μm (the well-known silicate features produced by dust). The intermediate interval is crucial to obtain a good fit because the cross-section has a local minimum around 14 μm, where the presence of silicate features is negligible (Thompson et al. 2009).
We developed an idl routine to obtain the continuum fits and silicate strength measurements. We used three different procedures for three different type of spectra: (1) ‘continuum-dominated spectra’, which show high-ionization emission lines of AGNs and weak PAH emission, (2) ‘PAH-dominated spectra’, showing strong PAH emission, and (3) ‘absorption-dominated’ spectra. Following Sirocky et al. (2008), we considered PAH-dominated spectra when the equivalent width in the 6.2-μm band was EW6.2 > 0.05 μm. The majority of Sy2 galaxies have PAH-dominated spectra (60 per cent), whereas the majority of Sy1 galaxies have continuum-dominated spectra (68 per cent). Our results are in agreement with previous works about the link between type 2 AGNs and higher rates of nuclear star formation inferred by the presence of PAHs (Tielens et al. 2004; Buchanan et al. 2006). We did not find any object with a continuum dominated by absorption.
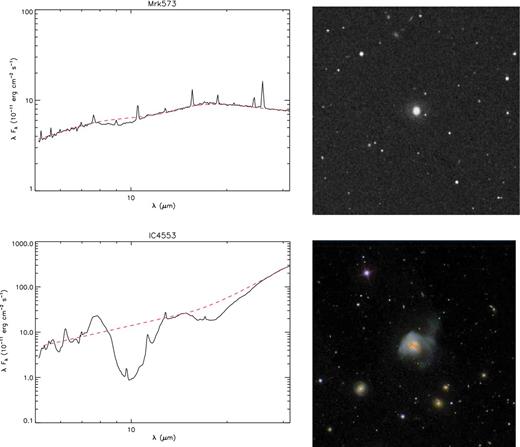
Examples of Sy2 spectra from the Spitzer IRS (black solid lines, left), the continuum-dominated spectrum of Mrk 573 (top) and the PAH-dominated spectrum of IC 4553 (bottom). The continuum fits are denoted by the black dashed lines. Also, this figure shows the NED image of Mrk 573 and SDSS image of IC 4553 (right), with no close companions in both cases.
Spectral measurements.
| Galaxy | S10 | λ10 | S18 | λ18 | Type | PAH-dominated | Dust distribution |
|---|---|---|---|---|---|---|---|
| Mrk 590 | 0.18 | 10.4 | 0.08 | 17.5 | Sy1 | No | Clumpy |
| ESO 548−G81 | 0.31 | 10.7 | 0.17 | 18.0 | Sy1 | No | Clumpy |
| NGC 2782 | −0.33 | 9.7 | 0.20 | 17.1 | Sy1 | Yes | Smooth |
| 1H1142−178 | 0.23 | 10.7 | 0.10 | 17.2 | Sy1 | No | Clumpy |
| Mrk 42 | −0.08 | 9.6 | 0.11 | 17.2 | Sy1 | Yes | Clumpy |
| UGC 7064 | −0.20 | 9.3 | 0.13 | 17.1 | Sy1 | Yes | Smooth |
| NGC 4235 | 0.34 | 12.6 | 0.24 | 16.9 | Sy1 | No | Clumpy |
| Mrk 50 | 0.24 | 10.8 | 0.37 | 18.3 | Sy1 | No | Clumpy |
| IISZ10 | 0.21 | 11.0 | 0.12 | 18.6 | Sy1 | No | Clumpy |
| NGC 5077 | 0.22 | 11.0 | 0.31 | 17.1 | Sy1 | No | Smooth |
| UM 614 | 0.17 | 10.7 | 0.16 | 17.2 | Sy1 | No | Clumpy |
| Mrk 279 | 0.14 | 11.1 | 0.03 | 18.3 | Sy1 | No | Clumpy |
| NGC 5548 | 0.14 | 11.4 | 0.06 | 17.2 | Sy1 | No | Clumpy |
| Mrk 290 | 0.20 | 11.0 | 0.09 | 18.1 | Sy1 | No | Clumpy |
| NGC 7172 | −1.84 | 9.8 | −0.29 | 18.6 | Sy1 | Yes | Smooth |
| Mrk 915 | 0.05 | 10.4 | 0.27 | 17.1 | Sy1 | No | Clumpy |
| UGC 12138 | −0.18 | 9.5 | 0.14 | 17.1 | Sy1 | Yes | Smooth |
| NGC 7469 | -0.16 | 9.7 | 0.12 | 17.2 | Sy1 | Yes | Smooth |
| NGC 7603 | 0.16 | 11.7 | 0.13 | 17.1 | Sy1 | No | Clumpy |
| Mrk 744 | −0.12 | 9.7 | 0.24 | 17.5 | Sy1.8 | Yes | Smooth |
| MCG –03–34–064 | −0.22 | 9.5 | 0.05 | 17.0 | Sy1.8 | No | Clumpy |
| UGC 1395 | −0.34 | 9.5 | 0.18 | 17.2 | Sy1.9 | Yes | Smooth |
| NGC 0454 | -0.57 | 9.9 | 0.06 | 16.7 | Sy2 | Yes | Smooth |
| NGC 526A | 0.15 | 11.3 | 0.08 | 18.9 | Sy2 | No | Clumpy |
| Mrk 573 | −0.10 | 9.4 | 0.04 | 17.2 | Sy2 | No | Clumpy |
| NGC 788 | −0.08 | 9.5 | 0.02 | 20.5 | Sy2 | No | Clumpy |
| IC 1816 | −0.42 | 9.3 | 0.08 | 17.2 | Sy2 | Yes | Smooth |
| ESO 417−G06 | −0.27 | 9.3 | 0.18 | 17.2 | Sy2 | No | Smooth |
| NGC 1358 | −0.30 | 9.5 | 0.00 | 17.1 | Sy2 | Yes | Clumpy |
| NGC 4939 | 0.30 | 10.6 | 0.00 | 18.0 | Sy2 | No | Clumpy |
| NGC 5347 | −0.22 | 9.4 | −0.04 | 18.8 | Sy2 | No | Clumpy |
| NGC 5427 | −0.12 | 10.3 | 0.30 | 17.6 | Sy2 | Yes | Smooth |
| NGC 5506 | −0.84 | 9.8 | −0.08 | 19.5 | Sy2 | Yes | Smooth |
| Mrk 686 | −0.27 | 9.73 | 0.23 | 17.4 | Sy2 | No | Smooth |
| NGC 5953 | −0.09 | 10.1 | 0.23 | 17.2 | Sy2 | Yes | Smooth |
| IC 4553 | −2.78 | 9.9 | −0.87 | 18.4 | Sy2 | Yes | Smooth |
| IC 5135 | −0.57 | 9.8 | 0.11 | 17.1 | Sy2 | Yes | Smooth |
| NGC 7682 | 0.05 | 10.2 | 0.19 | 17.2 | Sy2 | Yes | Clumpy |
| NGC 7743 | −0.29 | 9.3 | 0.32 | 17.1 | Sy2 | Yes | Smooth |
The main uncertainty in our measurements is the placement of the continuum. However, the error introduced by the uncertainties is small: the systematic differences due to the different assumptions are typically less 10 per cent.
5 RESULTS
For 13 out of 19 Sy1 galaxies, we found the silicate features in emission, albeit weak (Ssil > 0). Five objects have silicate absorption at 10 μm and emission at 18 μm. The only object showing strong absorption in both features is NGC 7172. As mentioned in Section 2, this is an extremely absorbed object, the broad lines of which are only seen in the NIR. Although the classification of this galaxy might be cumbersome, it does not affect our results. However, we note that this object is in interaction, which may explain the heavy obscuration and deep absorption silicate features (which indicate a smooth dust distribution, see below). Only three out of 17 Sy2s have both silicate features in emission and only three have both features in absorption. Our results are presented in Fig. 3, where the empty symbols correspond to isolated galaxies and the filled symbols to galaxies with one or more companions. In this plot, the triangles identify Seyfert 1, circles mark Seyfert 2, and squares designate Seyfert 1.8 and Seyfert 1.9 AGNs.
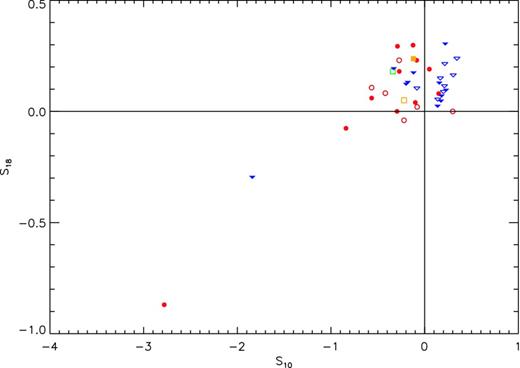
Measured strengths of the 10- and 18-μm silicate features (S10 versus S18). For 13 out of 19 Sy1 galaxies, we found the silicate features in emission, albeit weak (Ssil > 0). Only three out of 17 Sy2s have both silicate features in emission and only three have both features in absorption. Positive strength indicates emission (Ssil > 0) and negative strength indicates absorption (Ssil < 0). The triangles identify Seyfert 1, circles mark Seyfert 2, and squares designate Seyfert 1.8 and Seyfert 1.9 AGNs. The empty symbols are isolated galaxies and the fill symbols are galaxies with one or more companions.
The strength of the two silicate features is highly sensitive to the geometric distribution of the dust. Therefore, we used the ‘feature–feature’ diagram (S10 versus S18) proposed by Sirocky et al. (2008) to distinguish smooth distributions from clumpy ones (these two distributions of dust occupy different regions in the silicate feature plane). Fig. 4 presents the dust-distribution diagnostics of the sample. Our results indicate that the clumpy dust-distribution group contains 13 Sy1 and 8 Sy2, while the smooth dust distribution group contains 6 Sy1 and 12 Sy2.
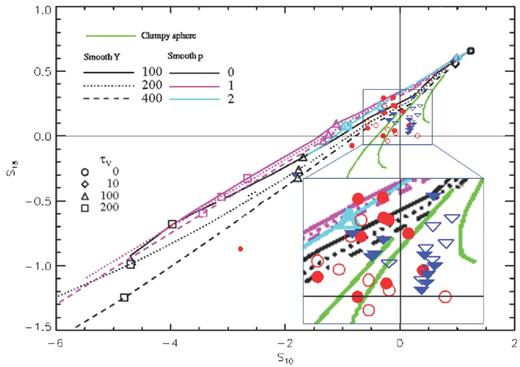
The ‘feature–feature’ diagnostic diagram of our Seyfert galaxies sample. This diagram shows the numerical simulation of silicate feature strengths around 10 and 18 μm using a spherical shell distribution of dust, cool and oxygen-rich silicates (OHMc) (Ossenkopf, Henning & Mathis 1992), computed by Sirocky et al. (2008). For clumpy models, each track represents the mean number of clouds N0 along the line of sight (N0 = 1, 3 and 5 from upper right to lower left, respectively), with Y = 30, which is the shell thickness, and p = 0, where the radial density profile is proportional to r−p. For smooth models, the line style shows different shell thickness, Y, and the colour shows the radial density profile, p. Black open symbols indicate total optical depth τv. For our sample of galaxies, we used triangles to identify Seyfert 1 AGNs and circles to identify Seyfert 2 AGNs. The empty symbols are isolated galaxies and the fill symbols are galaxies with one or more companions.
Considering the environment, we find that all of the isolated Sy1 galaxies have clumpy dust geometric distribution, whereas the Sy1s with a close companion can have either clumpy or smooth dust distributions. In the case of Sy2 galaxies, the results are opposite. Those with one or more companions have mostly smooth dust distributions, whereas for those without companions their dust distribution can be either smooth or clumpy. Fig. 5 shows a histogram where the difference in the dust distribution as a function of environment and Seyfert type can be clearly appreciated.
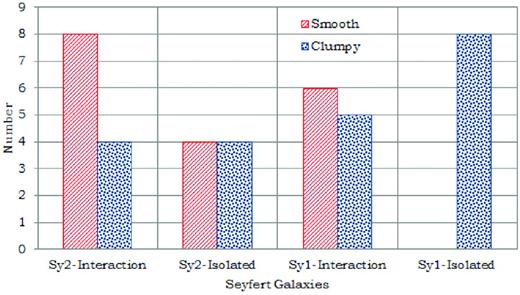
Histogram of our sample of Seyfert galaxies in interaction and non-interaction and their geometric distribution of dust. From this histogram it is clear that all of the isolated Sy1 galaxies have clumpy dust distributions, whereas the Sy1s with at least one close companion can have either clumpy or smooth dust distributions. In contrast, two-thirds of Sy2s with one or more close neighbours have smooth distributions, whereas isolated Sy2s have equal numbers of clumpy or smooth dust distributions.
6 DISCUSSION
Based on IRS/Spitzer observations, we have found two different circumnuclear dust geometric distributions in our sample of Seyfert galaxies. From Fig. 5, it is clear that Sy2s and Sy1s have somewhat different dust distributions. Overall, Seyfert 1 galaxies tend to have clumpy dust distributions, whereas the dust distributions of Sy2s are more evenly distributed between smooth and clumpy. This result is in agreement with those by Sirocky et al. (2008).
In terms of the environment also, there are striking differences in the dust distributions. Only nine out 23 interacting galaxies have clumpy dust. On the other hand, only four out of 16 isolated Seyferts have smooth distributions. Furthermore, there is a clear convolution between the interaction, Seyfert type and dust distribution. This is clear from Fig. 5, where it can be observed that all isolated Sy1 galaxies have clumpy dust distributions, whereas the Sy1s with at least one close companion can equally likely have clumpy or smooth dust distributions. In contrast, two-thirds of Sy2s with one or more close neighbours have smooth distributions, whereas isolated Sy2s have clumpy or smooth dust distributions.
How can the environment influence the dust distribution and the Seyfert type? The presence of a close neighbour may produce a tidal perturbation that in turn may induce a steady inflow of gas and dust into the nuclear region. This flow of material towards the centre will have a smooth dust geometry, which explains why the majority of interacting Seyferts have smooth dust distributions. There are, of course, other possible non-axisymetrical tidal perturbations that can induce such infall. This may explain the fact that some isolated galaxies also have smooth dust distributions.
In this scheme, the interaction is responsible for driving the gas towards the centre and this infall ignites star formation activity (Ellison et al. 2010) and feeds the supermassive black hole. At this stage, the dust covering factor of the AGN is nearly 1 and a smooth dust distribution is expected. As the starburst dies off, an initial composite Seyfert 2 + starburst nucleus evolves into an obscured Seyfert galaxy, which could be seen as Sy1 or Sy2 depending on the covering factor of the dust torus as well as the orientation (assuming there is indeed a broad-line region, which is not always the case). The nucleus would be observed with an older stellar population (Boisson et al. 2000). Thus, in this scenario, inclination/obscuration effects are indeed present, but only during the last phase of the above evolutionary sequence (see also Koulouridis et al. 2006a, 2007). The scenario is further supported by other works, which show that recent circumnuclear star-forming regions are present more frequently in type 2 than in type 1 AGNs (Maiolino et al. 1997; Gu et al. 2001; Coldwell et al. 2009). Recent studies by Castro et al. (2014) also support it, at least for low-luminosity AGNs. The sequence has also been observed for low-ionization nuclear emission-line region galaxies (LINERs) (Krongold et al. 2003), ultraluminous infrared galaxies (ULIRGs) and quasars (e.g. Haas et al. 2003; Fiore et al. 2008), suggesting that it is luminosity-independent. Further evidence in favour of this sequence is found in Villarroel, Korn & Matsuoka (2012), Kollatschny, Reichstein & Zetzl (2012) and Koulouridis et al. (2013). The evolutionary scheme can also explain the high frequency of starbursts and Sy 2 nuclei observed in close interacting systems, as well as the lack of type 1 nuclei (e.g. González et al. 2008) for interacting pairs and compact groups (Martínez et al. 2008; Bitsakis et al. 2010).
The torus covering factor changes along the proposed evolutionary sequence. In the early stages, if an AGN exists, it is obscured from all or most lines of sight. As the SB evolves, the dust inflow decreases, its distribution flattens (Haas et al. 2003) so that more of the sky – as seen from the central engine – is uncovered and the covering factor diminishes. Thus the probability of detecting the AGN increases over time.
According to Elitzur (2012), increased clumpiness of the dust over time would enable this, because when the dust distribution becomes more patchy it becomes easier to detect the AGN. This ‘realistic unification’ (Elitzur 2012) takes the clumpiness of the torus into account and suggests that there is a smooth distribution in its covering factor. Type 2 AGN are more likely to be drawn from the higher end distribution of the dust covering factor and this suggestion has received some observational support (e.g. Ramos Almeida et al. 2009, 2011).
Our evolutionary scenario is compatible with this ‘realistic unification’. At early stages, most objects will be type 2s and the probability of observing the interacting neighbour is high. Then both types 1 and 2 may be found, depending on orientation (‘unification stage’). At the later stage, we see mostly type 1 objects, because it becomes easier to detect the BLR. Also at this later stage, the probability of seeing the companion has diminished, because the companion has either fled away or merged, leaving no trace of the process.
7 CONCLUSION
We have analysed a sample of Sy1 and Sy2 galaxies, both isolated and in interaction, observed by Spitzer. We found that all of the isolated Sy1s have clumpy dust distributions, while the interacting Sy1s have both clumpy and smooth dust distributions. On the other hand, the dust distributions of isolated Sy2s can be either smooth or clumpy, whereas the majority of interacting Sy2s have smooth dust distributions. This indicates a connection between the presence of a close companion and the distribution of the circumnuclear dust in Seyfert galaxies. These findings can easily be explained in the context of an evolutionary sequence for Seyfert galaxies (Krongold et al. 2002, 2003), as explained in the discussion. This sequence is also observed at higher luminosities (Sanders et al. 1988a,b; Haas et al. 2003; Fiore et al. 2008), from mergers to ULIRGs to quasars, and suggests that the dust distribution is strongly influenced by gravitational interactions.
SMC acknowledges a graduate student scholarship from CONACYT. DD acknowledges support from grant IN107313 from PAPIIT, UNAM. This work is based on observations made with the SpitzerSpace Telescope and has made use of the NASA/IPAC Extragalactic Database, both of which are operated by the Jet Propulsion Laboratory, California Institute of Technology, under contracts with NASA. Funding for the SDSS and SDSS-II has been provided by the Alfred P. Sloan Foundation, the Participating Institutions, the National Science Foundation, the U.S. Department of Energy, the National Aeronautics and Space Administration, the Japanese Monbukagakusho, the Max Planck Society, and the Higher Education Funding Council for England. The SDSS Web Site is http://www.sdss.org/.
The SDSS is managed by the Astrophysical Research Consortium for the Participating Institutions. The Participating Institutions are the American Museum of Natural History, Astrophysical Institute Potsdam, University of Basel, University of Cambridge, Case Western Reserve University, University of Chicago, Drexel University, Fermilab, the Institute for Advanced Study, the Japan Participation Group, Johns Hopkins University, the Joint Institute for Nuclear Astrophysics, the Kavli Institute for Particle Astrophysics and Cosmology, the Korean Scientist Group, the Chinese Academy of Sciences (LAMOST), Los Alamos National Laboratory, the Max-Planck-Institute for Astronomy (MPIA), the Max-Planck-Institute for Astrophysics (MPA), New Mexico State University, Ohio State University, University of Pittsburgh, University of Portsmouth, Princeton University, the United States Naval Observatory, and the University of Washington.
