


Abstract
The annihilation of dark matter particles in the halo of galaxies may end up into γ-rays, which travel almost unperturbed till to their detection at the Earth. This annihilation signal can exhibit an anisotropic behaviour quantified by the angular power spectrum, whose properties strongly depend on the dark matter distribution and its clumpiness. We use high resolution pure dark matter N-body simulations to quantify the contribution of different components (main halo and satellites) to the global signal as a function of the analytical profile adopted to describe the numerical results. We find that the smooth main halo dominates the angular power spectrum of the γ-ray signal up to quite large multipoles, where the subhaloes anisotropy signal starts to emerge, but the transition multipole strongly depends on the assumed radial profile. The extrapolation down to radii not resolved by current numerical simulations can affect both the normalization and the shape of the γ-ray angular power spectrum. For the subhaloes described by an asymptotically cored dark matter distribution, the angular power spectrum shows an overall smaller normalization and a flattening at high multipoles. Our results show the criticality of the dark matter density profile shape in γ-ray anisotropy searches, and evaluate quantitatively the intrinsic errors occurring when extrapolating the dark matter radial profiles down to spatial scales not yet explored by numerical simulations.
1 INTRODUCTION
One of the most reliable solutions to the missing mass in the Universe implies that it is constituted by weakly interacting massive particles (WIMPs), clustered in galaxies as dark haloes. The astrophysical evidence of these particle dark matter (DM) candidates can be explored by direct as well as indirect detection techniques. In the latter case, the idea is that WIMP DM may annihilate in pairs and produce charged particles and γ-rays, detectable as rare components in cosmic rays. Differently from the charged cosmic rays, the flux of γ-rays arriving at the Earth is not deflected by magnetic fields and traces back directly to its sources. The search for DM through γ-rays is therefore a preferential tool for exploiting the properties of its spatial distribution (Bringmann & Weniger 2012, and references therein).
The excellent performances of the Large Area Telescope (LAT) on the Fermi Gamma-ray Space Telescope (Fermi) have let the exploration for a DM component in the Milky Way, in extragalactic nearby objects, as well as in cosmological structures (Abdo et al. 2010; Ackermann et al. 2010a,b, 2011, 2012a). At high Galactic latitudes, a faint γ-ray irreducible emission has been measured, and shown to be isotropic at a high degree (Ackermann et al. 2012b). The Fermi-LAT has already reported the detection of a non-zero angular power spectrum (APS) above the noise level in the multipole range ℓ ∼ 155/504, corresponding to an angular scale ≲2°, with a significance ranging from 5.3σ between 2 and 5 GeV to 0.8σ between 10.4 and 50 GeV (Ackermann et al. 2012b).
Different predictions for the APS have been proposed for various populations of unresolved sources, both of astrophysical (Siegal-Gaskins et al. 2011; Cuoco, Komatsu & Siegal-Gaskins 2012; Harding & Abazajian 2012) and of DM origin (Siegal-Gaskins 2008; Fornasa et al. 2009, 2013; Ando & Komatsu 2013). Since it is expected that the statistical properties of the DM distribution in galactic and extragalactic space are different from those of standard astrophysical objects, the study of the APS ascribable to DM sources may be an important signature worth to be explored.
The intensity of the γ-ray signal depends on a particle physics term – describing the strength and the energy spectrum of the annihilation – and on the DM density in collapsed structures. While the first factor includes the details of the assumed particle physics model for the WIMPs, the second one has an astrophysical origin and it is usually modelled according to the results of cosmological collisionless simulations, generally predicting a steepening of the DM profile in the inner parts of the resolved haloes (e.g. Diemand, Kuhlen & Madau 2008; Springel et al. 2008 and references therein). Therefore, the most likely detectable targets have been identified with especially dense regions such as the Galactic centre (Ackermann et al. 2013; Gómez-Vargas et al. 2013), and the centre of any DM substructure orbiting in the Milky Way halo, like faint and ultrafaint dwarf galaxies (Walker et al. 2011; Ackermann et al. 2014).
The APS gives the measure of a signal correlation between two angular scales, and, in turns, between two spatial scales. For a source located at the galactic centre, like the main halo of the Milky Way, the APS at multipoles, for example, ℓ > 500 probes the DM distribution at |$R < \pi /500\times 8.5\, \rm kpc\sim 40\, \rm pc$|. The study of the APS at l ≳ 500 requires therefore to know the DM profile at scales much below the resolution (∼200 pc) of current state of the art numerical simulations for structure formation (Diemand et al. 2008; Springel et al. 2008; Stadel et al. 2009). Several profile parametrizations provide excellent fits to the DM distribution of simulated haloes (Navarro, Frenk & White 1996; Navarro et al. 2004; Graham et al. 2006; Macciò, Dutton & van den Bosch 2008; Stadel et al. 2009). However, when extrapolated below the resolution limit of cosmological simulations, different profiles predict very different central densities.
In this paper we discuss in detail these points when applied to the anisotropy in the γ-ray flux from DM annihilation, namely (i) the intrinsic uncertainty due to the extrapolation to short distances of the DM distribution determined from numerical simulations; (ii) the different signatures in the APS in connection with the various density profiles (cored and cuspy).
2 THE γ-RAY FLUX FROM DM ANNIHILATION
2.1 Simulations for the DM spatial distribution
The simulations presented in this paper are the pure DM N-body counterparts of the Making Galaxies in a Cosmological Context (MAGICC) simulations suite (see Stinson et al. 2013; Di Cintio et al. 2014 for more details). The galaxy we discuss in details is g15784, which has a virial mass of 1.48 × 10¹² M⊙, very close to the mass of the Milky Way (Xue et al. 2008). We resolve a total of 27 substructures in the simulation in a mass range of 108.6–109.6 M⊙.
For determining the γ-ray emission, as clear from equation (1), a special role is deserved to the radial density profile of the DM halo ρ(r), with particular attention to the central region. This is true both for the central smooth halo as well as for the substructures.
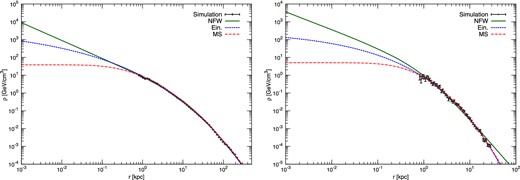
DM density profile as a function of the radius r from the centre of the halo. The left-hand panel displays the results for the main halo, the right-hand panel for a subhalo resolved in the simulation g15784. The simulation data are shown by black dots, while the different profiles described in equations 2 (NFW), 3 (Ein) and 4 (MS), and their extrapolation to smaller scales, are shown by the red solid, blue dotted and green dot–dashed lines, respectively.
These simple plots show how problematic (and dangerous) it is the extrapolation of cosmological N-body simulations results on very small spatial scales. As we will see in the rest of the paper, this extrapolation has profound effects on the predicted γ-ray DM signal and the relative contribution of different components like the central halo and its satellites to the APS.
2.2 The angular power spectrum of γ-ray anisotropies
3 RESULTS
We have computed the space distribution of the γ-ray emission from DM annihilation based on the g15784 halo simulation, described in Section 2.1. The resulting simulated sky is illustrated in Fig. 2, where we plot the γ-ray emission maps at Eγ = 4 GeV, from a DM halo composed of WIMPs with mχ = 200 GeV (see Section 2 for details). In the left-hand panels, the main halo and the subhaloes are interpreted with the Ein DM spatial distribution in equation (3), while the right-hand panels show the same halo when described by the MS ρ(r) (equation 4). The colour code refers to the intensity of the map and goes from blue to red with increasing flux, with different scales for the main halo and the substructures. The emission from the smooth component (top panels), as expected, extends at larger radii for the MS parametrization, while it is more concentrated in the centre for the Ein profile, given the steeper behaviour towards the centre of the galaxy. The same argument applies to each subhalo of the simulation: when interpreted as distributed according to the Ein profile, the most of the γ-ray emission of each subhalo mainly originates from the very centre of the substructure, while in the case of MS the emission is distributed over a larger region, rightly because the core of the DM profile is more extended.
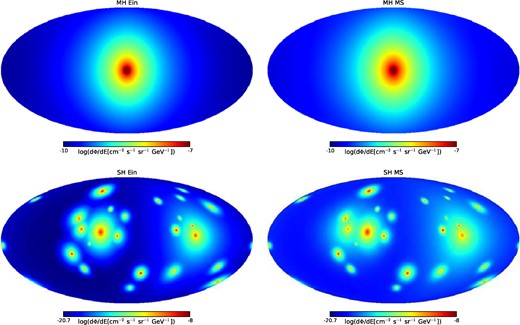
All-sky maps of the γ-ray emission at Eγ = 4 GeV, from the annihilation of mχ = 200 GeV DM in the simulated galactic halo g15784. In the left-hand (right-hand) panels the main smooth halo (MH, upper plot) and subhaloes (SH, lower plots) are interpreted with the Ein (MS) radial density profile, equations 3 (equation 4).
We have calculated the intensity APS for the all-sky γ-ray maps of the simulated galaxy, for both the smooth halo and the resolved substructures. The γ-ray intensity in a given direction is obtained by piling up the contribution from all subhaloes encountered along the l.o.s., up to a distance of 500 kpc. The results are shown in Fig. 3, where the intensity APS for the main halo and the subhaloes is described, alternatively, by the parametrizations of equations (3) and (4). The figure has been obtained setting the healpix resolution k = 13. The halo, when interpreted in terms of the peaked Ein profile, yields much more power at small radial scales (high l), and this is true for both the smooth halo and the subhaloes. The two profiles give comparable APS only for l ≲ 10, while at l = 100 the Ein APS is about two orders of magnitude higher than the MS one. At very small scales, such as l = 1000 or, equivalently ∼30 pc, the main halo within the MS profile does not contribute any longer to the anisotropy of the sky, while the Ein profile still provides a sizable APS (about eight orders of magnitude above the MS contribution). For illustrative purposes, we also plot the intensity APS for the main smooth halo interpreted in terms of a NFW ρ(r) (which indeed fails to properly fit the simulated subhaloes). The implied APS is very high at all scales, even with respect to the Ein modelling. At l = 1000, the cuspiness of the NFW profile gives an APS 100 times more intense than for the Ein model.
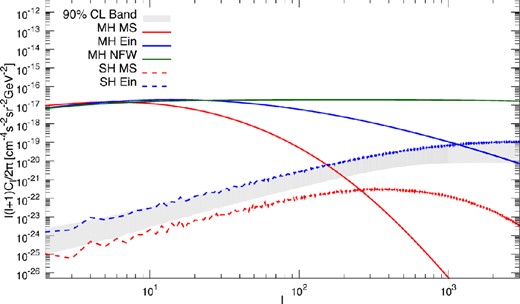
Intensity APS for the simulated halo g15784, as a function of the multipole number. The solid blue (red) line describes the smooth halo according to the Ein (MS) profile, while the dotted lines are for the corresponding subhaloes contribution. The green solid line displays results for an NFW profile fitting the smooth halo. The grey band refers to the 90 per cent confidence level uncertainty related to the orientation of the subhaloes of the g15784 simulation.
As to the subhaloes contribution, again the APS is much milder in the case of the cored MS profile than the Ein one. At l = 1000, the APS for the two models differs by more than two orders of magnitude. In the case of Ein profile, the emission from the clumps is very anisotropic and similar to the emission of a point-source population, while in the case of the cored MS profile the γ-ray flux from each halo is more smoothly distributed over its radial dimension. The result is that the APS of the substructures for the Ein profile is more concentrated in the centre, i.e. higher in normalization, with respect to the MS one since the clumps, appearing more as point like, inject more power at all scales. This can also be understood by inspecting the all-sky γ-ray maps (see Fig. 2): comparing the Ein and MS parametrization it is clear that the emission from the MS profile is more isotropic on the sky than the Ein one. The subhaloes APS trend for the Ein and MS profiles is very similar up to l ≃ 100, the former being stronger by a factor of 15–20. Both curves grow proportionally to l2 as typically expected for a population of point-like sources. For higher multipoles, the APS starts to flatten because the central part of the subhaloes starts to be resolved (Ando 2009). This property is striking for the MS case, for which the subhaloes Cl spectrum flattens around l ≃ 400 and then decreases significantly. Indeed the core of the substructures is, on average, ∼1.5 kpc which corresponds to a multipole ℓ ∼ 300 for a source at ∼200 kpc as it is the average distance of the clumps in the g15784 simulation. The flattening for the Ein case is much milder and occurs at smaller scales because within this profile the core is less pronounced.
As clear from Fig. 3, the APS yielded by the Ein profile is dominated by the smooth halo up to l ≃ 1000. At variance, the same galactic halo interpreted in terms of the MS radial profile yields an APS for the subhaloes which dominates over the smooth halo for ℓ ≳ 250. In principle, future observations of the shape of the APS ascribable to DM will allow to explore the distribution of galactic DM at scales smaller than the resolution of N-body simulations. The study of high-multipoles anisotropies – achievable by the next generation of Cherenkov telescopes such as Cherenkov Telescope Array (CTA; Ripken et al. 2014) – might help in the debate about the real shape of the DM distribution in the centre of the galaxies, and in particular of the Milky Way. We also notice that the computation of the APS relies on the full γ-ray sky maps and, thus, does not mask any part of the sky that would be required in order to compare our prediction with the Fermi-LAT results.
In order to verify the role of the orientation of the subhaloes on the APS of the g15784 simulation, we have generated about 850 Monte Carlo realizations in which we have randomly assigned the latitude and longitude of each original subhalo, while keeping fixed the distance. The corresponding 90 per cent confidence level uncertainty band for the Ein parametrization of the subhaloes is shown by the grey band in Fig. 3 (we have verified that the simulated Cℓ distribute normally). The fact that the APS of the g15784 simulation stands in the upper edge of the band is somewhat expected, since subhaloes in a DM-only simulation are usually distributed anisotropically and are preferentially located along the major axes of the triaxial mass distributions of their hosts (e.g. Zentner et al. 2005). By randomizing their positions we tend to go towards a more isotropic distribution that differs from the original simulated one.
Finally, we have inspected the effect of subhaloes smaller than the ones obtained in the present cosmological simulation. Fig. 4 depicts the APS computed for the set of subhaloes resolved by the g15784 simulation (same as in Fig. 3), again interpreted both within Ein and MS DM profiles. In addition, we also report the APS generated by a realization of our Monte Carlo simulation based on the Aquarius Aq-A-1 results (Springel et al. 2008). For this purpose, we used the spatial, mass and concentration distributions for the clumps population given by Pieri et al. (2011), and we assume the DM profile in both the main halo and the subhaloes to follow the Ein parametrization with αE = 0.18. For an easier comparison, we show the APS for different mass ranges: 105.23–109.6, 105.23–108.6 and 108.6–109.6 M⊙. The more massive haloes lead to the flattening of the APS at large multipoles, as expected, while the contribution of the substructures lighter than 108.6 M⊙ is slightly more Poisson like, and dominates the total APS, which results to be more intense because of this additional component. Given the uncertainties in extrapolating the mass–concentration relation beyond the resolution of the simulations (Ludlow et al. 2009; Sanchez-Conde & Prada 2013), we decided not to consider masses smaller than the Aquarius Aq-A-1 resolution (∼105 M⊙).
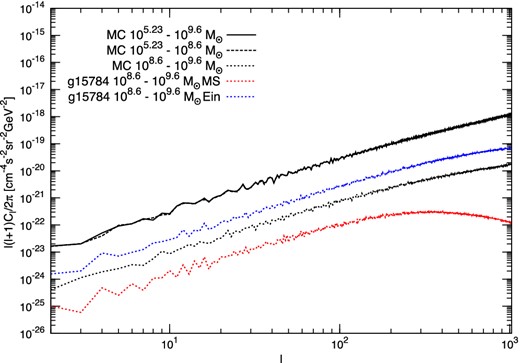
Intensity APS computed for the subhaloes resolved by the g15784 simulation, when the DM density profile is interpreted with an Ein (upper blues solid line) or a MS profile (lower red solid line). We also plot the results from a Monte Carlo (MC) realization based on Aquarius Aq-A-1 simulation for subhaloes having masses in the range 105.23–109.6 (black solid line), 105.23–108.6 (black dashed line) and 108.6–109.6 M⊙ (black dotted line).
In the present analysis we have not included any contribution from DM in extragalactic structures. As discussed in Fornasa et al. (2013) (see also Sefusatti et al. 2014), the contribution from extragalactic DM haloes and subhaloes that are not resolved by N-body simulations leads to about two orders of magnitude uncertainty on the predicted level of the extragalactic energy spectrum, which may result as the dominant or the subdominant component of the total energy spectrum. Similarly, the intensity APS can receive a significant or a negligible contribution from extragalactic (sub)structures.
4 CONCLUSIONS
We have calculated the intensity APS of the γ-ray flux from DM annihilation in the halo of a Milky-Way-like galaxy, employing the original results from recent numerical simulations of structure formation, which predict the DM phase space and its clustering into subhaloes. The simulated galactic halo and its subhaloes can be equally well interpreted in terms of a peaked Ein as well as an asymptotically cored MS radial DM profile.
We show here that the different parametrizations for the DM density distribution lead to very different predictions for the γ-ray intensity APS. The DM halo and subhaloes, when interpreted in terms of the peaked Ein profile, yield much higher APS at small radial scales (high l) than the cored MS ρ(r). The two profiles give comparable APS for the main halo only for l ≲ 10, while at l = 100 the Ein APS is about two orders of magnitude higher than the MS one. At very small scales, l ≃ 1000, the main halo within the MS profile does not contribute any longer to the anisotropy of the sky, while the Ein profile still provides a sizable APS (about eight orders of magnitude above the MS contribution). We have also proven that the subhaloes APS are significantly lower for the MS case. Indeed, the APS of the substructures described by the Ein profile is higher than the MS one since the subhaloes, appearing as point-like sources, inject more angular power at almost all scales.
Our results demonstrate that the extrapolation of the radial DM profile down to radii not proven by cosmological simulations is especially dangerous when dealing with the search for anisotropies in the γ-ray emission. The results for the APS at high multipoles may differ by huge amounts by a mere re-interpretation of the simulated haloes with a different DM radial density distribution. Furthermore, depending of the assumed profile, it may occur that the subhaloes give a peculiar signature in the APS or, at variance, that the main halo dominates at all multipoles the γ-ray emission. In the latter case, the APS signature for DM annihilating in the galactic halo is significantly weakened.
As a final comment, we underline the caution in adopting extrapolated DM profiles when dealing with anisotropy searches, and emphasize the need for a better knowledge of the distribution of the DM in its clustered structures, especially taking into account the possible effects of baryonic matter (e.g. Macciò et al. 2012b; Di Cintio et al. 2014). On the other hand, γ-ray anisotropy analysis will turn out to be crucial for probing the spatial DM distribution in the Galaxy. Indeed, high multipoles measurements will probe scales well beyond the simulations’ resolution and will help in discriminating the DM profile at very small radii.
We acknowledge E. Borriello for the discussions during the first stages of this work and H. Zechlin for a careful reading of the manuscript. Moreover, we are grateful to the anonymous referee for having suggested us interesting developments of the discussion. FC acknowledges support from the German Research Foundation (DFG) through grant BR 3954/1-1 and, for the latest stage of this work, from the European Research Council through the ERC starting grant WIMPs Kairos, PI: G. Bertone. FC is grateful to S. Ando, T. Bringmann, D. Horns and H. S. Zechlin for useful and stimulating discussions. VDR acknowledges support from the EU Network grant UNILHC PITN-GA-2009-237920 (Universidad de Valencia) for the first stages of this work and from the EU FP7 ITN INVISIBLES (Marie Curie Actions, PITN-GA-2011–289442). AVM acknowledges the support from the Sonderforschungsbereich SFB 881 ‘the Milky Way System’ (subproject A1) of the DFG. JH received funding from the European Research Council under the European Union's Seventh Framework Programme (FP 7) ERC Grant Agreement no. [321035]. For the analysis we used the ‘Amiga Halo Finder’ (ahf, popia.ft.uam.es/AHF/) for identifying haloes and the pynbody package (github.com/pynbody/pynbody/) for their analysis.
