-
PDF
- Split View
-
Views
-
Cite
Cite
Nicola Pastorello, Duncan A. Forbes, Caroline Foster, Jean P. Brodie, Christopher Usher, Aaron J. Romanowsky, Jay Strader, Jacob A. Arnold, The SLUGGS survey: exploring the metallicity gradients of nearby early-type galaxies to large radii, Monthly Notices of the Royal Astronomical Society, Volume 442, Issue 2, 1 August 2014, Pages 1003–1039, https://doi.org/10.1093/mnras/stu937
Close - Share Icon Share
Abstract
Stellar metallicity gradients in the outer regions of galaxies are a critical tool for disentangling the contributions of in situ and ex situ formed stars. In the two-phase galaxy formation scenario, the initial gas collapse creates steep metallicity gradients, while the accretion of stars formed in satellites tends to flatten these gradients in the outskirts, particularly for massive galaxies. This work presents the first compilation of extended metallicity profiles over a wide range of galaxy mass. We use the DEep Imaging Multi-Object Spectrograph spectrograph on the Keck telescope in multislit mode to obtain radial stellar metallicity profiles for 22 nearby early-type galaxies. From the calcium triplet lines in the near-infrared, we measure the metallicity of the starlight up to 3 effective radii. We find a relation between the outer metallicity gradient and galaxy mass, in the sense that lower mass systems show steeper metallicity gradients than more massive galaxies. This result is consistent with a picture in which the ratio of ex situ to in situ formed stars is lower in less massive galaxies as a consequence of the smaller contribution by accretion. In addition, we infer a correlation between the strength of the calcium triplet feature in the near-infrared and the stellar initial mass function slope that is consistent with recent models in the literature.
1 INTRODUCTION
Until recently, galaxy formation scenarios fell either into the category of monolithic collapse or hierarchical merging. The first scenario assumes that early-type galaxies (ETGs) formed in a single violent burst of star formation at high redshift, followed by a largely quiescent evolution with few, if any, further star formation episodes (Larson 1974; Carlberg 1984; Arimoto & Yoshii 1987). By contrast, under the second scenario, larger galaxies are thought to have been built up via successive mergers of smaller systems (Toomre & Toomre 1972). Such merger events are supposed to happen continuously during a galaxy's entire history.
1.1 The two-phase formation scenario
Recently a new paradigm has emerged for the formation of massive ETGs, the two-phase formation scenario, which could be considered as a hybrid option between the monolithic collapse and the hierarchical merging models. This scenario is increasingly supported both by theory and by observations, as detailed below.
In this two-phase picture, the first phase occurs early (z > 2) and forms the bulk of the stars through the dissipative collapse of gas. These stars are born in situ and their formation is driven by the infall of cold gas flows (De Lucia & Blaizot 2007; Dekel, Sari & Ceverino 2009; Khochfar & Silk 2009; Zolotov et al. 2009) or by the cooling of hot gas (Font et al. 2011).
The second phase involves the accretion of stars formed in smaller satellite galaxies (i.e. ex situ). This star formation may continue to the current time in these satellite galaxies, regardless of their mass, although they are usually gas poor at the time of merging (Oser et al. 2010). In general, the merging satellite systems have a mass that is much lower than the main galaxy, with a typical mass ratio of 1:5 (Oser et al. 2012). The accreted systems are added at radii larger than the effective radius Re (Naab, Johansson & Ostriker 2009; Font et al. 2011; Navarro-González et al. 2013), thus increasing the size of the main galaxy (Naab et al. 2009; Oser et al. 2012; Hilz et al. 2012; Hilz, Naab & Ostriker 2013). This gas-poor (dry) accretion phase dominates the galaxy evolution at z < 2.
Observationally, hints of two different formation modes in the Milky Way were first presented by Searle & Zinn (1978). In their work, they inferred that the inner halo globular clusters (GCs) formed during the collapse of the galaxy central regions, while in the outer halo GCs were accreted. Further evidence supporting two-phase formation has been found from GC systems in nearby galaxies (e.g. Arnold et al. 2011; Forbes et al. 2011).
1.2 Stellar metallicity gradients
1.2.1 Predictions from the two-phase formation scenario
The formation of galaxies in two phases affects their metallicity ([Z/H]) gradients. Simulations have shown that in situ formation leads to steep gradients (Kobayashi 2004; Pipino et al. 2010). However, strong AGN feedback can interrupt star formation, causing a flattening of the inner metallicity gradient (Hirschmann et al. 2012).
On the other hand, mixing due to mergers of already formed stellar populations (i.e. ex situ formation) will modify the metallicity profile (White 1980; Kobayashi 2004; Di Matteo et al. 2009; Font et al. 2011) in the regions where these processes dominate (i.e. the outer regions). The final metallicity gradients in these outer regions are predicted to show a trend with galaxy mass, with lower mass galaxies having steeper outer metallicity profiles than higher mass systems. Low-mass galaxies accrete stars mostly from metal-poor low-mass satellites (Naab et al. 2009; Lackner et al. 2012; Hirschmann et al. 2013), while the satellites that merge with more massive galaxies are composed, on average, by more metal-rich stellar populations, which will flatten the metallicity profiles in the outer regions. If the mergers are gas rich, this will mostly affect the metallicity only in the central regions because the gas will sink towards the galaxy centre where it will trigger new star formation, increasing the inner metallicity gradient.
Thus, with two phases (i.e. dissipative collapse and external accretion) in the formation history of a galaxy, a transition region is expected between the in situ central and the ex situ outer regions (see e.g. fig. 8; Font et al. 2011).
1.2.2 Observations of inner metallicity gradients
The metallicities in the central regions of ETGs have been studied over the years by many different groups, adopting both photometric (i.e. colours) and spectroscopic (e.g. absorption line indices) approaches. Hints of a relation between the inner (i.e. R < 1Re) metallicity gradient and galaxy mass have been found in a number of studies (Carollo, Danziger & Buson 1993; Forbes, Sánchez-Blázquez & Proctor 2005; Ogando et al. 2005), with increasingly steeper gradients in more massive galaxies. Sánchez-Blázquez et al. (2007), Spolaor et al. (2009, 2010) and Kuntschner et al. (2010) found that such a relation may be valid only for galaxy masses lower than ≈3.5 × 10¹⁰ M⊙, while the trend is the opposite for greater masses (i.e. shallower profiles in higher mass galaxies). The pioneering work of the SAURON Collaboration, using integral field unit (IFU) technology, produced detailed stellar population maps for 48 nearby ETGs up to 1Re (Kuntschner et al. 2010). In addition to the very valuable 2D spatial metallicity information, their maps confirmed the relation between metallicity gradients and galaxy mass. By contrast, Koleva et al. (2011) did not find the same trend connecting metallicity gradient with galaxy mass.
The limitation of studies confined to the central parts of ETGs is that they give information predominantly about the stars formed in situ (and are a mix of those formed during an initial collapse or by later wet mergers). In contrast, outer gradients provide a clearer test of the galaxy formation history as they are sensitive to ex situ formed stars.
1.2.3 Observations of outer metallicity gradients
Photometric metallicities can be used to extend coverage to larger galactocentric radii, and colours are relatively easy to obtain, but there are serious limitations, as discussed below. The work by Prochaska Chamberlain et al. (2011) measured the average metallicity gradient in a set of lenticular galaxies via the photometric approach out to more than 5Re. They did not find any correlation of metallicity gradient with galaxy mass, although their metallicity gradient confidence limits were large enough to include both shallow and very steep metallicity trends (i.e. ∇R[Z/H] = −0.6 ± 0.5 dex dex− 1).
A more radially extended study of ETGs in the Virgo Cluster by Roediger et al. (2011) found flat metallicity profiles for the massive galaxies and much steeper mean metallicity gradients in dwarf elliptical galaxies. They found no obvious trend with galaxy mass for either galaxy type. Also using colours, La Barbera et al. (2012) found that metallicity profiles are steep in the outer regions (i.e. 1 < R < 8Re) of both high-mass and low-mass ETGs. However, while for the low-mass ETGs this trend is significant, the gradients in the high-mass ETGs could be affected by a decrease of [α/Fe] at large radii, which is not constrained separately from the metallicity in their work. La Barbera et al. (2012) explained such results as a consequence of the accretion of mostly low-metallicity stars in the outskirts of both giant and low-mass galaxies. In contrast, Montes 2014 found a plateau in the outer radial metallicity profile of the massive galaxy M87 out to almost 5 ∼ Re.
The main problem with optical photometric studies is the strong age–metallicity degeneracy which, unless there is a homogeneously old stellar population within a galaxy, can lead to wrongly inferred metallicities (Worthey 1994; Denicoló et al. 2005a). In addition, the colour may be affected by dust reddening and the ‘red halo’ effect. This latter issue is a consequence of the dependence on wavelength of the shape of the outer wing of the PSF and affects measurements of the external regions of extended objects (see Michard 2002 and references therein). Thus, although colour-based analyses allow estimates of the galaxy metallicity to large radii, a clean separation between age and metallicity is best obtained by spectroscopic analyses (Worthey 1994).
A different approach to exploring the chemical composition of the outer regions of galaxies involves the study of GCs. In general, red GCs follow the kinematic and chemical properties of galaxy field stars (Forbes, Ponman & O'Sullivan 2012, and references therein). Since these objects are compact and bright, their metallicity can be retrieved from photometric colours and from spectroscopy out to more than 10Re (see, for example, Forbes et al. 2011; Usher et al. 2012).
To date just a handful of works have been able to measure the stellar metallicity in the outskirts of ETGs from spectroscopy. This is because a high signal-to-noise ratio (S/N) is required to obtain reliable estimates of the stellar population parameters, and the outskirts of galaxies are faint. Weijmans et al. (2009) carried out one of the first spectroscopic studies exploring the line strength up to 4Re in the two galaxies NGC 821 and NGC 3379. In these two ETGs they found hints that the inner line strength gradients remain constant out to such large radii. Similarly, Coccato et al. (2010) measured the metallicity of the giant elliptical galaxy NGC 4889 to almost 4Re, finding in this case that the inner steep metallicity profile becomes shallower outside 1.2Re. With a sample of 33 massive ETGs, Greene et al. (2013) found mild metallicity gradients in the outskirts (i.e. up to 2.5Re), in contrast with the steep inner ones. These first results from spectroscopic measurements outside the central regions match quite closely with the prediction of a dissipative collapse model for the innermost stars and an accreted origin for those in the outskirts.
1.3 This paper
In this work, we expand the sample of ETGs for which outer metallicity gradients have been spectroscopically measured. In particular, for the first time such extended metallicity profiles are measured over a wide range of galaxy masses. Specifically, we take advantage of the calcium triplet (CaT) lines in the near-infrared (i.e. at 8498, 8542 and 8662 Å) to measure the metallicity of the integrated stellar population out to 2.5Re. We use spectra obtained with the DEep Imaging Multi-Object Spectrograph (DEIMOS) on Keck (Faber et al. 2003) as part of the SLUGGS survey1 (Brodie et al., in preparation). DEIMOS is a very efficient instrument in the spectral region of the CaT lines. This spectral feature has been long known as an indicator of metallicity (Armandroff & Zinn 1988; Diaz, Terlevich & Terlevich 1989; Cenarro et al. 2001) that is only minimally affected by the stellar age (Schiavon, Barbuy & Bruzual 2000; Vazdekis et al. 2003) and thus is useful in breaking the age–metallicity degeneracy. The method used to extract the galaxy component from the background of DEIMOS spectra was developed by Proctor et al. (2009) and used by Foster et al. (2009) and Foster et al. (2011) to obtain stellar metallicity radial profiles in three ETGs. From the metallicity measured at different spatial locations, we create 2D metallicity maps for each galaxy in our sample. These maps are then used to extract metallicity gradients both inside and outside 1Re.
The structure of this paper is as follows. In Section 2, we present the data reduction and the method used to measure the metallicity from the CaT index. Section 3 focuses on the production of 2D metallicity maps and the measurement of radial metallicity profiles for the galaxies in our sample, as well as the estimation of the metallicity gradients inside and outside 1Re. Section 4 discusses the comparison between these inner and the outer gradients, and their trends with the galaxy mass. In Section 5, we discuss our findings in relation to predictions in the literature, and in Section 6, we provide a summary of the results. In addition, Appendix A explains in detail our 2D mapping technique and discusses its general applicability to astronomical data. In Appendix B, individual sample galaxies are discussed.
2 DATA
2.1 Observations
In this paper, we present 1D radial metallicity profiles for 22 galaxies, most of them observed as part of the ongoing SAGES Legacy Unifying Globulars and GalaxieS (SLUGGS) survey. For 18 of these galaxies, we have been able to extract 2D metallicity maps.
As presented in Table 1, this survey includes nearby (D < 30 Mpc) ETGs over a range of luminosities, morphologies and environments. In addition, the last two rows of the table present two extra galaxies (i.e. NGC 3607 and NGC 5866), also observed and analysed in the same manner as those in the SLUGGS survey. One of the aims of the SLUGGS survey is to study GC systems around these galaxies (Brodie et al., in preparation) using specifically designed multislit masks on the DEIMOS spectrograph mounted on the Keck II telescope. The DEIMOS field of view has a rectangular shape of 16.7 × 5 arcmin2 in which we include up to 150 slits, targeting GC and/or galaxy stellar light. The data analysed in this paper have been obtained over the course of 8 years and 23 observing runs.
Galaxy parameters. Notes: All the galaxies are part of the original SLUGGS survey, apart from NGC 3607 and NGC 5866 which have been added later to our sample. The columns present: (1) Galaxy name. (2) Right ascension and (3) declination in J2000 coordinates taken from the NASA/IPAC Extragalactic data base (NED2). (4) Effective radius from Arnold et al. (2014). (5) Photometric position angle and (6) axial ratio from Emsellem et al. (2011), except NGC 720 (Cappellari et al. 2007), NGC 821 (Krajnović et al. 2011), NGC 1400, NGC 1407 (Spolaor et al. 2008a) and NGC 3115 (Capaccioli, Held & Nieto 1987). (7) Systemic heliocentric velocity from Cappellari et al. (2011), except NGC 720, NGC 1400, NGC 1407, NGC 3115 and NGC 5846 (NED). (8) Central velocity dispersion from HyperLeda.3 (9) Morphology from NED, combining the RSA and RC3 classifications. (10) Distance from Cappellari et al. (2011). For NGC 720, NGC 1400, NGC 1407 and NGC 3115, we adopt the values in Arnold et al. (2014). (11) Extinction corrected total K-band absolute magnitude from the 2MASS extended source catalogue (Jarrett et al. 2000), obtained following the same approach used in Emsellem et al. (2011).
| Galaxy . | RA . | Dec. . | Re . | PA . | b/a . | Vsys . | σ0 . | Morph . | Distance . | MK . |
|---|---|---|---|---|---|---|---|---|---|---|
| . | (hh mm ss) . | (dd mm ss) . | (arcsec) . | (deg) . | . | (km s−1) . | (km s−1) . | . | (Mpc) . | (mag) . |
| (1) . | (2) . | (3) . | (4) . | (5) . | (6) . | (7) . | (8) . | (9) . | (10) . | (11) . |
| NGC 720 | 01 53 00.50 | −13 44 19.2 | 33.9 | 142.3 | 0.57 | 1745 | 241 | E5 | 26.9 | −24.60 |
| NGC 821 | 02 08 21.14 | +10 59 41.7 | 39.8 | 31.2 | 0.65 | 1718 | 200 | E6 | 23.4 | −23.99 |
| NGC 1023 | 02 40 24.01 | +39 03 47.8 | 47.9 | 83.3 | 0.63 | 602 | 204 | S0 | 11.1 | −24.01 |
| NGC 1400 | 03 39 30.84 | −18 41 17.1 | 29.3 | 36.1 | 0.89 | 558 | 252 | E1/S0 | 26.8 | −24.30 |
| NGC 1407 | 03 40 11.86 | −18 34 48.4 | 63.4 | 58.3 | 0.95 | 1779 | 271 | E0 | 26.8 | −25.40 |
| NGC 2768 | 09 11 37.50 | +60 02 14.0 | 63.1 | 91.6 | 0.53 | 1353 | 181 | E6/S0 | 21.8 | −24.71 |
| NGC 2974 | 09 42 33.28 | −03 41 56.9 | 38.0 | 44.2 | 0.59 | 1887 | 238 | E4 | 20.9 | −23.62 |
| NGC 3115 | 10 05 13.98 | −07 43 06.9 | 32.1 | 43.5 | 0.51 | 663 | 267 | S0 | 9.4 | −24.00 |
| NGC 3377 | 10 47 42.33 | +13 59 09.3 | 35.5 | 46.3 | 0.50 | 690 | 139 | E5-6 | 10.9 | −22.76 |
| NGC 4111 | 12 07 03.13 | +43 03 56.6 | 12.0 | 150.3 | 0.42 | 792 | 149 | S0 | 14.6 | −23.27 |
| NGC 4278 | 12 20 06.82 | +29 16 50.7 | 31.6 | 39.5 | 0.90 | 620 | 237 | E1-2 | 15.6 | −23.80 |
| NGC 4365 | 12 24 28.28 | +07 19 03.6 | 52.5 | 40.9 | 0.75 | 1243 | 256 | E3 | 23.3 | −25.21 |
| NGC 4374 | 12 25 03.74 | +12 53 13.1 | 52.5 | 128.8 | 0.85 | 1017 | 283 | E1 | 18.5 | −25.12 |
| NGC 4473 | 12 29 48.87 | +13 25 45.7 | 26.9 | 92.2 | 0.58 | 2260 | 179 | E5 | 15.3 | −23.77 |
| NGC 4494 | 12 31 24.10 | +25 46 30.9 | 49.0 | 176.3 | 0.83 | 1342 | 150 | E1-2 | 16.6 | −24.11 |
| NGC 4526 | 12 34 03.09 | +07 41 58.3 | 44.7 | 113.7 | 0.64 | 617 | 251 | S0 | 16.4 | −24.62 |
| NGC 4649 | 12 43 39.98 | +11 33 09.7 | 66.1 | 91.3 | 0.84 | 1110 | 335 | E2/S0 | 17.3 | −25.46 |
| NGC 4697 | 12 48 35.88 | −05 48 02.7 | 61.7 | 67.2 | 0.55 | 1252 | 171 | E6 | 11.4 | −23.93 |
| NGC 5846 | 15 06 29.28 | +01 36 20.3 | 58.9 | 53.3 | 0.94 | 1712 | 239 | E0-1/S0 | 24.2 | −25.01 |
| NGC 7457 | 23 00 59.93 | +30 08 41.8 | 36.3 | 124.8 | 0.53 | 844 | 69 | S0 | 12.9 | −22.38 |
| NGC 3607 | 11 16 54.64 | +18 03 06.3 | 38.9 | 124.8 | 0.87 | 942 | 224 | S0 | 22.2 | −24.74 |
| NGC 5866 | 15 06 29.50 | +55 45 47.6 | 36.3 | 125.0 | 0.43 | 755 | 159 | S0 | 14.9 | −24.00 |
2.2 Reduction
The DEIMOS data are reduced using a modified version of the idlspec2d pipeline (Cooper et al. 2012; Newman et al. 2013), as described in Arnold et al. (2014). From each DEIMOS slit, it is possible to retrieve both the target object (i.e. the GC) light and the background light. The background light consists of the galaxy stellar light plus the sky. In order to extract only the galaxy component from the DEIMOS spectra, the ‘Stellar Kinematics with Multiple Slits’ (SKiMS) technique described in Norris et al. (2008), Proctor et al. (2009) and Foster et al. (2009) has been used. In addition, the modification to the pipeline provides the inverse variance for each pixel of the spectra. This is used in the following analysis to obtain an estimate of the continuum level.
The first step of the procedure to retrieve the galaxy light from the spectra consists of identifying the sky contribution to the total background. Thanks to the large DEIMOS field of view, the slits at larger angular distances from the galaxy centre contain a negligible contribution from the galaxy light, and therefore can be considered as pure sky. To measure the sky contribution on each spectrum, we follow the procedure in Proctor et al. (2009). In particular, we define a sky index as the ratio of the flux in a central sky-dominated band (8605.0–8695.5 Å) to the flux in two side bands (8526.0–8536.0 Å and 8813.0–8822.0 Å), representing the continuum. Higher sky indices correspond to spectra with a higher sky contribution. The spectra with the highest sky indices are then used as templates to fit the sky component in each slit. In fact, with the weighted combination of these spectra we model in each slit a unique sky spectrum, using the penalized maximum likelihood ppxf software (Cappellari & Emsellem 2004).
After the subtraction of this sky spectrum, the same software is used to fit the resulting spectrum (containing the galaxy stellar light) with a set of weighted template stars (obtained with the same instrument setup). This code returns the line-of-sight velocity distribution Gauss–Hermite moments (mean velocity V, velocity dispersion σV, skewness h3 and kurtosis h4), plus the relative contribution of the templates to the final fitted spectrum. In this paper, we use the velocity dispersion values obtained from ppxf, while the detailed analysis and discussion of the stellar kinematics for our sample of galaxies can be found in Arnold et al. (2014).
2.2.1 CaT index
To measure the equivalent widths of these lines we follow the method described in Cenarro et al. (2001, Appendix A2). We first need an estimate of the continuum level, which is obtained by interpolating across selected passbands (Foster et al. 2009). These spectral ranges are defined in order to avoid regions heavily affected by residual sky lines in the galaxies in our sample (i.e. with recession velocities between 558 and 2260 km s−1), and are fitted with a straight line adopting the values of the variance as weights for each pixel. Similarly, three spectral intervals are defined for the CaT lines (Table 2).
| Continuum passbands (Å) . | CaT line passbands (Å) . |
|---|---|
| C1: 8474-8483 | L1: 8483-8513 |
| C2: 8514-8526 | L2: 8527-8557 |
| C3: 8563-8577 | L3: 8647-8677 |
| C4: 8619-8642 | |
| C5: 8680-8705 |
| Continuum passbands (Å) . | CaT line passbands (Å) . |
|---|---|
| C1: 8474-8483 | L1: 8483-8513 |
| C2: 8514-8526 | L2: 8527-8557 |
| C3: 8563-8577 | L3: 8647-8677 |
| C4: 8619-8642 | |
| C5: 8680-8705 |
| Continuum passbands (Å) . | CaT line passbands (Å) . |
|---|---|
| C1: 8474-8483 | L1: 8483-8513 |
| C2: 8514-8526 | L2: 8527-8557 |
| C3: 8563-8577 | L3: 8647-8677 |
| C4: 8619-8642 | |
| C5: 8680-8705 |
| Continuum passbands (Å) . | CaT line passbands (Å) . |
|---|---|
| C1: 8474-8483 | L1: 8483-8513 |
| C2: 8514-8526 | L2: 8527-8557 |
| C3: 8563-8577 | L3: 8647-8677 |
| C4: 8619-8642 | |
| C5: 8680-8705 |
The CaT index can be measured on either the real spectra or the fitted spectra obtained from the ppxf fitting code (also used for the kinematic analysis). This latter is the approach taken by the GC CaT studies of Foster et al. (2010) and Usher et al. (2012). While the former could be affected by poor sky-subtraction and noise, the latter needs further assumptions for the template selection. For this reason, we test both possibilities for one galaxy (NGC 5846), finding that for spectra with S/N > 30 the difference between the two methods is smaller than the associated error (Fig. 1). In fact, considering only the data points above this S/N cut, the standard deviation from a perfect match is 0.22 Å, while the mean error for this subset of values is ΔCaT = 0.30 Å. Similar values are obtained in the other galaxies of our sample. We choose therefore to continue the analysis measuring the CaT indices on the real spectra, to be consistent with Foster et al. (2009).
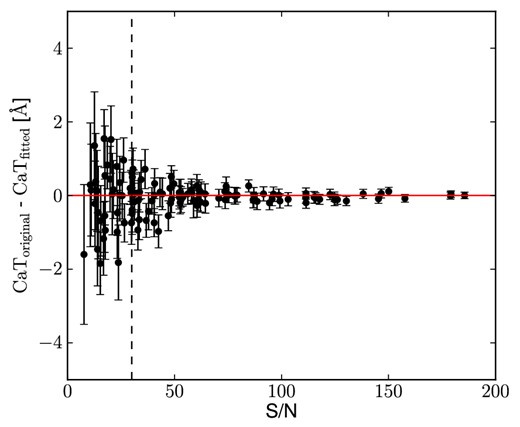
Differences between the NGC 5846 CaT indices measured on the original sky-subtracted spectra and on the fitted spectra versus the S/N. The error bars are obtained by summing in quadrature the uncertainties of each pair of CaT values. The dashed vertical line indicates the cut in S/N we use for reliable measurements (i.e. S/N > 30).
Another issue in the measurement of line indices is the presence of weak absorption lines within the passbands of the index definition, which can potentially alter the final result. In the case of the CaT index, the most prominent of them is the Fe line at 8688 Å, lying completely in the reddest continuum passband. The consequent underestimation of the continuum level potentially lowers the measured value of the CaT index. We can test how this issue could affect the final metallicity measurements. We experiment with measuring the CaT index with and without masking the iron line, finding that the final extracted metallicities are not affected by this spectral feature. We thus maintain the original passbands definition for the rest of the analysis, remaining consistent with the method adopted in Foster et al. (2009).
At this stage, the obtained CaT index values need to be corrected for the velocity dispersion line broadening in order to be comparable with the values obtained from the models. Spectra with a larger σV have broader absorption lines that can exceed the defined passbands, causing an underestimation of the CaT index. To correct for this effect, we convolve the Vazdekis et al. (2003) old age (i.e. 12.6 Gyr) and Salpeter (1955) initial mass function (IMF) single stellar population (SSP) model spectra by a set of Gaussians with a range of σV in the interval [0, 400] km s−1. These SSP models span a range of [Z/H] values from −2.32 to −0.05 dex. On these spectra, we measure the CaT index, finding its relation with the velocity dispersion of the spectra (Fig. 2). With such a relation, we can correct the indices measured on real spectra, according to their velocity dispersion.
![Applied velocity dispersion index correction. The correction CaT/CaT$_{\sigma _{\rm {V}}}$ is shown against the velocity dispersion σV. The relation has been derived from the measurement of the CaT index in the Vazdekis et al. (2003) SSP model spectra convolved with Gaussians of corresponding width for a given velocity dispersion in the range [0, 400] km s−1. The values have been fitted with a third-order polynomial curve in order to estimate a correction for each value of σV. The shaded area shows the scatter in the correction due to models with different metallicity. The correction is less than 10 per cent for most of the galaxies in our sample.](https://oup.silverchair-cdn.com/oup/backfile/Content_public/Journal/mnras/442/2/10.1093/mnras/stu937/2/m_stu937fig2.jpeg?Expires=1749957190&Signature=vZ5fb-~I1VW1jjNbVIMssbm-jmW-IcMxDdLMm0C~iNgudyL7bmaF5QFYv9Aaq8zRBrBA2Ksa1Awupi9UIaNQ7O95sZfo0baJBsEHegISi5R9389zz2YwEZj0cEmQn2n1jUqkmzvSrwvUwGYzrXXgZ-hKq5KsKm9AqtBOJ~VHHh58tLb2vjhMm4UrfmzDVcJblrYl-W3QnfR93PqZbL3EbqqG3dbyr~q6trRFwkahHdScAnscBl121vW4cfY8ARHCvtj2WlUnTvuWKbRp61PULQ89b~6tcch4ArAFVTxXVJlO1q--G45UYu7D9DTQKaJHY~~Hs-Vdie-87az5wfQY7A__&Key-Pair-Id=APKAIE5G5CRDK6RD3PGA)
Applied velocity dispersion index correction. The correction CaT/CaT|$_{\sigma _{\rm {V}}}$| is shown against the velocity dispersion σV. The relation has been derived from the measurement of the CaT index in the Vazdekis et al. (2003) SSP model spectra convolved with Gaussians of corresponding width for a given velocity dispersion in the range [0, 400] km s−1. The values have been fitted with a third-order polynomial curve in order to estimate a correction for each value of σV. The shaded area shows the scatter in the correction due to models with different metallicity. The correction is less than 10 per cent for most of the galaxies in our sample.
To obtain reliable uncertainties for the CaT index measurements, we carry out a Monte Carlo simulation in a fashion similar to the kinematic uncertainties estimation in Arnold et al. (2014). For each spectrum, we obtain 100 statistical realizations, adding noise to the best-fitting curve from ppxf. The noise is added using the inverse variance array, which is an output of the modified spec2d reduction pipeline. We then measure the CaT index in each realization, before computing the standard deviation.
One mask for NGC 2768 was observed on two different nights, allowing for a test of the measurement repeatability. As shown in Fig. 3, the CaT index values for these two masks are consistent only at high S/N and, for this reason, we choose to apply a selection in all our data sets, keeping only the spectra with S/N > 30. The standard deviation of these selected values from the perfect match is of 0.22 Å.
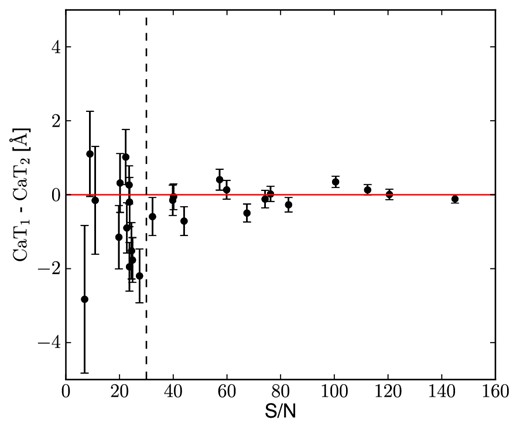
Differences between the CaT index values obtained on different nights from the same NGC 2768 mask, along with the S/N of the spectra. The vertical error bars are obtained averaging in quadrature the uncertainties of each couple of measurements, while the abscissa values are the mean of the measured S/N of paired spectra. The dashed vertical line indicates the limit in S/N we use (i.e. S/N > 30).
2.2.2 Metallicity
The relation between the CaT index and metallicity has been derived in a number of papers for both individual stars and GCs in many galaxies (see Usher et al. 2012 and references therein). Although the conversion is straightforward, obtaining the metallicity [Z/H] from the CaT index needs several assumptions. In order to obtain the converted values, we have to derive the relation between CaT indices and metallicities from template spectra, for which we already know the nominal metallicities. We choose SSP models of Vazdekis et al. (2003) mostly because the spectral resolution is comparable with our data. In addition, the Vazdekis et al. (2003) models cover a wide range of metallicities and IMFs. The primary issue is the choice of the stellar age for these SSP spectra. In general, we could safely adopt an old stellar population (age = 12.6 Gyr) as representative of that found in the haloes of ETGs. In fact, as discussed in Foster et al. (2009), the use of an old SSP stellar library instead of a younger one leads to insignificant differences in the inferred metallicities, as the CaT lines are quite insensitive to the age of the stellar population, if older than a few Gyr.
A second assumption regards the IMF adopted for the templates. As shown in Vazdekis et al. (2003) and Conroy & van Dokkum (2012), the CaT strength depends on the giant star contribution in the stellar population. For a constant metallicity, a ‘bottom-heavy’ IMF (e.g. rich in dwarf stars) will lead to lower measured CaT indices than a ‘bottom-light’ one. A way to break this degeneracy between IMF and metallicity is to analyse spectral features more dependent on the dwarf star component of the stellar population (e.g. Na i doublet and FeH Wing-Ford band). Unfortunately, this analysis is not possible with our spectra, because both the Na i doublet and the Wing-Ford band lie outside the wavelength range of our data.
We will later find an empirical correction for the metallicity after comparing our measured values with the SAURON inner profiles obtained using Lick indices and assuming a relation between the IMF steepness and the galaxy mass (Cenarro et al. 2003). A more complete discussion of this can be found in Section 3.3.2.
3 ANALYSIS
In order to measure the metallicity gradients of the galaxies in our sample up to 2.5Re, we must first explore and understand the underlying 2D distribution using our sparse metallicity values. The presence of contaminant neighbouring galaxies, or substructures, could affect the final integrated metallicity radial profile obtained. To identify these, for all the galaxies in our sample we analyse 2D maps of the CaT index distribution, obtained by interpolating the slit points as described in Section 3.1. Evaluating case by case, we exclude the slits which are probably not related to the galaxy under study. In particular, the only galaxy for which we identify contaminated slits is NGC 5846. From the remaining slits, we obtain radial metallicity profiles (Section 3.2) which are used to compare our metallicity values with SAURON data in the overlapping regions. In Section 3.3, we present the metallicity offsets between SAURON and our own metallicity values, discussing their possible causes. We then obtain an empirical correction for our values in Section 3.4. Finally, from the new corrected metallicity values, we create 2D metallicity maps from which, in Section 3.5, we extract azimuthally averaged 1D metallicity profiles. Such profiles are used in Section 3.6 to measure reliable metallicity gradients within and beyond 1Re for most of our galaxies.
3.1 2D CaT index maps
Thanks to the wide field of view of DEIMOS, we are able to probe several square arcminutes of the galaxy metallicity spatial distribution. The drawback is that our slits are not uniformly distributed nor do they cover a contiguous portion of the field. Instead, they are spread around the field, primarily targeting bright objects like GCs. To partially solve this problem and be comparable with the results from IFU spectroscopy, we need to use a 2D interpolation technique in order to retrieve 2D maps of the CaT index and the stellar metallicity.
In this work, we choose to adopt the kriging technique, described in detail in Appendix A. As demonstrated for the metallicity case in Appendix A2, kriging is a powerful method that is able to recover the overall 2D structure for a variable, while it is also able to at least spot small-scale structures if there are enough sampling points in the field. To date, in astronomy only a handful of cases using kriging have been published (e.g. Platen et al. 2011; Bergé et al. 2012; Foster et al. 2013; Gentile, Courbin & Meylan 2013). Kriging is very useful in our case, where we aim to map the outskirts of galaxies looking for metallicity trends. In particular, we adopt the kriging code included in the package fields (Furrer et al. 2002), written in the statistical programming language r.
Analysing the CaT index kriging map of each galaxy, we find a few slits that we need to exclude. In particular, in NGC 5846 several slits were placed on the companion satellite NGC 5846A and on NGC 5845. While the NGC 5845 slits are easily excluded because of their distance from the centre of NGC 5846, slits near NGC 5846A are identified on the 2D CaT index map based on their significantly lower value of the CaT index (and metallicity). In Fig. 5, the presence of NGC 5846A is noticeable as a lower metallicity/CaT index substructure with respect to the main galaxy. To be conservative and avoid contamination by this galaxy, we discard all the slits within 15 arcsec of the centre of NGC 5846A. We do not find other such contaminated galaxies in the rest of our sample.
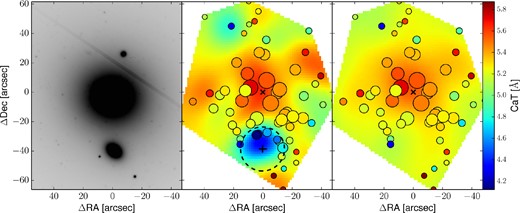
NGC 5846. The left-hand panel shows a DSS image of the NGC 5846 system, oriented north-up and east-left. The main object in the centre is NGC 5846, while the nearby companion galaxy NGC 5846A is a compact elliptical ≈40 arcsec south of the NGC 5846 centre. On the central and right panels, the CaT index kriging maps are presented, together with the measured points (circles). The central panel shows the CaT index kriging map obtained from the CaT index data points (circles). The size of each point is inversely proportional to its uncertainty. Both the map and the points are colour coded accordingly to their CaT index values, following the colour scale on the right-hand side of the figure. The diagonal and the vertical crosses show, respectively, the positions of the NGC 5846 and NGC 5846A centres. There is an area with low CaT index values (i.e. blue) around the centre of NGC 5846A. The black dashed line encloses the points within 15 arcsec of NGC 5846A. These points have been removed, being the most affected by NGC 5846A light. The right-hand panel shows the CaT index kriging map obtained after the removal of NGC 5846A points, together with the remaining data points (circles). Similarly to the central panel, both map and points are colour coded according to their CaT index values, scaled as shown in the colour bar on the right. Again, the point sizes are inversely proportional to their associated CaT index uncertainties. After excluding data associated with NGC 5846A, the low-metallicity area is no longer found in the kriging map, and we can obtain a metallicity map for just NGC 5846.
3.2 1D metallicity radial profiles
3.2.1 Radial coverage
As a consequence of the S/N limits and the lack of observations in the very centre of our galaxies, the typical radial coverage of our measurements is 0.32 < R < 2.5Re. This differs from most previous spectroscopic work, which had single integrated central measurements or complete coverage up to 1Re (e.g. the typical SAURON radial coverage is about 0.6Re). Comparing with SAURON galaxies, there are 11 galaxies with overlapping coverage in the range 0.32 ≲ R ≲ 1Re.
3.3 Metallicity offset with SAURON
Most of the galaxies in common between us and the SAURON sample show an offset in metallicity, with our CaT index-derived metallicities systematically lower. In panel A of Fig. 6, an example of these metallicity offsets (i.e. NGC 5846) is shown. In order to deal with this issue, we first explore the causes of such offsets and then apply a correction to obtain the metallicity values on the SAURON scale.
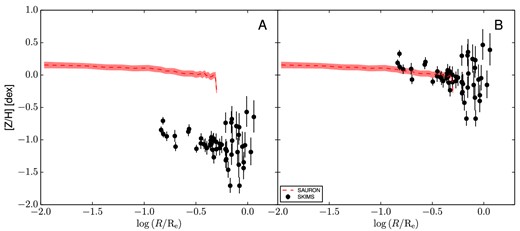
NGC 5846 radial metallicity profile before and after the offset correction. Panels A and N show metallicity versus galactocentric radius scaled by Re. In both the panels, the red dashed line shows the metallicity radial profile extracted from the 2D SAURON metallicity map of NGC 5846. The black points are the values obtained from DEIMOS multislit observations (called SKiMS) before (panel A) and after (panel B) the empirical correction.
3.3.1 Possible explanations for the metallicity offset
We first discuss all the possible non-astrophysical reasons for the observed difference between SAURON and our metallicity profiles. We do not consider the possibility of the offsets due to overestimated SAURON metallicities, which we assume as correct. We check if the metallicity offsets could be explained by stellar population effects (i.e. α-enhancement and age), limits in the CaT–metallicity relation and/or issues related with the observation or the reduction of the data.
Calcium is an α-element and therefore its abundance is linked to the [α/Fe] ratio of the galaxy (Thomas, Maraston & Bender 2003a). However, Brodie et al. (2012) found that the relation between the CaT index and metallicity is insensitive to the α-enhancement of the stellar population. In addition, the calcium abundance seems to trace the iron abundance (i.e. [Ca/Fe] ≈ 0), independently of galaxy mass (Conroy, Graves & van Dokkum 2014).
Age has a negligible influence on the CaT strength for stars older than 3 Gyr (Vazdekis et al. 2003), which are dominant in ETGs.
The CaT–metallicity relation we adopt is extracted from SSP model spectra. Another possible explanation for the metallicity offset is that the CaT is a feature not well reproduced in such models. For example, if the CaT lines in the models saturate for metallicities greater than a certain value, we would not be able to measure such metallicities with our method (Foster et al. 2009 estimated the saturation limit for the CaT as ≤6.2 Å). However, it was demonstrated in Usher et al. (2012) that the models we are adopting are not affected by saturation at least up to the solar metallicity value ([Z/H] = 0). They argued that the apparent saturation observed by Foster et al. (2009) is probably due to the presence of weak metal lines in the high-metallicity model spectra. Because of these lines, the pseudo-continuum level is underestimated (lowering the CaT index measure) and the expected increase in the CaT index due to the higher metallicity is compensated for, mimicking a saturation effect. In our case, we do not see this saturation effect, measuring in several cases supersolar metallicities ([Z/H] > 0) from the CaT.
As an example of this, in Fig. 7 we present two fitted NGC 2768 spectra with supersolar and subsolar metallicities. The spectra are normalized with respect to the continuum level in order to compare the CaT equivalent widths. The dashed spectrum has a velocity dispersion σV = 151 km s−1, an S/N = 69 and a measured CaT index = 5.25 Å, while the solid spectrum has a comparable velocity dispersion σV = 147 km s−1, an S/N = 71 and a measured CaT index = 6.78 Å. Assuming a unimodal Salpeter (1955) IMF, the CaT index value corresponding to a solar metallicity is ≈6.5 Å (this value is smaller for steeper IMFs, see Section 3.3.2). The presence of spectra with higher CaT indexes (and, thus, with a supersolar metallicity) allows us to exclude the saturation of the CaT lines as a possible cause for the offset in metallicity we observe.
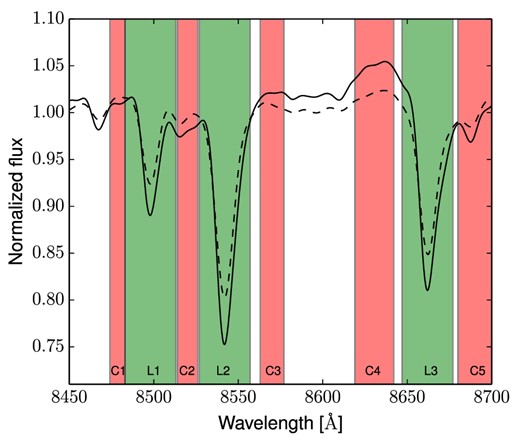
Comparison between two normalized stellar light spectra of NGC 2768 with similar velocity dispersion σV and S/N but different CaT indices. The dashed line is the fit of the spectrum with CaT index = 5.25 Å, corresponding to a metal-poor (subsolar) stellar population, while the solid line is the fit of the spectrum with CaT index = 6.78 Å, corresponding to a metal-rich (supersolar) stellar population. The green regions (L1, L2 and L3) represent the absorption lines intervals, while the red regions (C1, C2, C3, C4 and C5) the continuum intervals, as defined in Table 1. The difference between a metal-rich (dashed line) and a metal-poor stellar population is noticeable.
In addition, we test the analysis pipeline, running the independent analysis code of Usher et al. (2012) on a subsample of our data set, adopting the same CaT index definition and retrieving the same metallicities. We also measure the CaT index for a random sample of spectra using the iraf package splot, confirming again our previous measurements.
We try also to exclude issues linked with the observations or the reduction of the data (i.e. sky subtraction, flat-field division) which could result in a bad estimation of the continuum level and, consequently, in a miscalculation of the CaT equivalent width. We find that the observed offset in metallicity could be caused by a total flux overestimation of ≈10 per cent in each spectrum (i.e. the CaT index measure would be underestimated by ≈0.5 Å). This can be ruled out because the data of the galaxies showing an offset come from different masks. It is improbable that the same extra flux is present in spectra obtained during different nights, with different observing conditions and different positions of the masks on the sky. We also verify our results with the metallicities obtained by applying a similar method to long-slit data for NGC 4278, using the same instrumental setup. Therefore, some extra flux seems unlikely to cause the observed offset.
In summary, we verified that the offset is not caused by instrumental or data reduction effects. We have also excluded stellar population parameters (e.g., α-enhancement or stellar age) as causing the metallicity difference we observe with respect to the SAURON values.
3.3.2 IMF dependence
After ruling out the above conceivable causes for the metallicity offsets, we assume that they have an astrophysical origin. We propose that it is caused by the IMF (and, in particular, by the ratio between dwarf and giant stars). As well as metallicity, the CaT strength depends on the stellar surface gravity (which is stronger in giant stars and weaker in dwarf stars).
Assuming that the metallicity offsets are due entirely to the variation of IMF slope, we calculate the IMF slope that would be necessary to reproduce the SAURON metallicities in the different galaxies. We use the Vazdekis et al. (2003) old age (i.e. 12.6 Gyr) SSP models with a unimodal IMF to recover a relation between the CaT index, the metallicity and the IMF slope. This relation is obtained by fitting the models with a second-order polynomial (as done in Section 2.2.2). In these stellar models, the CaT is not well constrained for IMF slopes steeper than μ = 2.8. An additional issue is linked to the limited number of discrete IMF slopes for which the models are available. To help overcome this limitation, we interpolate the available models in order to predict the CaT index to metallicity conversion for all possible IMF slopes between μ = 0.3 and μ = 2.8 (Fig. 8). For each galaxy, we find the IMF slope that would convert the measured CaT index at R = 1Re into the SAURON metallicity extrapolated at R = 1Re. To estimate the uncertainties of the IMF slope, we propagate those on the metallicity extrapolated value at R = 1Re.
![CaT to metallicity model relations for different IMF slopes. The different lines show the second-order polynomials fit to CaT indices measured on the Vazdekis et al. (2003) models for old ages (i.e. 12.6 Gyr). The lines are colour- and style coded according to the assumed IMF slope (μ), as in the legend. A Salpeter (1955) IMF has a slope μ = 1.3. For the same CaT index, steeper IMF slopes (higher μ) give higher metallicities. From the CaT index, we measure at R = 1Re and the SAURON [Z/H] at the same galactocentric radius, we estimate the IMF slope which could compensate for the offset between our metallicities and those of SAURON. Because of the discrete number of available models, in order to obtain the IMF slope where the [Z/H]–CaT index point lies, we interpolate between the two closest curves.](https://oup.silverchair-cdn.com/oup/backfile/Content_public/Journal/mnras/442/2/10.1093/mnras/stu937/2/m_stu937fig8.jpeg?Expires=1749957190&Signature=Maqhbprk8lBwVlEcejdyQUG4C-byM2YHeKR1lQK6NJNNTLLVhMOJa~IFbK-0sVnut~cjQRaL4svhmnAnsGqbDMcUp66mKscv3Rs5iRAjaHM2fcKU4IYfW0~w-wDDiYdGOZuD-9uj1qPy3WGDUl2sGXXEWVWVc5RFSYRkgcO5Z~eBQ4obQF6OkRd-okcTfGnYgNK9dEShQaOpZBjiSbdW1wZ1X8KWPKk9zJZYVTFZt9O8dN9VvLOB1aYz0kpXevB9tmelz-Ml7jzc3TFqMBf8RqkstuzHmkPgZSuP-xdruARjmJzS6E9NWxX-1eNn6VFEkIIqHpIn6lhFr17NYy7BMw__&Key-Pair-Id=APKAIE5G5CRDK6RD3PGA)
CaT to metallicity model relations for different IMF slopes. The different lines show the second-order polynomials fit to CaT indices measured on the Vazdekis et al. (2003) models for old ages (i.e. 12.6 Gyr). The lines are colour- and style coded according to the assumed IMF slope (μ), as in the legend. A Salpeter (1955) IMF has a slope μ = 1.3. For the same CaT index, steeper IMF slopes (higher μ) give higher metallicities. From the CaT index, we measure at R = 1Re and the SAURON [Z/H] at the same galactocentric radius, we estimate the IMF slope which could compensate for the offset between our metallicities and those of SAURON. Because of the discrete number of available models, in order to obtain the IMF slope where the [Z/H]–CaT index point lies, we interpolate between the two closest curves.
For the galaxies in common with SAURON, we find that the IMF slopes are in the range 1.25 < μ < 2.15, which is steeper than the Salpeter (1955) IMF slope (i.e. μ = 1.3) in all but one case (i.e. NGC 3377). Again, this result is obtained under the assumption that the offset we observe in metallicity is entirely a consequence of a non-universal IMF. In this sense, our values are an upper limit to the real IMF slope.
Cenarro et al. (2003) found a strong anticorrelation between the CaT index and the galaxy central velocity dispersion (σ0). In recent years, a number of other studies have confirmed a relationship between the shape of the IMF (in the low stellar mass regime) and galaxy mass, velocity dispersion and elemental abundance (Auger et al. 2010; Graves & Faber 2010; Treu et al. 2010; van Dokkum & Conroy 2010; Thomas et al. 2011; Cappellari et al. 2012; Conroy & van Dokkum 2012; Dutton, Mendel & Simard 2012; Sonnenfeld et al. 2012; Smith, Lucey & Carter 2012; Spiniello et al. 2012, 2014; Dutton et al. 2013a,b; Ferreras et al. 2013; Geha et al. 2013; La Barbera et al. 2013; Tortora, Romanowsky & Napolitano 2013; Conroy et al. 2014). For example, Ferreras et al. (2013) found a relation between μ and σ0 from the analysis of three IMF-sensitive spectral features, i.e. TiO1, TiO2 and Na8190.
In Fig. 9, we show our IMF slopes against the central velocity dispersion for the galaxies in common with the SAURON sample. The σ0 values are taken from Table 1. Since NGC 7457 has a low central velocity dispersion, with a poorly estimated metallicity offset (and therefore a poorly estimated μ), we exclude it from the plot. A trend with the central velocity dispersion (a proxy for the galaxy mass) is seen. We find that higher mass galaxies have steeper IMFs than low-mass galaxies. In the unique case of NGC 3377, the inferred IMF is shallower than a Salpeter (1955) IMF. However, the uncertainties shown in Fig. 9 are underestimated as they are the confidence limits of our IMF slope extraction in CaT–metallicity space and they do not include the uncertainties on the CaT index measurements, nor the uncertainties in the Vazdekis et al. (2003) SSP models. In the typical case of a CaT index measure at 1Re of 5.5 ± 0.2 Å, we estimate a propagated uncertainty on the IMF slope of the order of Δμ = ±0.15.
![The IMF slope trend with central velocity dispersion. The IMF slope μ needed to compensate for the [Z/H] offset at 1Re between the SAURON profiles and ours is shown on the vertical axis for our sample galaxies (black circles). On the horizontal axis the central velocity dispersion of the galaxies (proxy of the galaxy mass) is shown. A trend is noticeable, with high-mass galaxies having steeper IMFs. The green thick solid horizontal line shows the slope of the Salpeter (1955) IMF (i.e. μ = 1.3). The only point consistent with a slope shallower than a Salpeter (1955) IMF is NGC 3377. The red dotted and dash–double dotted lines present the relations found by Ferreras et al. (2013) with, respectively, a bimodal and a unimodal IMF. The blue solid, dashed and dot–dashed lines show, respectively, the relations found by La Barbera et al. (2013) with their τ, 2SSP and 2SSP+X/Fe models. Despite the uncertainties and systematics involved in our measurements, our points show general agreement with the literature models.](https://oup.silverchair-cdn.com/oup/backfile/Content_public/Journal/mnras/442/2/10.1093/mnras/stu937/2/m_stu937fig9.jpeg?Expires=1749957190&Signature=VRYV~723Twm5c80PEqJ7oo~VWi1akjHC-rSMFn-jsCXg02G6FWnG-8rLcIjwVYgrfgaA5OoSaIM9rhufHnq6dxkoFlJmrf3fkTGdYO7g96PUf~UH7lW4at~PjJhb2XbvJUXuRzSB36eKozbROYxSZqZbb~8mnwY4EUxoGe8crmu~MM7IBZtCLyA0xKhdkg9YZEuTeHlekZe3Hf~18pLXv29Io9Sw5dk7RMOA~P5qptrRFcMNrbQWLrJm9OrsJdVM8mi~Ltndv3OUvjT0chEzlOv~a9duAj9bCj0wMfAzZDGnPi19KJ8~81Az06DsE5Ny~IY1GAGKsaB5nleqEvoKXg__&Key-Pair-Id=APKAIE5G5CRDK6RD3PGA)
The IMF slope trend with central velocity dispersion. The IMF slope μ needed to compensate for the [Z/H] offset at 1Re between the SAURON profiles and ours is shown on the vertical axis for our sample galaxies (black circles). On the horizontal axis the central velocity dispersion of the galaxies (proxy of the galaxy mass) is shown. A trend is noticeable, with high-mass galaxies having steeper IMFs. The green thick solid horizontal line shows the slope of the Salpeter (1955) IMF (i.e. μ = 1.3). The only point consistent with a slope shallower than a Salpeter (1955) IMF is NGC 3377. The red dotted and dash–double dotted lines present the relations found by Ferreras et al. (2013) with, respectively, a bimodal and a unimodal IMF. The blue solid, dashed and dot–dashed lines show, respectively, the relations found by La Barbera et al. (2013) with their τ, 2SSP and 2SSP+X/Fe models. Despite the uncertainties and systematics involved in our measurements, our points show general agreement with the literature models.
Together with the data points, in Fig. 9 we show several μ–σ0 relations found by Ferreras et al. (2013) and La Barbera et al. (2013). We are not able to quantify the confidence limits of such relations from their papers. Even though the IMF slopes we measure are upper limits, our points lie in a region of the μ–σ0 space compatible with these literature relations and, in particular, with those assuming a unimodal IMF.
In addition, we also compare our IMF slope upper limits with the mass-to-light (M/L) ratios presented in Conroy & van Dokkum (2012) and Cappellari et al. (2013) for the galaxies in common. In Fig. 10, we plot the IMF slope values against the Conroy & van Dokkum (2012) spectroscopic best-fitting K-band M/L in terms of the best-fitting K-band M/L measured assuming a fixed Kroupa (2001) IMF (M/L)Kroupa for the eight galaxies in common with our sample. We also plot the IMF slope values against the Cappellari et al. (2013) dynamical best-fitting SDSS r-band M/L in terms of M/LKroupa for the 11 galaxies in common with our sample. The Cappellari et al. (2013) M/L values are obtained from galaxy kinematics and are presented together with the M/L obtained from spectral fitting assuming a Salpeter (1955) IMF (M/L)Salpeter. In order to have the ratios expressed in terms of the (M/L)/(M/LKroupa), we multiply the given (M/L)/(M/LSalpeter) values by 1.65 (Conroy & Gunn 2010). The ratios (M/L)/(M/LKroupa) are sensitive only to the IMF. From the plot, it is possible to see a correlation between our CaT-derived IMF slopes and both the independent IMF measures of Conroy & van Dokkum (2012) and Cappellari et al. (2013). However, it is worth noting that a significant scatter is visible between Conroy & van Dokkum (2012) and Cappellari et al. (2013) on a galaxy-by-galaxy basis, in agreement with the comparisons of Smith (2014).
![The IMF slope trend with the M/L normalized to the M/L measured assuming a Kroupa (2001) IMF. The IMF slope μ needed to compensate for the [Z/H] offset at 1Re between the SAURON profiles and ours is shown on the vertical axis for our sample galaxies. The filled circles are the values of (M/L) and (M/L)Kroupa measured by Conroy & van Dokkum (2012) in the K band. The open triangles are the values for (M/L) and (M/L)Kroupa measured by Cappellari et al. (2013) in the SDSS r band. The green thick solid horizontal line shows the slope of the Salpeter (1955) IMF (i.e. μ = 1.3). The vertical dashed lines show the M/L obtained for a fixed Kroupa (2001) (Kroupa) and a fixed Salpeter (1955) (Salpeter) IMF. A trend is noticeable for our sample galaxies, with steeper IMFs corresponding to higher dynamically (i.e. Cappellari et al. 2013) and spectroscopically (i.e. Conroy & van Dokkum 2012) measured mass-to-light ratios.](https://oup.silverchair-cdn.com/oup/backfile/Content_public/Journal/mnras/442/2/10.1093/mnras/stu937/2/m_stu937fig10.jpeg?Expires=1749957190&Signature=5Fav702xcer5qotgu5fo-CJqpueG8HuleIEDKj43VRkkwrKjlt29RyGh4hCgkSFkKnlTlzfE0HNFae2nqo2TWEAjPOb5dFT95N7HpLyO8-kCpodHLin0-Id9iOyviGLyyPOLb8-haqyLAnck8ITrkZtGTNiG4VFsCoxoVT-HC-usrKgKFsToy87mo~pNREyGZxJxq0OgTouvyohXZtKUHq0U5ad8M669XGWivgfP9Tz56tHtFQN9qvYeZgXWmhtdj9aBweFGed~k9guRLk6A8P~CD1-RKRMpS7HC7UUbX327E3YC0PyvCFos3RRenn6mle~4lpbcVZlrqGLZPHGpcQ__&Key-Pair-Id=APKAIE5G5CRDK6RD3PGA)
The IMF slope trend with the M/L normalized to the M/L measured assuming a Kroupa (2001) IMF. The IMF slope μ needed to compensate for the [Z/H] offset at 1Re between the SAURON profiles and ours is shown on the vertical axis for our sample galaxies. The filled circles are the values of (M/L) and (M/L)Kroupa measured by Conroy & van Dokkum (2012) in the K band. The open triangles are the values for (M/L) and (M/L)Kroupa measured by Cappellari et al. (2013) in the SDSS r band. The green thick solid horizontal line shows the slope of the Salpeter (1955) IMF (i.e. μ = 1.3). The vertical dashed lines show the M/L obtained for a fixed Kroupa (2001) (Kroupa) and a fixed Salpeter (1955) (Salpeter) IMF. A trend is noticeable for our sample galaxies, with steeper IMFs corresponding to higher dynamically (i.e. Cappellari et al. 2013) and spectroscopically (i.e. Conroy & van Dokkum 2012) measured mass-to-light ratios.
Both the relations found for the IMF slope with the galaxy σ0 (Fig. 9) and M/L (Fig. 10) provide some confidence to our claim that the metallicity offsets compared to the SAURON metallicities are mostly due to real IMF variations among the galaxies.
3.4 Empirical correction
Considering the limitations of the analytic approach to the metallicity offset issue (i.e. adopting different IMF slopes for our galaxies), we use an empirical correction for our metallicity profiles. In order to simplify the task, we assume that the offsets we observe between our CaT-derived metallicity profiles and the SAURON ones are constant with radius and depend exclusively on the galaxy mass. Under the first assumption, we sum the inferred offset to all the metallicity points we measure from the CaT index in the galaxies in common with the SAURON sample. In panel B of Fig. 6, the corrected metallicity values are shown together with the profile extracted from the 2D SAURON metallicity map. The second assumption allows us to calibrate an empirical relation between the central velocity dispersion σ0 presented in Table 1 (proxy for the galaxy mass) and the metallicity offset. We exclude from this relation NGC 7457 because it deviates from a linear relation. In Fig. 11, we show the metallicity offsets against the galaxy central velocity dispersion.
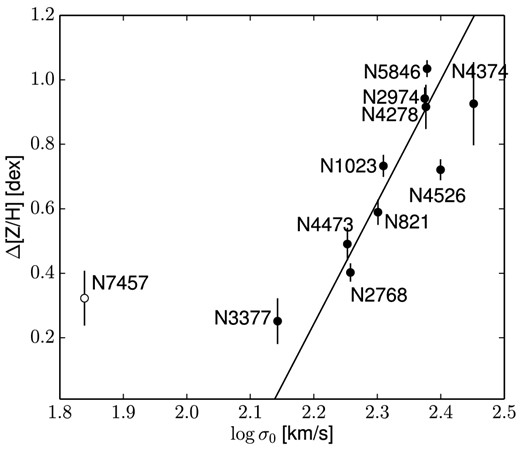
Metallicity empirical correction. The points represent the metallicity offsets between our values and the SAURON metallicities versus the central velocity dispersion σ0 obtained from HyperLeda. The straight line is the fit to the black data points, excluding the outlier NGC 7457 (open circle).
The empirically corrected 1D radial metallicity values are plotted in Fig. 12, together with the available literature values and profiles. In the cases of NGC 821 (Proctor et al. 2005), NGC 1400, NGC 1407 (Spolaor et al. 2008b) and NGC 3115 (Norris, Sharples & Kuntschner 2006), the long-slit metallicity profiles are extracted directly from the literature plots. Unfortunately, this method prevents us from quantitatively estimating the metallicity offset with our uncorrected metallicity values. It is, however, remarkable that our metallicity profiles for these four galaxies qualitatively match with the long-slit data after the empirical correction of equation (7) is applied. The works of Proctor et al. (2005), Spolaor et al. (2008b), Norris et al. (2006) and Kuntschner et al. (2010) all derive metallicities from the Lick indices using the χ2 technique (Proctor & Sansom 2002; Proctor, Forbes & Beasley 2004), but adopt different stellar population models. While Proctor et al. (2005), Spolaor et al. (2008b) and Norris et al. (2006) fit their indices to the Thomas et al. (2003a) SSP models (with the former correcting the metallicities to include the oxygen abundance variations in the stars used to define such models), Kuntschner et al. (2010) use the SSP models by Schiavon (2007).
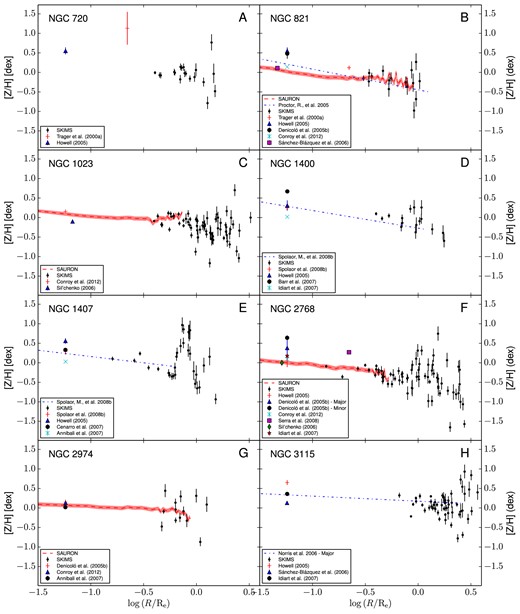
1D metallicity profiles. The plots (A–V) show metallicity versus galactocentric radius scaled by Re. The CaT-derived metallicities, empirically corrected in all the cases except NGC 7457, are presented as black dots and labelled as ‘SKiMS’. When available, the SAURON metallicity radial profiles are presented as a red solid line. Other literature radial profiles are presented as blue dashed and dot–dashed lines. The central metallicities from the literature have been plotted at a luminosity-scaled radius from the centre, assuming a de Vaucouleurs profile for the galaxy surface brightness. The sources for all the values and the radial profiles are presented in the legend panels on the bottom-left corner of each plot.
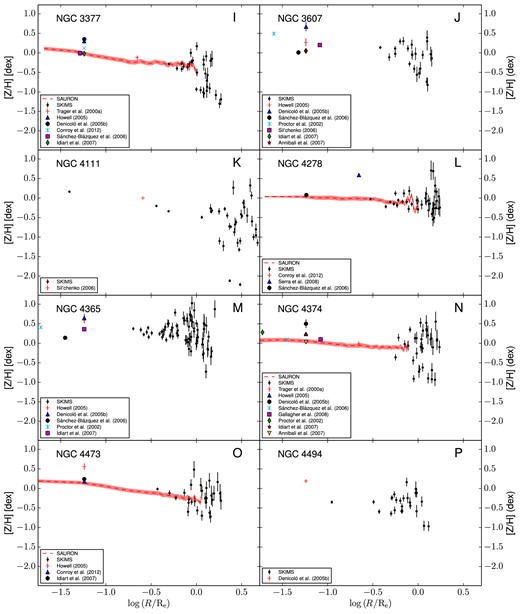
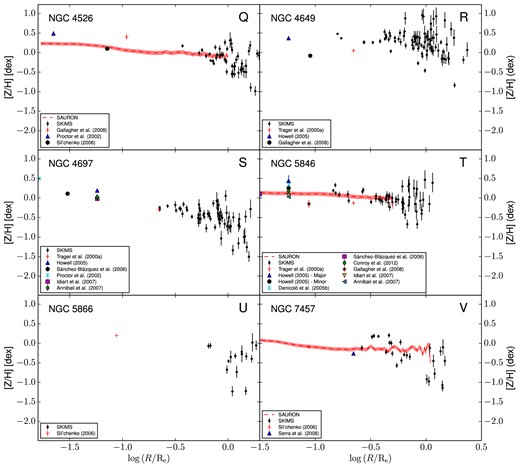
The literature metallicity values at a given radius are often not directly comparable with ours, because the metallicity in many cases is reported as an averaged value within an area around the galaxy centre. Usually, this area corresponds to the spectroscopic aperture or to the fibre size. In these cases, we plot the literature points at scaled galactocentric radii. Assuming a de Vaucouleurs profile, we calculate the total luminosity within the averaged area and we assign the radius within which half of this luminosity is included as the x-coordinate of the value. The scatter between the literature values can be easily explained by the adoption of different techniques and SSP models in the metallicity measurements.
After applying the metallicity corrections (i.e. equation 7), we can obtain metallicity maps for most of the galaxies in our sample. No fitting technique is able to reliably retrieve values in an undersampled area, and kriging is no exception. For this reason, we exclude the galaxies with a combination of few measured data points and/or insufficient azimuthal sampling coverage of the field (i.e. NGC 720, NGC 821, NGC 2974 and NGC 5866). As a first pass, we reject the galaxies with fewer than 16 metallicity data points. As a second pass, we measure the angular separation between the data points in the field of each galaxy. If the sum of the two widest angular separations is greater than 160°, we consider the azimuthal sampling coverage of the field as insufficient.
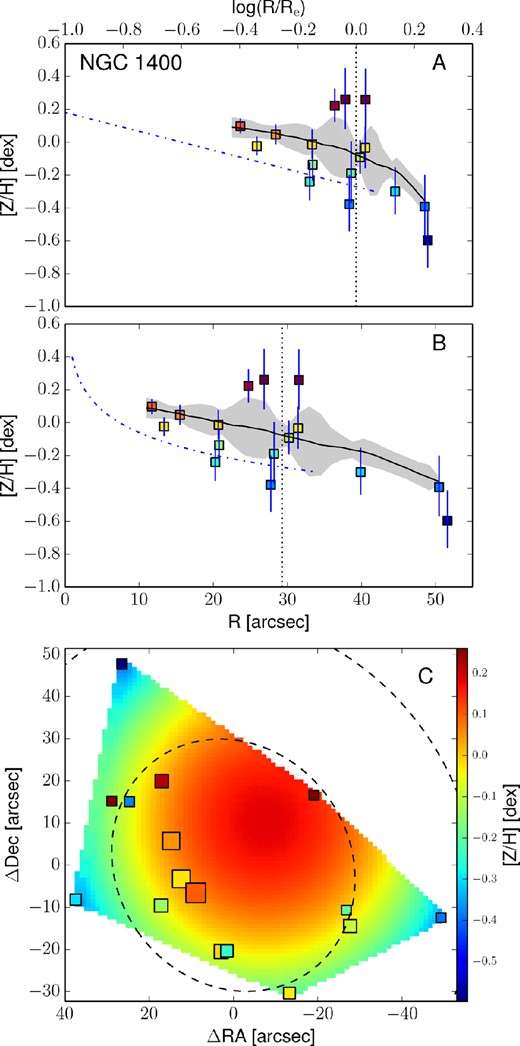
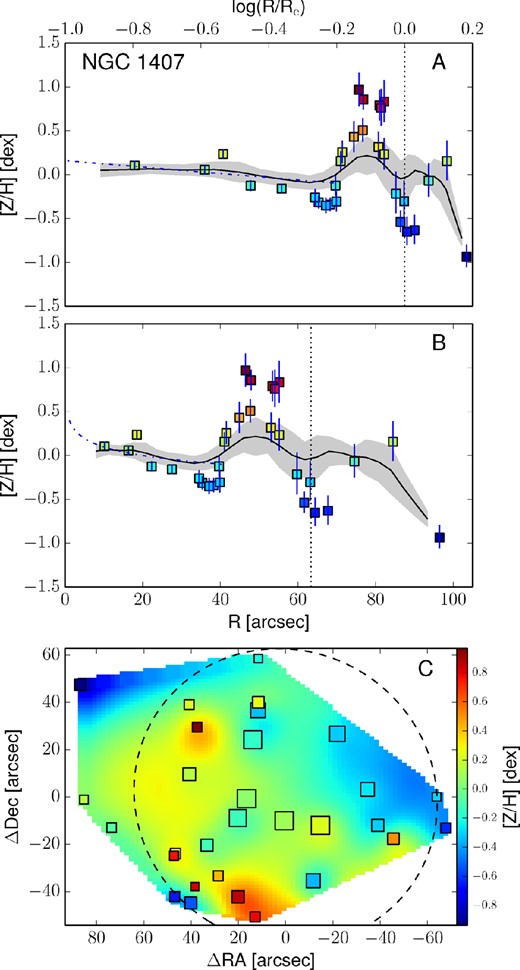
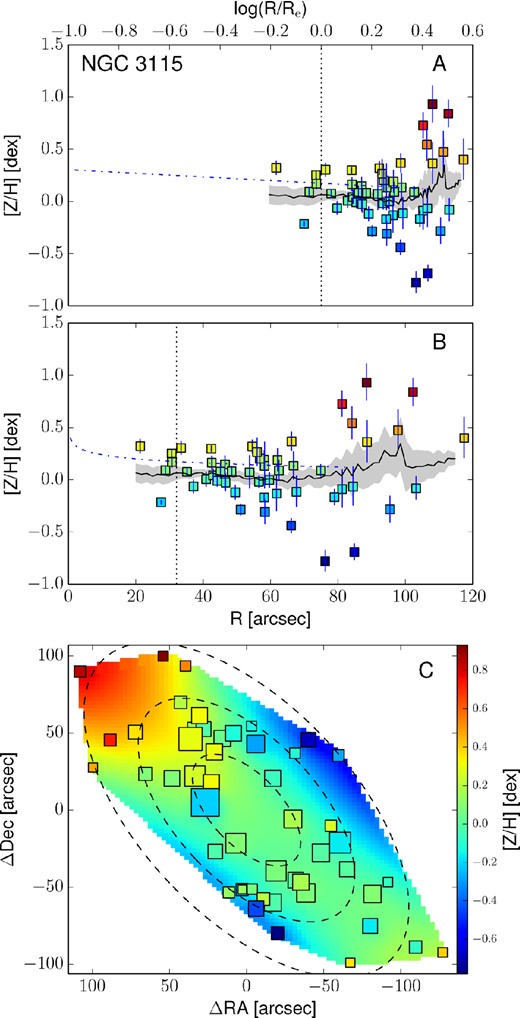
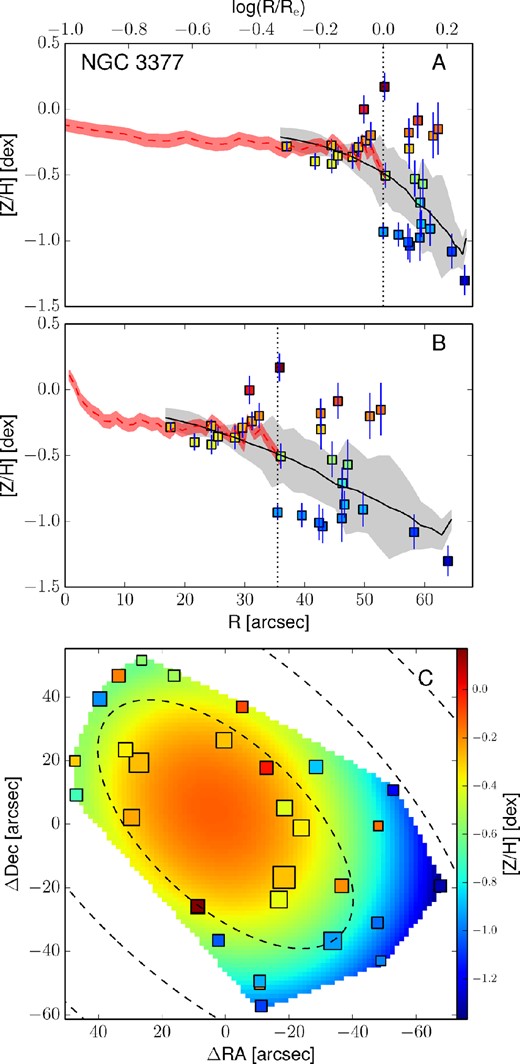
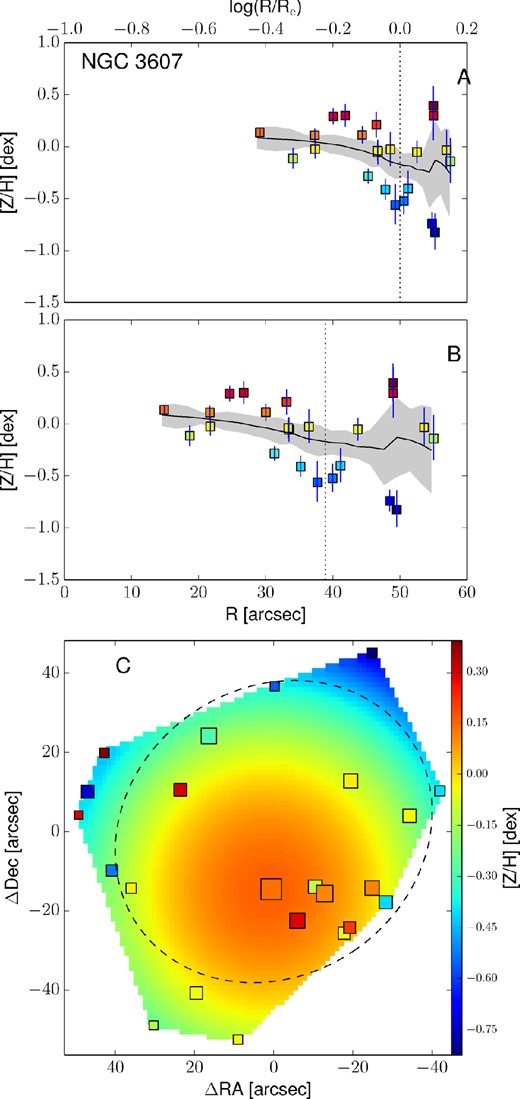
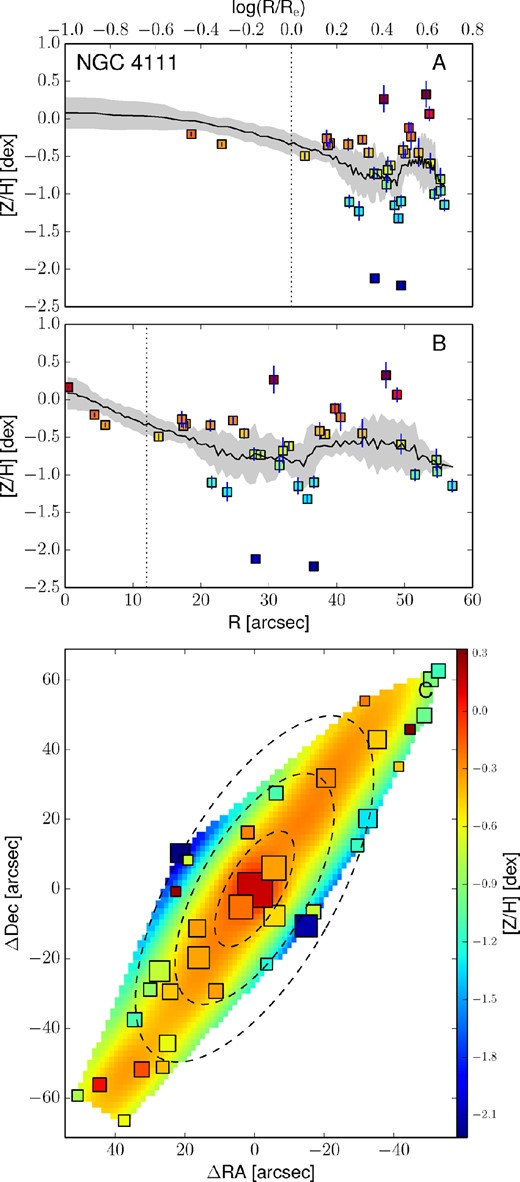
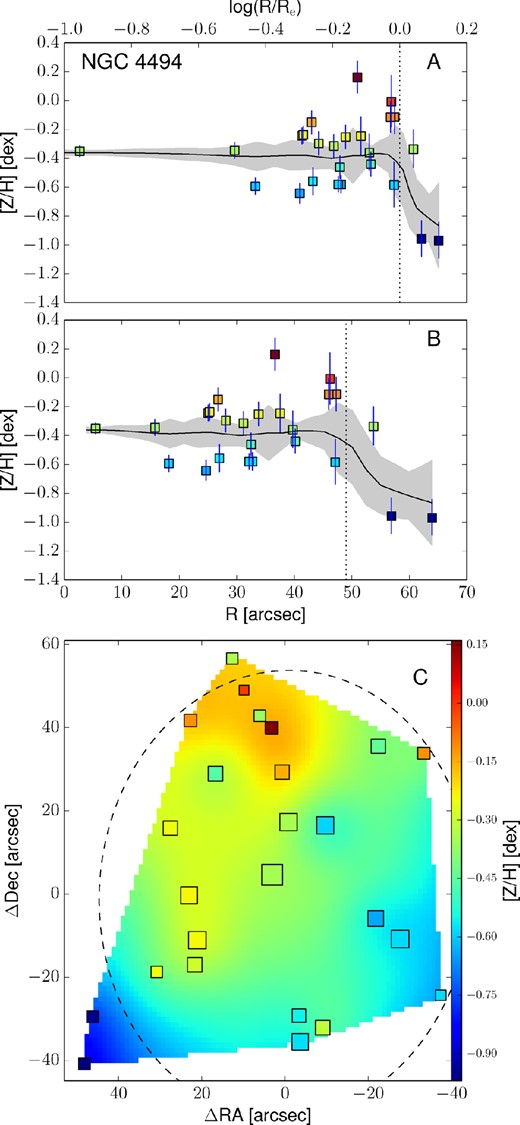
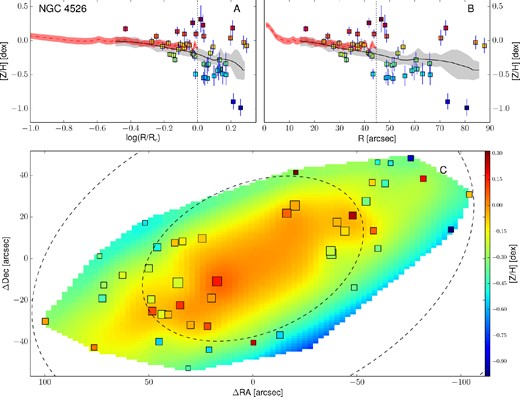
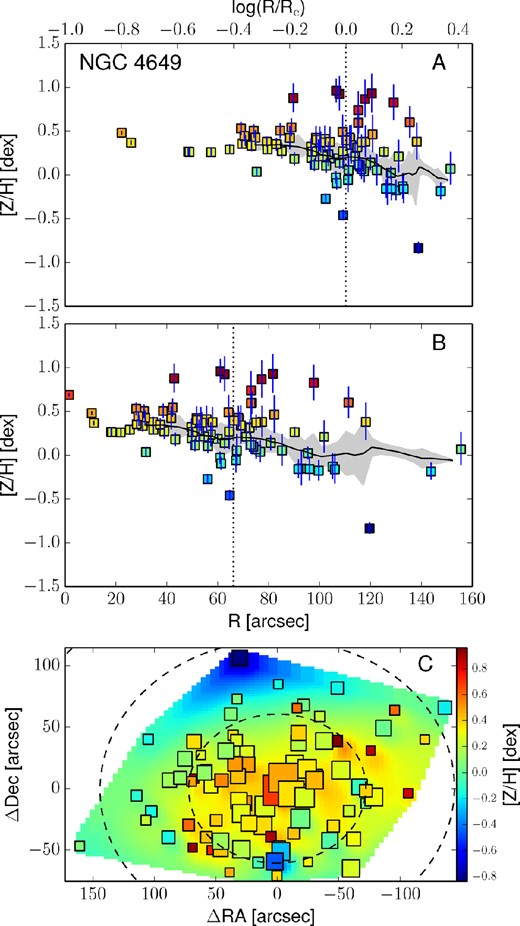
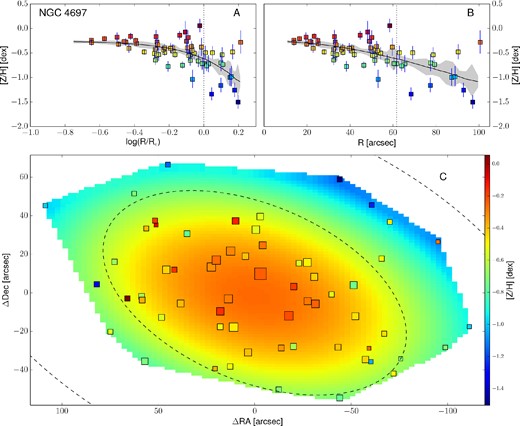
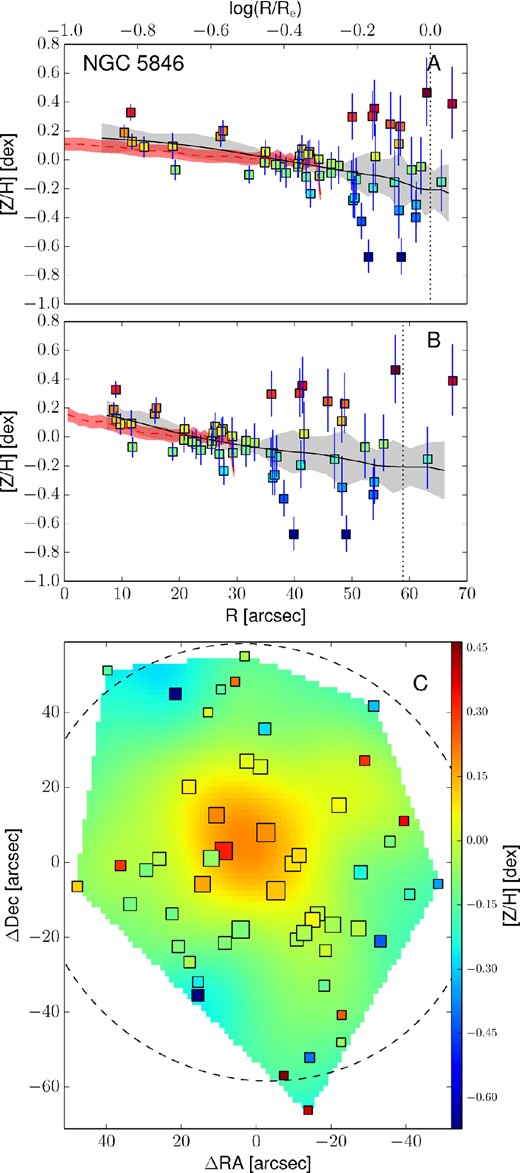
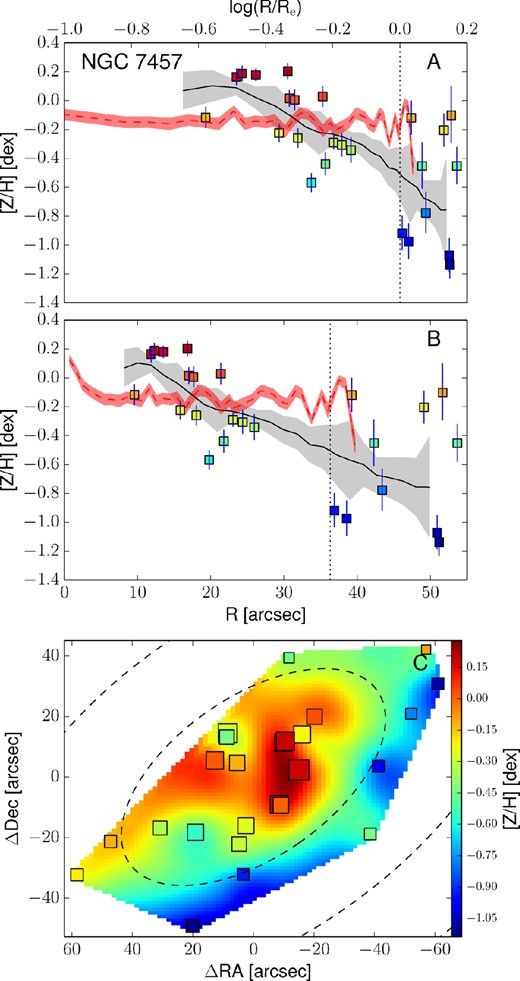
All the reliable kriging metallicity maps are presented in the bottom panels of Fig. 13 together with the individual data points. Map pixels and data points are colour coded according to their metallicity, consistently with the colour bar on the right-hand side of the map. The surface brightness isophotes at 1, 2 and 3Re are also shown as dashed black ellipses.
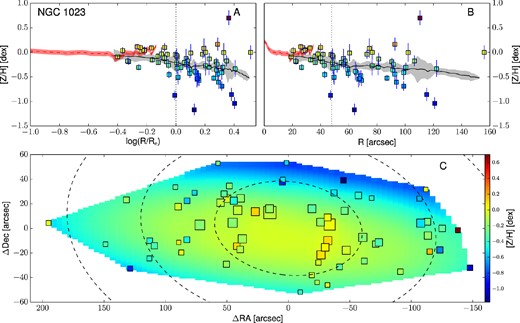
Empirically corrected 1D metallicity profiles and 2D metallicity maps. The A panels show the metallicity profiles extracted from the kriging map (black lines) with the galactocentric radius in logarithmic space. The B panels show the same profiles, but on a linear radial scale. In both these panels, the measured metallicity data points are shown as squares colour coded according to their metallicity. The black dotted vertical line shows the radius corresponding to 1Re. When available, the literature profiles are overplotted as red dashed (if SAURON profiles) or blue dot–dashed lines (see Fig. 12). In this case, the red dashed line shows the metallicity radial profile extracted from the 2D SAURON metallicity map. The C panels present the 2D metallicity maps from kriging and the measured data points colour coded according to their metallicity values. The size of each point is inversely proportional to its uncertainty. The black dashed lines show the isophotes at 1, 2 and 3Re, with ellipticity and PA from Table 1. All of the data points, radial profiles and 2D metallicity maps have been corrected with the empirical relation presented in equation (7). Panels I: the dot–dashed blue line is the metallicity profile along the major axis as measured by Spolaor et al. (2008b). Panels II: the red dashed line shows the metallicity radial profile extracted from the 2D SAURON metallicity map. Panels III: the dot–dashed line is the metallicity profile along the major axis as Norris et al. (2006).

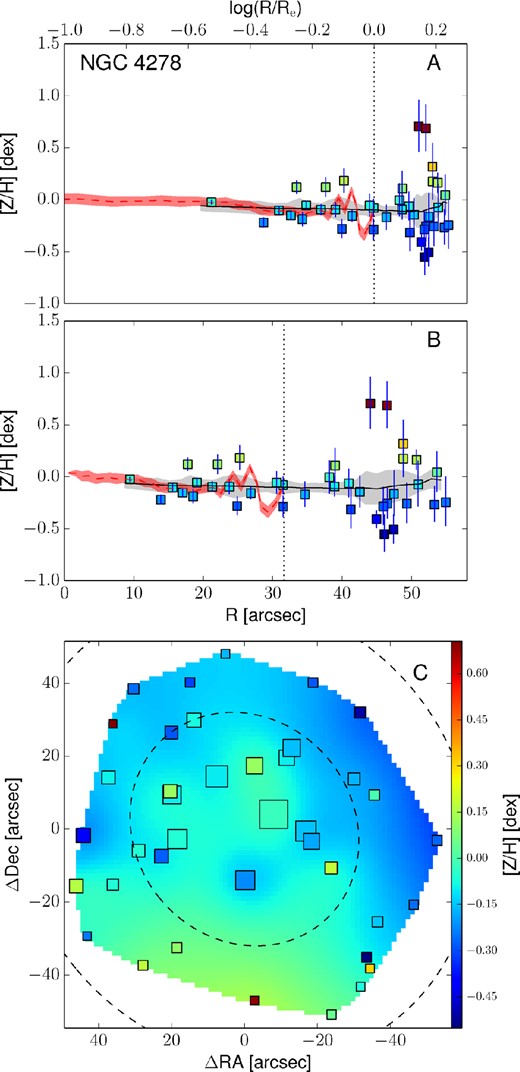
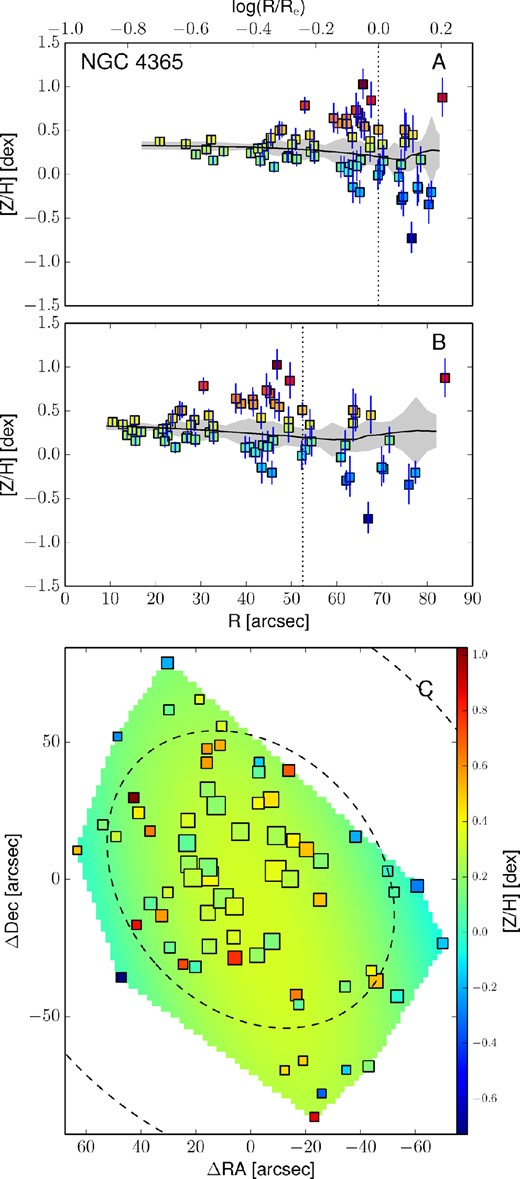
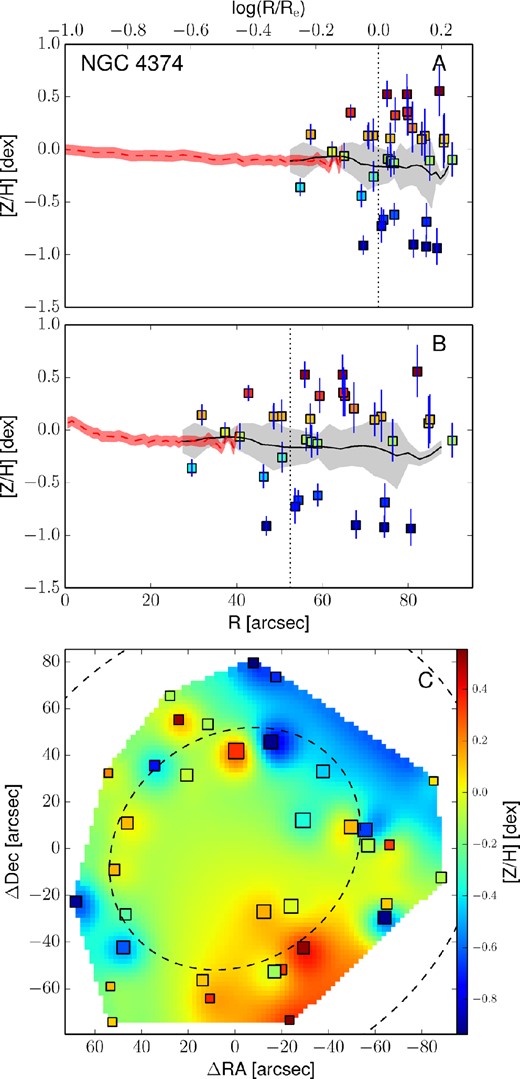
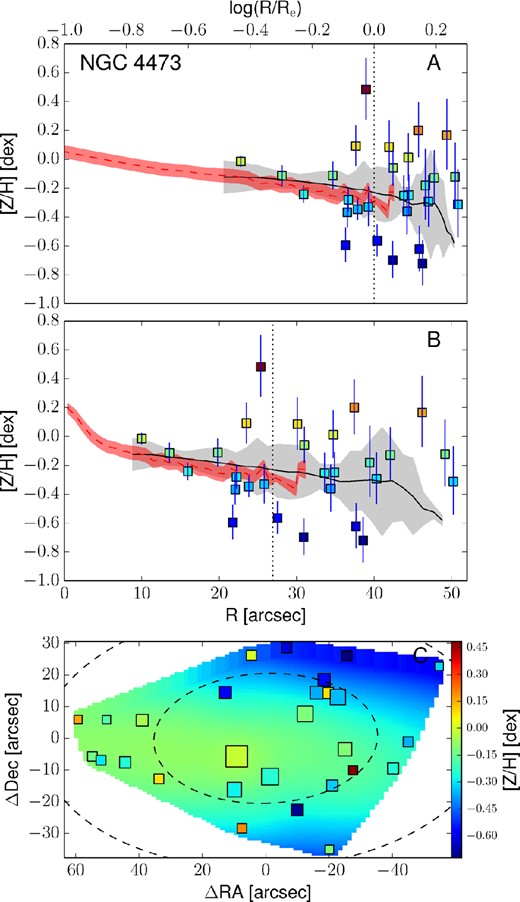
3.5 Radial profile extraction from 2D metallicity maps
The 2D metallicity maps obtained from the kriging interpolation are very useful for spotting substructures and for visualizing the 2D metal distribution of a galaxy. These maps could be used to compare the observations with 2D metallicity distribution predictions from future simulations. However, the current available simulations of ETGs predict only radial metallicity profiles. In order to compare our results with such simulation profiles, we extract azimuthally averaged 1D metallicity profiles from our kriging metallicity maps. Knowing the coordinates of each pixel, we find the circular-equivalent galactocentric radius following equations (3) and (4). We then azimuthally average the metallicity values within circular bins in the new circular-equivalent space, adopting a bin size δR = 0.05Re.
An important simplification we make is that the stellar metallicity 2D profile follows the brightness profile in a galaxy. Specifically, we measure the circular-equivalent radius of each map pixel assuming PA and axial ratio values obtained from the shape of the isophotes. In principle, the stellar metallicity may not follow the light distribution, and this could lead to systematic errors in the metallicity profile extrapolation from the maps. For example, a different ellipticity of the metallicity 2D distribution could explain the metallicity bump in NGC 4111 at 4Re. For consistency, we keep the standard approach (i.e. adopting the photometric PA and axial ratio for the metallicity distribution), acknowledging that this could cause systematic errors in the profile extraction of some of our galaxies.
The confidence limits of the metallicity profiles are obtained via bootstrapping. For each galaxy, we sample with replacement the original data set 1000 times, maintaining the same number of data points. In order to avoid degeneracies in the kriging interpolation, if in the same data set the same original point is chosen more than once, we shift its spatial position, adding a random value in the range |$-0.5<\Delta \overline{x} < 0.5$| arcsec to both the RA and Dec coordinates. This addition is physically negligible, considering that the typical DEIMOS slit is much longer (i.e. ≥4 arcsec). From these new data sets, we obtain 1000 different kriging maps from which we extract the radial profiles. For each radial bin, we extract the histogram of the profile values and, assuming a Gaussian distribution, we find the boundary values which include 68 per cent of the distribution. These values are then used as confidence limits for the real radial profiles.
The top panels of Fig. 13 present these metallicity radial profiles in both log(R/Re) and linear spaces, together with the values and the positions of the measured data points. Here, measured points are shown as squares, colour coded according to their metallicity value (see the colour bar). The black lines show the metallicity profiles extracted from the kriging map. For the galaxies in the SAURON sample we also present the metallicity radial profile extracted from the SAURON 2D metallicity maps. For NGC 1400 and NGC 1407, the radial metallicity profiles extracted along the major axis by Spolaor et al. (2008b) are shown as dot–dashed blue lines. Similarly, for NGC 3115 we present the metallicity profiles obtained by Norris et al. (2006) along the major axis, as a dot–dashed line.
In Fig. 14, we present the metallicity profiles we obtained, colour coded according to the galaxy central velocity dispersion σ (i.e. proxy for the galaxy mass). We exclude from the figure NGC 1407 and NGC 4494 and the outermost parts of NGC 3115 and NGC 4111 due to their large scatter.
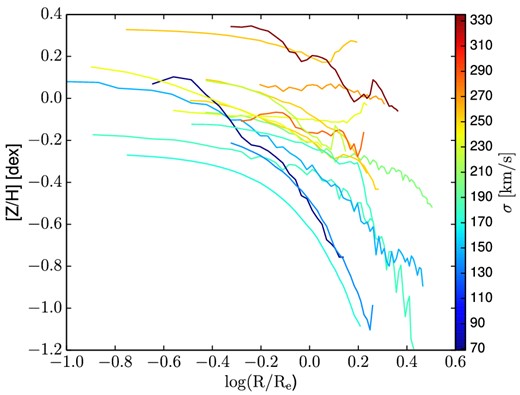
Metallicity radial profiles for the galaxies in our sample. We excluded NGC 1407 and NGC 4494 and the outer regions of NGC 3115 and NGC 4111 due to large scatter. The plot shows metallicity versus galactocentric radius scaled by Re. Each curve presents the radial metallicity profile of a galaxy, colour coded according to the galaxy central velocity dispersion defined in Table 1.
3.6 Metallicity gradients
The radial extent of our data sets allows us to probe the stellar metallicity beyond the effective radius in most cases. The metallicity profiles in the outer regions, in fact, can be compared with predictions from simulations in order to infer the scenario in which the galaxies formed. Furthermore, a comparison between the inner and the outer metallicity gradients can reveal the importance of feedback processes in galaxy formation.
Using radial profiles extracted from the kriging maps, we are able to measure the metallicity gradients up to several effective radii. However, in order to have a clean set of profiles, we exclude from the sample NGC 1407, NGC 4494 and NGC 5846. In the first case, the galaxy shows strong substructures in metallicity, which makes the measure of a metallicity gradient unreliable. Moreover, in NGC 1407 the metallicity profile extracted from the kriging map is dominated by a single point for R > Re (see Fig. 13). Similarly, NGC 4494 presents a very steep metallicity profile for R > 1Re, driven by two single points in the south-east region of the field (see Fig. 13). Lastly, NGC 5846 has only two data points at R > 1Re and, thus, we are able to reliably measure only its inner metallicity gradient.
The final sample for which we obtain the outer (inner) metallicity gradients contains 15 (16) galaxies. For these, we measure the gradients by performing a weighted linear least-squares fit for the data points in the logarithmic space [Z/H]–log (R/Re) in two different radial ranges. Because the sample includes galaxies of different galaxy sizes, in order to compare these objects (and be consistent with the literature studies) we define such radial ranges with respect to Re. In particular, we consider the inner gradients measured at −0.5 < log (R/Re) ≤ 0 (i.e. corresponding to 0.32 < R ≤ 1Re) and the outer gradients measured at 0 < log (R/Re) ≤ 0.4 (i.e. corresponding to 1 < R ≤ 2.5Re). The gradients are presented in Table 3. The uncertainties on the metallicity gradients presented in the table have been estimated via bootstrapping and represent the 1σ confidence limit.
Metallicity gradients measured on the radial profiles extracted from the 2D metallicity maps. The inner metallicity gradient values (second column) are measured in the radial region 0.32 < R ≤ 1Re (corresponding in logarithmic space to −0.5 < log (R/Re) ≤ 0). The outer metallicity gradient values (third column) are measured in the radial region 1 < R ≤ 2.5Re (corresponding in logarithmic space to 0 < log (R/Re) ≤ 0.4). In the cases where the maps do not extent out to such radii, we extrapolate the trend from the available points outside 1Re. In the case of NGC 5846, the lack of data points outside 1Re prevents the measurement of a reliable outer gradient.
| Galaxy . | Inner (0.32-1Re) . | Outer (1-2.5Re) . |
|---|---|---|
| . | (dex dex−1) . | (dex dex−1) . |
| NGC 1023 | −0.32 ± 0.03 | −0.33 ± 0.03 |
| NGC 1400 | −0.35 ± 0.03 | −1.34 ± 0.18 |
| NGC 2768 | −0.30 ± 0.02 | −1.35 ± 0.08 |
| NGC 3115 | −0.04 ± 0.02 | −0.19 ± 0.03 |
| NGC 3377 | −0.69 ± 0.05 | −2.17 ± 0.25 |
| NGC 3607 | −0.49 ± 0.08 | −0.22 ± 0.31 |
| NGC 4111 | −0.66 ± 0.04 | −1.28 ± 0.05 |
| NGC 4278 | −0.06 ± 0.01 | +0.25 ± 0.09 |
| NGC 4365 | −0.20 ± 0.03 | +0.50 ± 0.16 |
| NGC 4374 | −0.03 ± 0.05 | −0.33 ± 0.23 |
| NGC 4473 | −0.22 ± 0.02 | −1.65 ± 0.25 |
| NGC 4526 | −0.40 ± 0.03 | −0.59 ± 0.09 |
| NGC 4649 | −0.22 ± 0.09 | −0.75 ± 0.06 |
| NGC 4697 | −0.52 ± 0.07 | −2.31 ± 0.08 |
| NGC 5846 | −0.46 ± 0.02 | – |
| NGC 7457 | −1.10 ± 0.04 | −1.96 ± 0.16 |
4 RESULTS
In Fig. 15, we plot the inner and the outer metallicity gradients measured in our galaxies. The black dashed line in the plot shows the locus of points where the inner and the outer gradients are equal. From the plot, it is noticeable that very few galaxies maintain the same inner gradient outside the effective radius. In particular, most of the galaxies in our sample have an outer gradient which is much steeper than the inner one, while a somewhat reversed trend is noticeable in just three galaxies: NGC 3607, NGC 4278 and NGC 4365. NGC 3607 is consistent with having a flat outer gradient within the uncertainty and NGC 4278 has a slight positive outer metallicity profile. For NGC 4365, the apparent positive outer gradient could be driven by just the outermost data point. One can see that in Fig. 13 an overall flat metallicity gradient (in both the inner and the outer regions) could exist within the uncertainties associated with the metallicity profile.
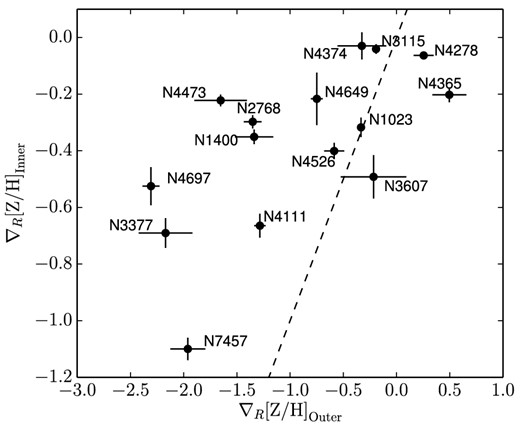
Comparison between the inner and the outer metallicity gradients. The inner metallicity gradients (|$0.32 < R \le 1\ R_{\rm {\rm {e}}}$|) are presented against those measured in the outer regions (1 < R ≤ 2.5Re). The dashed line is the 1:1 relation. Galaxies scatter about the 1:1 line, but most show a steeper metallicity gradient in the outskirts.
In our sample, there are several galaxies (e.g. NGC 3115 and NGC 4374) for which the kriging maps show the presence of metallicity substructures (see Fig. 13). Such metallicity substructures could be the cause of the mild metallicity gradients we measure in the outer regions of these galaxies. Since most of these substructures in the kriging maps are obtained from a significant number (i.e. N > 5) of nearby data points, we believe they may be real. Higher spatial density coverage is required to confirm these substructures.
Our data expand the mass range in the literature for which the outer metallicity gradients have been measured. In Fig. 16, we plot the metallicity gradients measured in the outer regions of our galaxies along with the stellar central velocity dispersion σ0, the total dynamical mass Mdyn and the total stellar mass M*.
![Outer (1-2.5 Re) metallicity gradient trends with galaxy mass proxies. The outer metallicity gradient ∇R[Z/H]Outer is shown against the central stellar velocity dispersion σ0, the dynamical mass Mdyn and the stellar mass M* from the K-band luminosity, in the left, central and right panel, respectively. Steeper metallicity gradients are upwards on the plot. The black circles show the galaxies in our sample, while the green squares are the values from Greene et al. (2012), the blue star is NGC 4472 from Mihos et al. (2013) and the red triangle is NGC 4889 from Coccato, Gerhard & Arnaboldi (2010). The black solid lines are the linear fits to our sample (including NGC 7457) in all the cases. Thanks to the range in mass covered by this study, we are able for the first time to investigate the correlation between outer metallicity gradients and galaxy mass. In particular, each panel shows that steeper outer metallicity profiles are found in low-mass ETGs and shallower in giant ETGs.](https://oup.silverchair-cdn.com/oup/backfile/Content_public/Journal/mnras/442/2/10.1093/mnras/stu937/2/m_stu937fig16.jpeg?Expires=1749957190&Signature=expxUuAHDPZHmNclo62~oInsJB05uweg-~tcKQlBlunOKM0qAy2hzJTuXPg2RzlOS88K2tfYyv5bKF76vl8FonNHwf6akqgzwdwOrMg1KhS~BXjM4qlKLQGsHknO0Sj9bK8u-XPo5Jdw3cXCRIHCjfEsMDVJCZVhiBbl5ALf-mo3jGOlbmtjEX7EZCqswScrlAQuzlFr93ZW5oqSVhhm5DzP8hDzuEqCh5ZRO7QT9JIZAlgg6vFKxVxTwLwI5XtwEPtUoac-LKkpnHCu40gczryb15e5htwiKka1GUD6XjlAYQ00JRdEg7enHJCp7ypM4d~vOidEI77IsQbdR7qnOQ__&Key-Pair-Id=APKAIE5G5CRDK6RD3PGA)
Outer (1-2.5 Re) metallicity gradient trends with galaxy mass proxies. The outer metallicity gradient ∇R[Z/H]Outer is shown against the central stellar velocity dispersion σ0, the dynamical mass Mdyn and the stellar mass M* from the K-band luminosity, in the left, central and right panel, respectively. Steeper metallicity gradients are upwards on the plot. The black circles show the galaxies in our sample, while the green squares are the values from Greene et al. (2012), the blue star is NGC 4472 from Mihos et al. (2013) and the red triangle is NGC 4889 from Coccato, Gerhard & Arnaboldi (2010). The black solid lines are the linear fits to our sample (including NGC 7457) in all the cases. Thanks to the range in mass covered by this study, we are able for the first time to investigate the correlation between outer metallicity gradients and galaxy mass. In particular, each panel shows that steeper outer metallicity profiles are found in low-mass ETGs and shallower in giant ETGs.
In a random motion dominated stellar system such as an ETG, the stellar central velocity dispersion is a proxy for the gravitational potential (and thus for the total galaxy mass). We find that a correlation exists between this value and the outer metallicity gradient, with the higher central velocity dispersions corresponding to shallower outer metallicity profiles.
The right-hand panel of Fig. 16 shows the outer metallicity gradients against the total stellar mass of our galaxies measured from the total K-band absolute magnitude. These are given in Table 1. For the Coccato et al. (2010), Greene et al. (2012) and Mihos et al. (2013) galaxies the K-band absolute magnitudes are from 2MASS (Jarrett et al. 2000). In the case of Greene et al. (2012), the distances are from HyperLeda archive, while for NGC 4889 and NGC 4472 we adopt the distances given in Coccato et al. (2010) and Mihos et al. (2013), respectively. These magnitudes are then converted to stellar mass assuming (M/L)K = 1, which is consistent with that used by Forbes et al. (2008) for an old (i.e. 12.6 Gyr) stellar population with nearly solar metallicity. This value is obtained for a Chabrier (2003) IMF, which is essentially identical to the Kroupa (2002) IMF. In order to obtain the mass values for a Salpeter (1955) IMF, we have to add 0.2 dex to the mass in logarithmic space (see Conroy & van Dokkum 2012). A different (M/L)K would not affect the relation, as long as this ratio does not vary between the galaxies. In fact, this value is expected to be universal for ETGs within a 10 per cent confidence level (Fall & Romanowsky 2013). In addition, (M/L)K is very insensitive to metallicity at old ages (e.g. a change of ±0.5 dex in [Z/H] corresponds to a variation ΔM/LK of only ∼0.01). However, if there is a systematic IMF change with mass, (M/L)K would be affected by it. In particular, higher mass galaxies (with steeper IMFs) would have higher (M/L)K.
In summary, the outer metallicity gradients of the galaxies in our sample correlate with their stellar mass. Most of the galaxies in our sample present a steeper metallicity profile for R > 1Re with respect to the inner regions. Moreover, the gradients show a correlation with three different mass proxies, with the smaller galaxies showing increasingly steeper metallicity gradients in the outskirts. Comparison with theoretical predictions is discussed in Section 5.
4.1 Metallicity gradients outside 2.5Re
We can also probe the metallicity profiles outside 2.5Re in the four galaxies NGC 1023, NGC 2768, NGC 3115 and NGC 4111 up to, respectively, 3.2, 2.7, 3.6 and 4.7Re. Unfortunately, only NGC 1023 is not affected by poor azimuthal coverage of the 2D field outside 2.5Re. For this galaxy, we measure a gradient ∇R = −1.47 ± 0.06 dex dex− 1 in the region 2.5 < R < 3.2Re, which is much steeper than the value measured within 1 < R < 2.5Re. With just one profile we cannot make any statistically meaningful statement about the metallicity trends in this radial range.
5 DISCUSSION
In this section, we discuss theoretical predictions for the metallicity gradients of ETGs in the inner (R < 1Re) and outer (R > 1Re) regions from different galaxy formation models. We also discuss observational results from the literature, comparing them with our findings. Historically, metallicity gradients have been mostly measured on a logarithmic radial scale, in order to have scale-free values which follow the galaxy light distribution. For the literature metallicity gradients measured on a linear scale, we convert them to a logarithmic scale for consistency purposes.
5.1 Inner and outer metallicity gradients
5.1.1 Theoretical predictions
Different formation scenarios predict different metallicity gradients in the inner and outer regions of galaxies. If a galaxy forms its stars mostly via dissipative collapse, its metallicity gradient shows a rapid decline with radius (Carlberg 1984). As gas falls towards the gravitational centre due to dissipation, it is chemically enriched by contributions from evolved stars so that new stars in the centre are more metal rich than at larger radii (Chiosi & Carraro 2002). This enrichment process is more efficient in the stronger gravitational potential of large galaxies, so both the steepness of the metallicity gradient and the central metallicity are expected to increase with the mass of the galaxy. Hydrodynamical simulations by Pipino et al. (2010) showed that, in the context of quasi-monolithic formation, inner metallicity gradients can be as steep as ∇R[Z/H] = −0.5 dex dex− 1, with a typical value of ∇R[Z/H] = −0.3 dex dex− 1. Similarly, the simulations of Kawata & Gibson (2003) predict in this scenario an average metallicity gradient ∇R[Z/H] = −0.3 for the typical galaxies, which slightly steepens in the case of high-mass galaxies. The simulations of Kobayashi (2004) returned steeper metallicity gradients (i.e. ∇R[Z/H] = −0.46 dex dex− 1) in the range 0.03 < R < 2Re for galaxies formed monolithically.
On the other hand, dry mergers between galaxies of comparable size (i.e. major mergers) flatten the pre-existing gradient up to 3Re (Di Matteo et al. 2009). In this case, Kobayashi (2004) measured a typical metallicity gradient of ∇R[Z/H] = −0.19 dex dex− 1 in the range 0.03 < R < 2Re. In the same work, it was shown that lower mass ratio mergers progressively flattened the metallicity gradients.
If the mergers are rich in gas, the gas sinks to the centre of the gravitational potential, where it triggers new star formation. Such a process will enhance the metallicity in the innermost regions, increasing the metallicity gradient within 1Re. Hopkins et al. (2009) found that these new inner metallicity gradients can be as steep as ∇R[Z/H] = −0.8 dex dex− 1. However, the outer regions are little affected by gas accretion and the outer metallicity gradients are flattened by the violent relaxation process.
The two-phase model predicts that the early stages of galaxy formation resemble the dissipative collapse model. Eventually, most galaxies are supposed to increase their size by accreting low-metallicity stars in their outer regions via minor mergers, i.e. ex situ stars (Lackner et al. 2012; Navarro-González et al. 2013). If the accreted galaxies are rich in gas, the predictions for the inner metallicity gradients resemble those from the gas-rich major merger picture (e.g. Navarro-González et al. 2013). From the plots of Navarro-González et al. (2013), in the range 0.2 < R < 1Re, one expects a tiny increase of the inner metallicity profile's steepness of − 0.03 dex dex− 1 due to the new star formation in the central regions. This value may be even steeper if the innermost regions (R < 0.1Re, where the metallicity profile peaks) are included.
The two-phase scenario predictions for the metallicity in the outer regions vary between different studies. Cooper et al. (2010) found from simulations that a high number of mergers is necessary in order to completely wash out the pre-existing metallicity gradient in these regions. According to Navarro-González et al. (2013), ex situ formed stars contribute no more than 10–50 per cent to the final galaxy stellar mass. For this reason, the metallicity gradients outside 1Re should not be noticeably different from those of galaxies experiencing a quiescent evolution (i.e. without mergers). From their plots, we estimate the outer metallicity gradients in the range 1 < R < 2.5Re for both the merger-dominated and the quiet evolution cases, as ∇R[Z/H] ≈ −0.3 dex dex− 1.
The simulations in a cosmological context by Lackner et al. (2012) roughly agree on the total stellar mass contribution by accreted stars (i.e. 15–40 per cent) and their external location in the final galaxy. However, this work found that the low metallicity of accreted stars may create strong outer metallicity gradients. Taking into account metal cooling and galactic winds in their (minor merger) simulations, Hirschmann et al. (2013) showed that the metallicity gradients in the outskirts depend on the mass of the accreted satellites and, consequently, on the mass of the main galaxy. They thus predict steeper outer metallicity gradients in low-mass galaxies (this is discussed further in Section 5.2).
In summary, stars formed via dissipative collapse should result in a steep metallicity profile in both the inner and outer regions of ETGs. In general, major mergers flatten the metallicity profile in both inner and outer regions. However, if these mergers are gas rich, they can steepen the slope of the metallicity gradients within 1Re. On the other hand, dry minor mergers may either flatten or steepen metallicity gradients in the outer regions.
5.1.2 This work
In Section 3.6, we measured the metallicity gradients in both the inner (0 < R < 1Re) and outer (1 < R < 2.5Re) regions of our galaxies. In Fig. 15, we compared the inner to the outer metallicity gradients.
Most galaxies in our sample have steeper outer metallicity gradients than the inner ones, resembling the results of Lackner et al. (2012) and Hirschmann et al. (2013) hydrodynamical simulations. Both these works take into account metal cooling and predict the outer regions to be populated by accreted low-metallicity stars. In addition, the Hirschmann et al. (2013) simulations also include galactic wind feedback, which affects the star formation efficiency of the accreted objects that have different initial masses. Eventually, this extra feedback process leads to a wide range of outer metallicity gradients in the final galaxy. This range could be even wider if there is a radially variable IMF (see Section 5.3).
Predictions from gas-poor major merger simulations agree on a flattening of the metallicity gradients in both the inner and the outer regions, due to violent relaxation. The majority of our galaxies do not present both flat inner and outer gradients. Our data thus suggest that dry major mergers are infrequent in the evolutionary history of ETGs, consistent with the predictions of Lackner et al. (2012, see also Scott et al. 2013). Flat inner and outer profiles are noticeable in only two ETGs in our sample: NGC 4278 and NGC 4365. Both galaxies show signs of recent merger events. NGC 4278 hosts a massive distorted H i disc (Knapp, Kerr & Williams 1978) which is misaligned with respect to both stellar kinematics and the photometric axis (Morganti et al. 2006). In the case of NGC 4365, we have strong indications that a minor merger event is ongoing (Blom et al. 2012, 2014), while the presence of a third GC subpopulation may indicate a past major merger event.
In the case of gas-rich major mergers, the inner metallicity gradient could be steepened by new star formation, but in the outer regions a flat metallicity gradient is still expected. One galaxy in our sample (i.e. NGC 3607) with such features may have undergone a gas-rich merger event. The central region of NGC 3607 hosts a stellar-gaseous polar disc with hints of ongoing star formation (Afanasiev & Silchenko 2007).
In general, because we do not probe the very central regions of our galaxies (i.e. where the metallicity peaks), our inner measurements should be considered as lower limits to the real metallicity profile's steepness. However, it is possible to notice in Fig. 13 that the available literature metallicity inner profiles do not show radial gradients significantly different from those we have extracted at R < 1Re in all the galaxies in common, except NGC 7457. Such galaxies do not show a steep metallicity gradient in the very central regions, which argues against gas-rich mergers in their recent formation histories.
5.2 Metallicity gradient trends with galaxy mass
5.2.1 Theoretical predictions
Depending on the adopted galaxy formation mode, different relations between the metallicity gradients and the final galaxy mass are predicted. The simulations of Pipino et al. (2010) showed that a mild metallicity gradient trend with mass may exist in quasi-monolithic formation, with more massive galaxies having steeper gradients. On the contrary, if the main galaxy formation mode involves gas-rich major mergers, no clear trends of the metallicity gradient with mass are expected (Hopkins et al. 2009). In this case, the lack of a mass/metallicity gradient relation is supported by the predictions of Kobayashi (2004) in the range 0.03 < R < 2Re.
In the two-phase formation scenario, a relation between the outer metallicity gradient and the galaxy mass could be linked either with the number or the mass of the accreted satellites. In the first case, Cooper et al. (2010) showed how a low number of mergers preserves a pre-existing metallicity gradient, while many accretion episodes can completely erase it. In the second case, Hirschmann et al. (2013) predicted that, on average, massive galaxies accrete higher mass satellites. Because these satellites can retain more of their own gas against stellar winds, their stars have generally higher metallicities than smaller satellites and, once accreted by the main galaxy, contribute more to the flattening of the pre-existing metallicity profile (Hirschmann, private communication). In both these cases, one should expect shallower gradients in the outer regions of high-mass galaxies, and steep metallicity profiles in low-mass galaxies.
5.2.2 Previous observations
In their sample of ETGs, Spolaor et al. (2010) found that the metallicity gradients measured within R < 1Re correlate with σ0 in the mass range 1.6 < log σ0 < 2.15 with lower mass galaxies showing shallower profiles than higher mass galaxies. In addition, they found that for log σ0 > 2.15 an anticorrelation exists and the more massive galaxies have shallower profiles than the less massive ones. The authors claimed that the two different mass regimes (i.e. low mass and high mass) are linked with two different galaxy formation modes. In the low-mass regime, the formation may be dominated by the initial gas collapse and the star formation efficiency is linked with the gravitational potential (i.e. the higher the mass, the deeper the potential and hence the steeper the metallicity gradient). On the other hand, during their evolution, high-mass galaxies experience a high number of mergers. The frequency of these events increases with galaxy mass and, if such mergers flatten the metallicity gradient also in the inner regions, it is not surprising that the higher is the galaxy mass, the shallower is the metallicity distribution. While the relation Spolaor et al. (2010) found in the low-mass regime is tight, in the high-mass regime there is a clear scatter. This scatter has been justified as the consequence of different interplaying variables during merger processes. Conversely, Koleva et al. (2011) found a variety of metallicity gradients for dwarf galaxies and no evidence of connection with the galaxy mass.
In recent years a few studies have been able to spectroscopically probe the metallicity gradients at R > 1Re. The eight massive ETGs in Greene et al. (2012) revealed shallow metallicity gradients up to 2.5Re with a typical value ∇R[Z/H] ≈ −0.2 dex dex− 1 in their mass range 2.2 < log σ0 < 2.5.
With a larger sample of galaxies, Greene et al. (2013) did not find noticeable differences in the outer (R > 2Re) metallicity gradients of galaxies in their mass range (i.e. 1.6 < log σ0 < 2.6). Coccato et al. (2010) measured the metallicity gradient of NGC 4889 within R < 1.2Re and in the range 1.2 < R < 4Re. For this massive galaxy, they found a steep metallicity gradient in the central region (i.e. ∇R[Z/H] = −0.5 dex dex− 1) and a very shallow gradient outside it (i.e. ∇R[Z/H] = −0.1 dex dex− 1).
To explore the metallicity at even larger radii the only viable approach is through deep photometric imaging. With this approach, La Barbera et al. (2012) found steeply declining metallicity profiles in both giant and low-mass ETGs, suggesting that the accreted stars are more metal poor than those formed in situ in the external regions, regardless of the galaxy mass. In agreement with La Barbera et al. (2012), Prochaska Chamberlain et al. (2011) did not find a correlation between metallicity gradients and galaxy mass in their sample of lenticular galaxies probed out to 5Re.
For the massive galaxy NGC 4472, Mihos et al. (2013) found a very steep colour gradient up to 7Re. Such a colour gradient can be explained only as a very strong negative metallicity gradient, which, in the case of an old stellar population, can be as steep as ∇R[Z/H] ≈ −3 dex dex− 1 at 1000 arcsec from the centre. Even though the main colour of the accreted satellite is bluer than that of the main galaxy, the in situ formed stars in the outer regions should be more metal poor than the accreted ones. Accretion may thus increase the metallicity in the outer regions, decreasing the metallicity gradient. For this reason, Mihos et al. (2013) claimed that the steep metallicity gradient in the halo of NGC 4472 can only be formed during the initial collapse phase, with negligible contributions by later accretion.
5.2.3 This work
In this section, we discuss our results in relation to the predictions from simulations and compare them to previous observations. The metallicity gradients measured in the range 1 < R < 2.5Re strongly correlate with galaxy mass, with steeper gradients associated with low-mass galaxies (Fig. 16). This reinforces the scenario in which low-mass galaxies are mostly composed of stars formed in situ, and thus the chemical enrichment (i.e. the metallicity) strongly decreases with galactocentric radius. Such a trend would be conserved by minor mergers, which contribute low-metallicity stars to the outermost regions. For high-mass galaxies, the probability of merging events during their evolution is higher. In Fig. 16, higher mass galaxies have flatter outer metallicity gradients (and, thus, a higher number of accreted stars). This is consistent with the predictions of the two-phase formation scenario and, in particular, with the simulations of Hirschmann et al. (2013).
NGC 1023 is the only galaxy for which we have a reliable measurement of the metallicity gradient beyond 2.5Re (see Section 4.1). This gradient is very steep (i.e. ∇R[Z/H] = −1.47 dex dex− 1) and might suggest a change in metallicity gradients for radii larger than 2–3 Re.
5.2.4 Three different radial ranges in ETGs?
We may speculate at this point that the metallicity gradient has different behaviours in the different radial regions of ETGs. In the inner regions (i.e. R < 1Re), the gradient may correlate with galaxy mass, following the relation found by Spolaor et al. (2010). An exception are the few galaxies that experienced major mergers in their history. These galaxies show flat metallicity gradients, regardless of their mass. At larger radii (i.e. 1 < R < 2.5Re), the metallicity gradient strongly depends on the accretion of ex situ formed stars and, thus, is steeper in low-mass galaxies and shallower in high-mass galaxies. At even larger radii, the limited long-slit and photometric observations suggest very steeply declining metallicity profiles. These regions are populated by a very metal poor stellar population which could be the original component of the main system and may even be similar for all galaxies. This component did not chemically enrich itself because of its low stellar density. However, direct measurements of the stellar population at these galactocentric radii can be pursued only through deep photometric observations and may be affected by a number of issues (e.g. age/metallicity degeneracy, red halo effect, sky-subtraction, etc.).
5.3 Radial IMF variations
In Section 3, we found evidence for a relation between the CaT index and the slope of the stellar IMF, which may be linked via the mass of the galaxy (Fig. 11). While Lick indices are largely independent of the IMF, the CaT is strongly affected by the presence of giant stars in the stellar population. Thus, a steeper IMF slope is associated with more dwarf stars and lower CaT indices for a given metallicity. Because the IMF steepness correlates with the total galaxy mass, it is not surprising that the difference between CaT-derived and Lick-derived metallicities is higher in more massive galaxies (as seen in Fig. 11).
An important caveat here is that we assume a radially constant IMF for each galaxy. We can speculate about how our metallicity gradients will change with a radially changing IMF slope. Recent studies have shown how low-mass galaxies tend to have a more bottom-light IMF than massive galaxies (Cenarro et al. 2003; Thomas, Maraston & Bender 2003b; Conroy & van Dokkum 2012; Ferreras et al. 2013). Thus, if the IMF varies with radius, it should be more bottom light at larger radii (e.g. where ex situ formed stars dominate). This radial dependence of the IMF has also been proposed by Carollo et al. (2014) to explain the different carbon-enhanced metal-poor stellar populations they observed in the inner and outer halo of the Milky Way.
The corrections we apply to our CaT-derived metallicities are derived from offset measures with Lick indices-derived metallicities (i.e. from SAURON) within 1Re. In the case of a more bottom-light IMF at large radii, such a correction is an overestimation of the real offset between the two metallicity measurements. Thus, the true metallicities in the massive galaxies’ outskirts would be lower and, in general, the outer metallicity gradients slightly steeper in all galaxies. This effect would be most pronounced for the most massive ETGs in our sample.
We qualitatively address this issue by estimating the metallicity gradient that a low- and a high- mass galaxy in our sample (i.e. NGC 3377 and NGC 4649), would have under the assumption of a pure Salpeter (1955) IMF at R = 2.5Re. We also assume that the metallicity offset between ours and SAURON galaxies is valid at R = 1Re and is entirely due to a different IMF slope. From the value of the metallicity at R = 2.5Re (assuming a fixed IMF slope of μ ≡ 1.3) and the corrected metallicity at R = 1Re (with a steeper IMF slope of μ > 1.3) we can thus re-estimate the outer metallicity gradients for an IMF slope which varies with radius.
In particular, for NGC 3377 we have a corrected metallicity of [Z/H] = −0.49 dex at 1Re and an μ ≡ 1.3 metallicity of [Z/H] = −1.38 dex at 2.5Re. The metallicity gradient is therefore ∇R[Z/H] = −2.24 dex dex− 1, i.e. consistent with the one in the case of a radially constant IMF (i.e. ∇R[Z/H] = −2.17 ± 0.25 dex dex− 1). This is not surprising, considering that the IMF we extracted for this galaxy in Section 3.3.2 was already close to a Salpeter (1955) IMF (see Fig. 9).
For NGC 4649, a massive galaxy, the applied empirical correction is larger than for NGC 3377. The corrected metallicity is [Z/H] = +0.19 dex at 1Re and the μ ≡ 1.3 metallicity is [Z/H] = −1.58 dex at 2.5Re. The outer metallicity gradient of NGC 4649 would be ∇R[Z/H] = −4.45 dex dex− 1, i.e. much steeper than in the case of a radially constant IMF (i.e. ∇R[Z/H] = −0.75 ± 0.05 dex dex− 1).
In conclusion, if the metallicity offset between our profiles and those of SAURON are completely caused by the different (galaxy mass dependent) IMF, we find that our metallicity gradients depend on the radial behaviour of the IMF. In massive galaxies, a radially changing IMF slope would lead to steeper inferred outer metallicity profiles than in low-mass galaxies, potentially cancelling out the relation between the outer metallicity gradient and the galaxy mass we observe (Fig. 16). However, we note that the outer metallicity gradients for the most massive galaxies in our sample (under the assumption of a radially constant IMF) are similar to the gradients measured by Coccato et al. (2010), Greene et al. (2012) and Mihos et al. (2013) for their massive galaxies using optical lines that are largely IMF invariant. Thus, a strong radial decrease of the IMF slope is unlikely, and the relation between outer metallicity gradient and galaxy mass will be preserved.
6 CONCLUSIONS
In this work, we have explored the stellar metallicity in 22 nearby ETGs out to several effective radii. Adopting the SKiMS technique for multislit wide-field spectroscopic data, we have been able to obtain stellar spectra in the outer regions of these galaxies. From the spectra, we extracted the CaT index, which we converted into total metallicity [Z/H] assuming a Salpeter (1955) IMF. The CaT feature is largely insensitive to age in old stellar populations, which is generally the case for ETGs. We compared these raw CaT-derived metallicities with those obtained from Lick indices by the SAURON survey for the galaxies in common between the two samples, finding a noticeable offset in most of the cases. This comparison led to a correlation between the galaxy central velocity dispersion (a proxy for galaxy mass) and the difference between these two different estimates of the metallicity. We used this relation to empirically correct the CaT index-derived metallicity values in each of our galaxies. This relation supports the idea that the CaT index is influenced by the IMF of a galaxy. In addition, we obtained the IMF slopes necessary to produce the observed metallicity offsets. Such slopes show a trend with galaxy mass that is consistent with recent models in the literature, with higher mass galaxies having the steeper IMFs.
From the empirically corrected metallicity values, we obtained 2D metallicity maps, using the kriging interpolation technique. From these maps, we extracted azimuthally averaged metallicity radial profiles. For most of our galaxies, these profiles extend to 2.5Re, allowing us to compare the metallicity gradients between the inner and the outer regions with the predictions from simulations.
We found evidence that the low-mass galaxies in our sample have steep inner and outer gradients. This is qualitatively consistent with the model in which most of their stars formed in situ, while the few accreted satellites have low metallicity because of the relatively strong stellar wind feedback. Massive galaxies show metallicity gradients consistent with an increased contribution of accreted stars. While the inner profiles have a steepness comparable with those of most low-mass galaxies, the outskirts become shallower with increasing galaxy mass. This behaviour of massive ETGs resembles the results from simulations, in which stars in their outskirts are mostly accreted from satellites massive enough to have self-enriched. In this way, the accreted stars, once mixed with those formed in the galaxy outskirts, partially erase any pre-existing metallicity gradient. Our findings may provide important constraints to distinguish between different stellar and AGN feedback models in low-mass galaxies and in the satellites later accreted by the present-day massive ETGs. In future, it will be possible to extend this study integrating photometric, kinematic and dynamical constraints (e.g. Arnold et al. 2011). The addition of large-radius optical spectroscopy will also help to deal with age and IMF uncertainties, while refined simulations are needed for comparison.
We want to thank the (anonymous) referee for the useful comments and suggestions which helped to improve this paper. We are also grateful to S. Courteau, M. Hirschmann, S. Kartha, J. Roediger, P. Sánchez-Blázquez and L. Spitler for comments and suggestions. Moreover, we wish to thank N. Scott, E. Emsellem, H. Kuntschner and the ATLAS3D team for sharing unpublished data from their survey. We acknowledge the Department of Physics and Astronomy at University of Padova for the helpful environment provided during part of this work. Some of the data presented herein were obtained at the W. M. Keck Observatory, operated as a scientific partnership among the California Institute of Technology, the University of California and the National Aeronautics and Space Administration, and made possible by the generous financial support of the W. M. Keck Foundation. The authors wish to recognize and acknowledge the very significant cultural role and reverence that the summit of Mauna Kea has always had within the indigenous Hawaiian community. The analysis pipeline used to reduce the DEIMOS data was developed at UC Berkeley with support from NSF grant AST-0071048. This research has made use of the NASA/IPAC Extragalactic Database (NED) which is operated by the Jet Propulsion Laboratory, California Institute of Technology, under contract with the National Aeronautics and Space Administration. We acknowledge the usage of the HyperLeda data base (http://leda.univ-lyon1.fr). DF thanks the ARC for support via DP130100388. JB acknowledges support from NSF grant AST-1109878. This work was also supported by National Science Foundation grant AST-0909237.
Paturel et al. (2003), http://leda.univ-lyon1.fr
REFERENCES
APPENDIX A: KRIGING
In this work, we chose to adopt the kriging spatial interpolation technique, initially used in geology (Krige 1951). Originally kriging was used to identify underground mineral deposits from the analysis of samplings obtained through randomly placed drillings on the surface. The power of this fitting technique, which justifies its use in astronomy, is that it assumes a physical relation between the values of a variable (e.g. metallicity) and the different positions in the explored field.
A1 The semivariogram
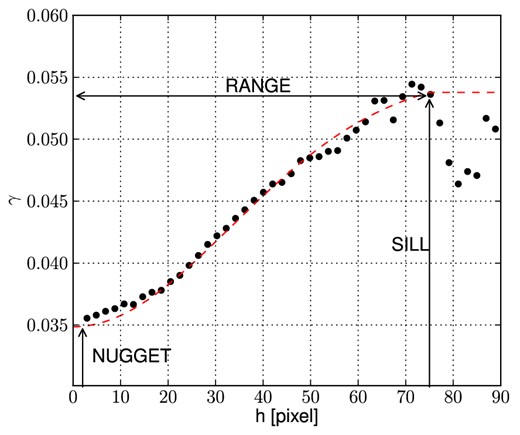
Semivariogram fitting example. The black points represent the mean value of the spatial autocorrelation γ between pairs of points separated by a distance h. The red dashed line is the Gaussian function adopted to fit the distribution of points within the range parameter, which is shown by the black horizontal arrow. The left vertical line shows the nugget parameter, while the right vertical line shows the sill parameter (see the text). Pairs of points separated by a distance h > range are excluded from the fit.
A2 Testing kriging
A key assumption of kriging is that the correlation between the values of two sampled points depends only on their relative distance, and not on their locations in the field. In most astronomical applications of the kriging technique, the spatial distribution of the measured values is not homogeneous (e.g. metallicity has usually a peaked 2D distribution) and it depends on variables other than distance (e.g. stellar population, galaxy inclination, etc.). We thus chose to test the quality of a 2D field kriging reconstruction without this assumption from simulated observations, in order to quantify the reliability of the maps we will obtain from real metallicity data.
We created a total of 9 two-dimensional (100 × 100 pixels) metallicity distributions assuming different radial profiles, axial ratios and centre positions. The adopted metallicity radial profiles are either analytic (i.e. linear or exponential) or derived from galaxy evolution simulations (i.e. Hopkins et al. 2009) and scaled arbitrarily. We also span a range of axial ratios and different positions in the field in order to simulate different galaxy inclinations and spot misleading artefacts. The three cases we tested are a single galaxy, two galaxies with different central metallicity profiles and a single galaxy with a ring-shaped bump in the 2D metallicity profile.
To simulate the metallicity error for each position in the grid, we assumed a distribution inversely proportional to the light flux, which follows a de Vaucouleurs (1948) radial profile. We scaled this error distribution in order to have the minimum equal to δ[Z/H] = 0.05 dex where the light flux peaks and the maximum δ[Z/H] = 0.50 dex in the minimum flux pixel (the values are taken from an approximation of the actual metallicity errors we retrieve for NGC 5846). With these assumptions, we have a reasonable, if simplistic, error distribution that we can use to weigh the data points in kriging.
After the construction of the mock 2D metallicity and metallicity error distributions, we extracted from them n randomly positioned samplings. Applying kriging on these points, we obtained the interpolated map, which we then subtracted from the original distribution to evaluate the residuals. These residuals are then compared with the associated uncertainties, calculated as the sum in quadrature of the assigned metallicity uncertainties and the kriging estimated uncertainties (Fig. A2).
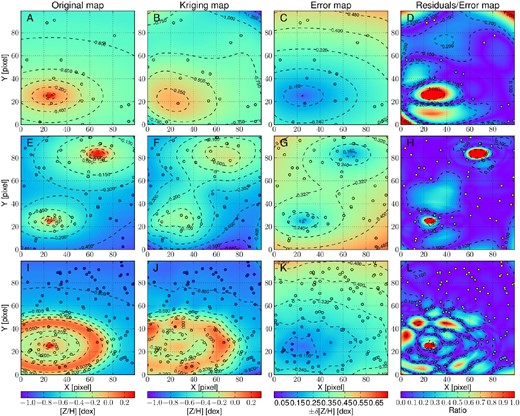
Kriging test examples. The three rows of panels are three different simulations. The top row is an off-centre galaxy sampled with a low number of slits (n = 20), the middle row shows the double galaxy case and an average number of slits (n = 50) while the bottom row is a galaxy with a ring shaped substructure and a high number of sampling slits (n = 100). From left to right, the different columns show, respectively, the original mock metallicity field, the kriging fitted map, the error map and the map of the ratio between residuals and uncertainties. The metallicity uncertainties on each pixel are measured summing in quadrature the assigned intrinsic uncertainty and the kriging interpolation estimated uncertainty. The points show the position of the samplings, colour coded to show the metallicity in the first two columns, the metallicity associated uncertainty in the third and the ratio between residuals and uncertainties in the fourth column. The contours show regions with equal values.
At this point, we want to quantify the reliability of kriging in reconstructing the original distribution of the variable we are probing. In particular, we will analyse how well kriging is able to return the overall 2D distribution and with which limits it can reveal substructures in the field.
To address the first part of the question, we assume that the quality of the map as a whole depends on just the number of samplings, if uniformly distributed on the field. Considering a simple 2D distribution (i.e. single galaxy case), we created 100 sampling realizations for the three cases with, respectively, a high (n = 100), an average (n = 50) and a low (n = 20) number of points. For all the pixels in each realization, we calculated the absolute residual as the absolute value of the original map value subtraction from the kriging extrapolated one. We then divided this residual by the pixel associated total uncertainty, which is resulted from the sum in quadrature of the assigned intrinsic measurement error with the kriging interpolation estimated uncertainty. We found that in the high and average sampling cases, 68 per cent of the kriging pixels have an absolute difference respect to the original map ones, respectively, ≤52.7 per cent and ≤55.7 per cent of the associated metallicity error. Also in the low number case, the 68 per cent of the pixels are enclosed within a fraction of the associated error, even if with a higher percentage (≤0.75 per cent) respect to the other two cases (Fig. A3).
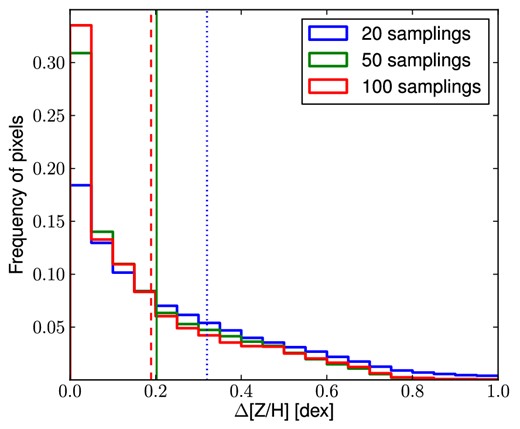
Frequency of residual over uncertainty ratio distributions with different samplings. For each pixel, the residual is obtained as the absolute difference between the original and the kriging map values. The associated metallicity uncertainty is obtained as the sum in quadrature of the uncertainty in the original metallicity with the kriging interpolation uncertainty, The horizontal axis shows ratio bins of width 0.05 while the vertical axis presents the relative frequency of the pixels with a given ratio. In the three different cases of low (n = 20, in blue), average (n = 50, in green) and high (n = 100, in red) number of sampling points, the values are added for 100 different statistical realizations of point selection to reduce the systematic uncertainties. The black dashed vertical line separates the pixels for which the residuals are less than the associated uncertainty from the ones in which kriging does not return a comparable value. The red dashed, green solid and blue dotted vertical lines show the limit within which 68 per cent of the pixels are enclosed, respectively in the high, average and low sampling cases (the values of which are presented in the legend). In all the different sampling cases, most of the kriging map points match with the original map ones within the uncertainty.
We also verified that the kriging maps we obtained are good enough to extrapolate trends in the field. With this purpose, we extract the values within a virtual long-slit centred on the mock galaxy (or on both the galaxies in the double galaxy case) in both the original and the kriging retrieved maps. We found that, even in the poorly sampled case, the overall trend is well reproduced and the mismatching areas are the ones near the peak of the 2D distribution (Fig. A4).
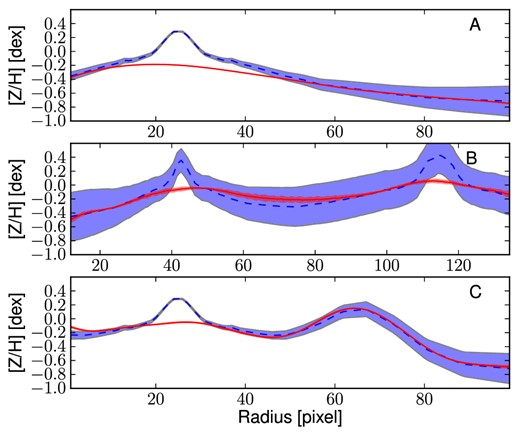
Examples of kriging-extracted virtual slit metallicity radial profiles. The blue dashed lines and the red solid lines show the metallicity profile extracted from a virtual slit in the original and in the kriging map, respectively. The three panels are the three different cases presented in Fig. A2. In particular, panel A presents the not-centred galaxy case, the panel B the double galaxy case and panel C the ring substructure case. The profiles in A and C are horizontal slits, while the profile for the case B is extracted from a slit tilted to include the two galaxy centres. On the x-axis, the distance of the pixels from the left edge of the grid is shown. The blue region shows the uncertainties associated with the original map points, while the red shadow presents the kriging interpolation estimated uncertainties. Excluding the regions where the original profile is steep (i.e. galaxy centres), the virtual and the real profiles match within the uncertainties.
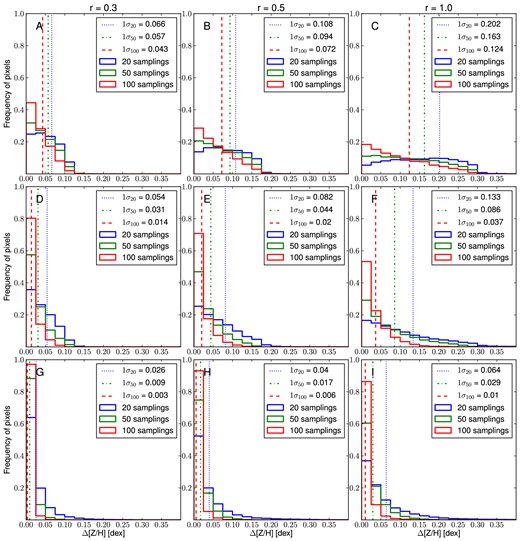
Kriging substructures test results. The histograms present the distribution of the pixels along with the absolute difference between the original substructure value and the retrieved kriging value, in bins of 0.025 dex. Each panel shows the co-addition of 100 different statistical realizations of the sampling set for the three different cases of 20, 50 and 100 sampling pixels, with, respectively, a blue, a green and a red histogram. The different panels are relative to the different combinations of the substructure parameters r and σ, linked with the central value and the size of the substructure (see the text). The red dashed, the green dash–dotted and the blue dotted lines show the ranges where the 68 per cent of the pixels are enclosed in the 20, 50 and 100 samplings cases, respectively. These values are also presented in the legend of each panel.
From these tests we can conclude that the kriging method is able to retrieve the overall 2D distribution of a variable with a high degree of accuracy even with a low number of samplings. However, in the case of substructures, one needs more samplings for increasingly steeper profiles.
APPENDIX B: INDIVIDUAL GALAXIES
B1 General remarks on the literature values
In this section, we will discuss the metallicity kriging maps we obtained and the available literature metallicity values and profiles for all the galaxies in our sample. In the literature, several different ways of reporting the metallicity of a stellar population exist. In order to have some comparison with the literature, we selected only the works which report either the total metallicity [Z/H] or both the measured iron abundance [Fe/H] and the α-elements abundance [α/Fe]. It is possible to retrieve the total metal abundance adopting the relation [Z/H] = [Fe/H]+0.94[α/Fe] (Thomas et al. 2003a). In the case of Conroy & van Dokkum (2012) values, we considered [Mg/Fe] ≈ [α/Fe]. Most of the literature give central values within Re/2, Re/8 or Re/16, but often the reference value for the effective radius is different. For this reason, we scaled the radii of these values with respect to our assumed effective radii. All the literature values are plotted in Fig. 12, together with our metallicity values. In the plots, the literature values referring to an average metallicity in the centre are placed at the distance from the centre which encloses half of the light in the averaged region, assuming a de Vaucouleurs profile. On the other hand, we found only a handful of available radial profiles for the galaxies in our sample. The SAURON radial profiles have been extracted from the SAURON metallicity maps (Kuntschner et al. 2010). In the case of the other metallicity radial profiles, we extracted them from the plots in the literature papers.
B2 NGC 720
The radial metallicity profile (Fig. 12) is flat in the range (−0.5 < log (R/Re) < −0.2), with some scatter at larger distances from the centre. We excluded this galaxy from following analyses of the metal distribution because of both the low number of measured metallicities (i.e. 20) and the inhomogeneous azimuthal coverage of the 2D field, which leads to an unreliable kriging map.
B3 NGC 821
This object is part of the SAURON sample. Proctor et al. (2005) measured the metallicity radial profile using Lick indices. The metallicity in the inner region of NGC 821 has been measured by several studies (Trager et al. 2000; Denicoló et al. 2005b; Howell 2005; Conroy & van Dokkum 2012), all consistent with a central value 0.1 < [Z/H]inner < 0.5dex. Our data points match quite well with both the SAURON and Proctor et al. (2005) radial profiles (Fig. 12). As for NGC 720, the low number of points (i.e. 17) and inhomogeneous azimuthal coverage of the field inhibit the extraction of a reliable kriging metallicity map. In any case, with just one data point outside 1Re we would not be able to extract the outer metallicity gradient necessary for the further steps of our analysis.
B4 NGC 1023
In this case, the measured metallicity points are consistent with the SAURON profile (Fig. 12). The available literature values for the inner metallicity are quite consistent with the results of SAURON (Sil'chenko 2006; Conroy & van Dokkum 2012). The slight increase of the SAURON profile for log (R/Re) > −0.4 also matches the behaviour of the values we measure in the inner south-west regions of the galaxy. However, the final kriging-extracted profile is substantially offset with respect to the SAURON outermost values. The extracted kriging map extends outside 3Re because of a single data point at ≈155 arcsec from the galaxy centre. Despite this, we still consider the map reliable because of the high number of measured data points and their homogeneous azimuthal coverage of the field.
B5 NGC 1400
For this galaxy, a number of central metallicity measurements are available in the literature (Howell 2005; Barr et al. 2007; Idiart, Silk & de Freitas Pacheco 2007; Spolaor et al. 2008b), all of which are consistent with a supersolar central metallicity. In addition, Spolaor et al. (2008b) also present the radial metallicity profile out to 1Re. Comparing the distribution of our points with this profile, we notice an offset of about 0.25 dex, with our values more metal rich. In this case, it is possible that we overcorrected the CaT-derived metallicities by overestimating the central velocity dispersion for this galaxy (see Section 3.4). The metallicity profiles extracted from the kriging map present higher values than those from Spolaor et al. (2008b). The kriging map for this galaxy shows a metallicity distribution peaked near the galaxy centre and has sufficient data points for azimuthal coverage. The offset between the peak of the 2D metallicity distribution and the photometric centre of NGC 1400 is probably caused by the asymmetric azimuthal distribution of the data points, which is denser in the south-east region of the field.
B6 NGC 1407
NGC 1407 is a very well studied galaxy at the centre of the Eridanus A group. Several studies agree with a supersolar central metallicity (Howell 2005; Annibali et al. 2007; Cenarro et al. 2007; Spolaor et al. 2008b). Spolaor et al. (2008b) also measured the metallicity profile out to about 0.6Re, which is consistent with our radially overlapping CaT-derived metallicities. A peculiar feature of this galaxy is a bump in the radial metallicity distribution we observe for the measured metallicities between 0.6 and 1Re. From the kriging map is not clear if this bump corresponds to circular shell around the galaxy centre or is just a feature of the south and east regions of the galaxy. Curiously, in the same region a spike in velocity dispersion and h4 has been noticed in the past (Proctor et al. 2009; Arnold et al. 2014). This higher metallicity region has been chemically probed before only by Foster et al. (2009) with a subsample of the data presented in this work. However, in such a study the low number of data points did not allow us to clearly notice the bump in metallicity. NGC 1407 will be studied in greater detail in a following paper.
B7 NGC 2768
A number of studies agree on a supersolar central metallicity (Howell 2005; Sil'chenko 2006; Idiart et al. 2007; Serra et al. 2008; Conroy & van Dokkum 2012) for this galaxy. Denicoló et al. (2005b) measured the average metallicities along both the major and the minor axes of the galaxy, with the latter presenting an higher value. Our measurements are consistent with the radial profile from the SAURON survey in the inner regions.
B8 NGC 2974
The central metallicities in the literature all agree on a central value slightly supersolar (Denicoló et al. 2005b; Annibali et al. 2007; Conroy & van Dokkum 2012) and are consistent with the SAURON profile for this galaxy. The average of our measured metallicities match with SAURON in the overlapping radial region. Unfortunately, both the low number of sampling points (i.e. 13) and the inhomogeneous azimuthal coverage of the field indicate an unreliable kriging map. However, the presence of just two data points outside 1Re would prevent a measure of the outer metallicity gradient anyway.
B9 NGC 3115
In the literature, there are three different measures for the central metallicity of NGC 3115, all consistent with a supersolar central value (Howell 2005; Sánchez-Blázquez et al. 2006; Idiart et al. 2007). Norris et al. (2006) measured the metallicity profiles along the major axis of this galaxy. The CaT-derived metallicities of our work are comparable, in the common explored region, with their major axis profile. However, from the kriging extracted metallicity map, it is possible to notice an increase of the stellar metallicity in the north-east region. In addition, we do not see any photometric substructure in correspondence to the higher metallicity region.
B10 NGC 3377
The inner metallicity of NGC 3377 has been measured by a number of studies, several of which in agreement with a solar (Trager et al. 2000; Sánchez-Blázquez et al. 2006; Idiart et al. 2007) or supersolar central metallicity (Howell 2005; Denicoló et al. 2005b; Conroy & van Dokkum 2012). The photometric study by Harris et al. (2007) measured the metallicity of the red giant stars of NGC 3377 up to more than 7Re. They found a metallicity distribution almost identical in their three fields, which are positioned at 1.65, 2.75 and 4.6 arcmin from the galaxy centre. All these metallicity distributions roughly extend from [Z/H] = 1.5 dex to [Z/H] = −0.3 dex and peak at [Z/H] = −0.6 dex. The SAURON radial profile extends to 1Re and is consistent with a slightly supersolar central metallicity and a gentle decline in the probed range. While our data match with those of SAURON in the common radial range, outside 1Re we observe a steep gradient. This steepness has been also confirmed by the kriging-extracted map.
B11 NGC 3607
For this galaxy, several different measures of the central metallicity have been done, all consistent with a slightly supersolar metallicity (Proctor & Sansom 2002; Howell 2005; Sánchez-Blázquez et al. 2006; Sil'chenko 2006; Annibali et al. 2007; Idiart et al. 2007), except the study by Denicoló et al. (2005b) in which the metallicity is considerably higher. Our measured points are enclosed within about 0.4 and 1.6Re, and thus, we are not able to probe the metallicity in the innermost regions of the galaxy. However, we find from the kriging map a decreasing metallicity to our outermost point. The offset between the metallicity peak in the kriging map and the galaxy photometric centre is probably caused by the inhomogeneous azimuthal data point distribution within 1Re, with a higher density of points on the south-west region of the probed field.
B12 NGC 4111
This object has the smallest angular size in our sample (Re = 12.0 arcsec). For NGC 4111 only, the recent study of Sil'chenko (2006) has probed the chemical enrichment in the inner regions, finding a value comparable with a solar metallicity. Despite our measurements present quite an important radial scatter, the kriging extrapolation shows a centrally peaked metallicity map. The presence of the two low-metallicity points along the minor axis could be the cause of the kriging map's elongated shape. This affects the radial profile in the outer regions, causing the presence of a metallicity bump between 35 and 55 arcsec. This feature is due to the adoption of the isophotal b/a to measure the circular-equivalent distance of each map pixel from the centre. It is, however, remarkable that the metallicity isocurves are oriented similarly to the isophotes (see Fig. 13).
B13 NGC 4278
NGC 4278 is an almost spherical elliptical galaxy. According to the Conroy & van Dokkum (2012) central measurements and SAURON radial profile, the central metallicity for this galaxy is about solar. However, Serra et al. (2008) measure a much higher central metallicity. Our CaT-derived metallicities match with SAURON radial profile in the overlapping radial region, giving a high scatter in the outer profile.
The kriging extracted map shows a very flat 2D metallicity distribution.
B14 NGC 4365
This peculiar galaxy hosts a kinematically decoupled core (Davies et al. 2001). Several studies agree on a supersolar central metallicity for NGC 4365 (Proctor & Sansom 2002; Denicoló et al. 2005b; Howell 2005; Sánchez-Blázquez et al. 2006; Idiart et al. 2007). In general, our metallicity points in the outskirts show a scattered distribution about these central values and the kriging extracted map presents a flat spatial metallicity distribution. Because of the outermost higher metallicity point, the extracted radial profile at R > 1Re has a slightly positive gradient.
B15 NGC 4374
The metallicity in the central regions of this galaxy has been measured by a number of studies, which found a value consistent with a solar (Trager et al. 2000; Sánchez-Blázquez et al. 2006; Annibali et al. 2007; Gallagher et al. 2008) or supersolar (Proctor & Sansom 2002; Howell 2005; Denicoló et al. 2005b; Idiart et al. 2007) metallicity. Our points present good agreement with respect to the SAURON profile. This may be a consequence of an overestimated central velocity dispersion, which leads to an overcorrection in metallicity. The kriging map for this galaxy is quite peculiar, showing patches of high and low metallicities in the 2D field. Because of the relatively high number (35) and the good azimuthal coverage of the sampling points, these apparent substructures may be real.
B16 NGC 4473
NGC 4473 presents a kinematic transition from a disc-like rotation in the centre to a triaxial ‘kinematically distinct halo’ (KDC) outside 1.8Re (Foster et al. 2013).
For this galaxy, a weakly (Idiart et al. 2007; Conroy & van Dokkum 2012) and strongly (Howell 2005) supersolar central metallicities have been measured. Our CaT-derived metallicities are compatible with the SAURON profile in the common radial range. The global 2D metallicity field is quite flat, showing a slightly higher stellar metallicity along the major axis.
B17 NGC 4494
In the literature, we found for this galaxy only the central metallicity measurements by Denicoló et al. (2005b), which shows a supersolar value. With a subset of our data points, Foster et al. (2009) measured a CaT index flat profile up to 1.4Re. In addition, (Foster et al. 2011) found no evidence of CaT index azimuthal variation in a similar radial range. The metallicities we derived for this galaxy extend up to 1.5Re. The metallicity profile we extract from the kriging map is consistent with being flat within 1Re and strongly steep outside this limit. On the other hand, the map itself shows a higher and a lower metallicity patch, respectively, in the north and south-east regions of our field. While we do not have reasons to exclude the possibility of the first substructure being real, the second seems driven by just two data points.
B18 NGC 4526
For NGC 4526, a supersolar central metallicity has been confirmed by Proctor & Sansom (2002), Sil'chenko (2006) and Gallagher et al. (2008). The metallicities we measured in the outskirts closely match the SAURON radial profile in the overlapping region. The kriging metallicity map for this galaxy is centrally peaked and shows an elongation almost aligned with the isophotal major axis.
B19 NGC 4649
For this massive galaxy, Gallagher et al. (2008) found a central metallicity slightly below the solar value, while both the studies by Trager et al. (2000) and Howell (2005) are above it. Our point distribution is on average consistent with a supersolar metallicity also in the outskirts. The kriging map presents a centrally peaked 2D metallicity distribution, with metallicity isocurves following the galaxy isophotes.
B20 NGC 4697
For NGC 4697, many studies agree on a supersolar central metallicity and a decreasing profile with radius (Trager et al. 2000; Proctor & Sansom 2002; Howell 2005; Sánchez-Blázquez et al. 2006; Annibali et al. 2007; Idiart et al. 2007). The 2D metallicity map is consistent with a centrally peaked metallicity and the isocurves of metallicity resemble both the PA and the ellipticity of the isophotes.
B21 NGC 5846
Over the years, many studies have measured NGC 5846's central metallicity, finding a range of values from weakly undersolar to strongly supersolar (Trager et al. 2000; Denicoló et al. 2005b; Howell 2005; Sánchez-Blázquez et al. 2006; Annibali et al. 2007; Idiart et al. 2007; Gallagher et al. 2008; Conroy & van Dokkum 2012). The CaT-derived metallicities we measured are consistent with the SAURON profile in the overlapping region. NGC 5846 has a small companion (NGC 5846A) which we identified in both the SDSS image and the CaT index kriging map (Fig. 5). In order to retrieve the metallicity map for just the main galaxy, we excluded the slits within 15 arcsec from the centre of NGC 5846A. The kriging metallicity map we then retrieve shows a centrally peaked metallicity distribution. However, there are only two points outside 1Re. As a consequence, we do not measure the metallicity gradient in the outer region of this galaxy.
B22 NGC 5866
For NGC 5866 we retrieved in the literature only the weakly supersolar central metallicity value measured by Sil'chenko (2006). Unfortunately, the poor azimuthal coverage of our metallicity measurements does not allow us to extract a reliable kriging map for the metallicity of this galaxy.
B23 NGC 7457
The NGC 7457 central metallicity measurements by Sil'chenko (2006) and Serra et al. (2008) agree on a subsolar metal abundance. In contrast, the SAURON profile has a weak supersolar central value and a gentle decline with radius. The metallicity values we measure are mostly consistent with the SAURON radial profile in our innermost probed regions. In the outer regions, however, what we measure is more consistent with a metal-poor stellar population, while SAURON profile seems still quite flat. This difference is enhanced in the kriging extracted metallicity profile, which presents a steep outer gradient. The kriging map shows a centrally peaked metallicity 2D distribution, with both the orientation and the shape of the metallicity isocurves roughly resembling the galaxy isophotes.


