


Abstract
We present radial velocities (from Gemini/GMOS) of the second sample of ultracompact dwarfs (UCDs) and bright globular clusters (GCs) in the Antlia cluster. 23 objects are located around the giant elliptical NGC 3268, and one is close to the fainter lenticular NGC 3273. Together with previously found UCDs around NGC 3258, a total of 35 UCDs and bright GCs has been now identified in the Antlia cluster. Their colours and magnitudes are compared with those of the nuclei of dE,N galaxies already confirmed as Antlia members. For a subsample that lie on ACS (Advanced Camera for Surveys) images and are brighter than MV = −9 mag, the effective radii (Reff) have been measured, the maximum radius being approximately 10 pc. In addition to the radial velocity sample, we find 10 objects in the magnitude range corresponding to GCs but with 10 < Reff < 17 pc, resembling the so-called extended clusters. By number and magnitude, the new UCDs fit to the GC luminosity function, supporting their interpretation as bright GCs. Additionally, we use a tracer mass estimator to calculate the mass enclosed up to ≈47 kpc from NGC 3268, which results in 2.7 × 10¹² M⊙.
1 INTRODUCTION
The discovery of objects in the Fornax cluster, which were much brighter than ‘normal’ globular clusters (GCs), but much smaller than dwarf ellipticals (Minniti et al. 1998; Hilker, Infante & Richtler 1999; Drinkwater et al. 2000) made a strong impression on the star-cluster community.
The designation ultracompact dwarf (UCD) has been introduced by Drinkwater et al. (2002) to emphasize the new nature of these bright and, at least in comparison to dwarf galaxies, compact objects (see Hilker 2009a for a review). When Haşegan et al. (2005) found strikingly high M/L-values for UCDs in the Virgo cluster, the possibility of a dark matter component, which would mean a galaxy nature, was seriously considered. However, further studies found lower M/L-values consistent with stellar populations, e.g. Frank et al. (2011). In addition, Willman & Strader (2012) state that similar results have been obtained by several dynamical analyses of UCDs. In spite of that we continue to use the term ‘UCD’ even if these objects are bright star clusters rather than faint galaxies and even, if there is no clean definition.
Apparently, cluster-like environments (Gregg et al. 2009; Brodie et al. 2011; Chiboucas et al. 2011; Misgeld et al. 2011; Penny, Forbes & Conselice 2012; Caso et al. 2013) are not needed to produce UCDs, since they have been found also around individual galaxies (Rejkuba et al. 2007; Hau et al. 2009; Madrid & Donzelli 2013). For example, the number of clusters brighter than ω Cen in NGC 4636 is about 70 (Schuberth et al. 2012).
There is no generally accepted definition for UCDs and different authors assign different luminosity ranges. For example, Hilker (2009a) suggested a V absolute magnitude range of −13.5 < MV < −11, while Brodie et al. (2011) extended it towards a fainter limit (MV < −9). More recently, Mieske, Hilker & Misgeld (2012) proposed that UCDs were systems with MV < −10.25. Brüns & Kroupa (2012) discriminated as UCDs those objects with effective radii (Reff) larger than 10 pc and luminosities in the dwarf galaxies’ regime, while fainter objects with similar radii were called ‘extended clusters (ECs)’. The simulations of Pfeffer & Baumgardt (2013) showed that the remnants of stripped nucleated dwarf elliptical galaxies (dE,N) could present effective radii (Reff) of only a few parsecs. In this sense, ω Cen has been considered as a possible remnant of a Milky Way satellite galaxy (e.g. Hilker & Richtler 2000; Bekki & Freeman 2003; Böker 2008), and its Reff is ≈7.5 pc (Harris 1996, 2010 Edition). This scenario is supported by the evidence of multiple stellar populations formed along several Gyr (e.g. Lee et al. 1999; Bedin et al. 2004; Hilker et al. 2004; Marino et al. 2011), and the presence of Galactic tidal streams that can be associated with ω Cen (Majewski et al. 2012). Moreover, Olszewski et al. (2009) found that NGC 1851, a faint Galactic GC with Reff ≈ 2 pc, is surrounded by a diffuse stellar halo. This has been pointed out as evidence that the origin of NGC 1851 may have been the disruption of a dwarf galaxy (Bekki & Yong 2012). Consequently, we may lose UCD candidates if we use Reff as a criterion. We will select as UCDs those systems with similar colours than GCs, and MV < −10.5.
The origin of UCDs is not clear either. A substantial fraction probably constitute the bright end of the GC population of their host galaxy (e.g. Norris & Kannappan 2011; Mieske et al. 2012), but there may be various formation channels (e.g. Hilker 2009a, b; Chilingarian et al. 2011; Brüns & Kroupa 2012). Tidal stripping of nucleated galaxies has been proposed as a possible origin for some UCDs based on observational studies (e.g. Strader et al. 2013), but also from numerical simulations (Bassino, Muzzio & Rabolli 1994; Bekki, Couch & Drinkwater 2001; Bekki et al. 2003; Pfeffer & Baumgardt 2013).
Although most UCDs show M/L-values consistent with stellar populations, the discussion about higher dynamical M/L-values, particularly of the brighter objects, is still ongoing (Mieske et al. 2008; Taylor et al. 2010; Strader et al. 2013). Rather than dark matter haloes, top-heavy initial mass functions (IMF; Dabringhausen, Kroupa & Baumgardt 2009; Murray 2009; Dabringhausen et al. 2012), or central black holes (Mieske et al. 2013) have been suggested as responsible for those high M/L-values.
1.1 The Antlia cluster
The present work has been performed within the context of the Antlia Cluster Project that aims at studying the galaxy content of this cluster, i.e. the GCs associated with the two dominant elliptical galaxies (Dirsch, Richtler & Bassino 2003b; Bassino, Richtler & Dirsch 2008), the complete galaxy population (Smith Castelli et al. 2008a,b,2012; Calderón et al., in preparation; Bassino et al., in preparation), and the UCDs (Caso et al. 2013, hereafter Paper I).
The Antlia galaxy cluster is the third nearest well-populated galaxy cluster. It consists mainly of two groups, each one dominated by a giant elliptical (gE) galaxy (NGC 3258 and NGC 3268). Considered as an example of a galaxy cluster in an intermediate merger stage (Hawley, Machacek & Kraft 2011), the Antlia cluster is a very interesting target for studying the UCD population. In Paper I, we analysed a sample of confirmed UCDs and marginally resolved candidates around NGC 3258, and we obtained the photometric properties for a sample of Antlia dE,N galaxies. It was shown that dE,N nuclei and UCDs occupy the same locus in the V, I colour–magnitude diagram (CMD). The projected spatial distribution of UCDs proved to be similar to those of NGC 3258 GCs. In addition, effective radii of UCDs were measured with ACS (Advanced Camera for Surveys) imaging available from the Hubble Space Telescope (HST) archive, giving support to the existence of a size–luminosity relation.
The structure of this paper is the following. Section 2 describes the observations, reductions, and the adopted criteria for the selection of GCs and UCDs. In Section 3, we present the results regarding their colour–magnitude relation, size, size–luminosity relation, and also compare magnitudes and colours of the GCs and UCDs with those obtained for a sample of Antlia dE,N nuclei, and GCs. The discussion of the results and their set in the literature context is developed in Section 4. Finally, a summary and the conclusions are provided in Section 5.
2 OBSERVATIONS AND REDUCTIONS
2.1 Photometric data and selection of point-sources
The photometric data set used in this paper consists of FORS1–VLT images from two fields in the V and I bands (programme 71.B-0122(A), PI B. Dirsch). One of them is centred on NGC 3268, and the other is a comparison field, located ≈22 arcmin to the north-west direction. We also used wide-field (36 arcmin × 36 arcmin) images that were taken with the MOSAIC camera mounted at the CTIO 4-m Blanco telescope during 2002 April 4/5. These images correspond to a single field from the central region of the Antllia cluster, including NGC 3268, obtained in the Kron–Cousins R and Washington C filters. For both data sets, the procedure applied was similar. First, the software SExtractor (Bertin & Arnouts 1996) was run on the images, once the extended galaxy light had been subtracted, to generate an initial catalogue of point-sources. Then the photometry was performed with daophot within iraf in the usual manner. The aperture photometry was carried out using the task PHOT. Afterwards, the definitive photometry was obtained with the task ALLSTAR, using a spatially variable point spread function (PSF). The final point-source selection was based on the χ and sharpness parameters calculated by this task.
We estimated the photometry completeness for two FORS1–VLT fields, one of them containing NGC 3268, and the other one located to the north-west, at approximately 15 arcmin from the gE galaxy. This latter field is going to be used as background region in the rest of the paper. The procedure applied was the following. First, we added to each V and I image 1000 artificial stars with colours and magnitudes in the expected ranges for GCs. We repeated this process 10 times, in order to generate a sample of 10 000 artificial stars, equally distributed over the entire field. Then, we carried out the photometry of these images in the same way as the original ones. The completeness functions for the two fields are very similar. The 90 per cent completeness was achieved at V ≈ 24.5, and the 60 per cent at V ≈ 25.75.
In addition, two ACS fields (centred on each of the two Antlia dominant galaxies) observed with the F814 filter were obtained with the HST (programme 9427; PI: W. E. Harris). Each image is the combination of four 570 s exposures. Following a similar procedure to that applied in Paper I to the ACS image centred on NGC 3258, we obtained the PSF of the other image centred on NGC 3268, which was needed to measure Reff. With this purpose, we applied SExtractor on the galaxy-light-subtracted image and obtained a point-source catalogue. Finally, the iraf/daophot tasks PHOT and PSF were applied to obtain the aperture photometry and PSF of the image, respectively.
We refer to Paper I and references therein for details on the reduction and photometry of the three data sets (FORS1, MOSAIC, and ACS).
From the objects that fulfil the point-source selection criteria applied to the FORS1 and MOSAIC data, we kept those with −13.5 < MV < −10.5 (see Paper I and references therein) and colours in the usual range for GCs (Dirsch et al. 2003b; Bassino et al. 2008). Adopting for Antlia a distance modulus of (m − M) = 32.73 (Dirsch et al. 2003b), i.e. approximately 35 Mpc, this magnitude range corresponds to 19.2 < V < 22.2. In the following, we will refer to the sources in this preliminary selection as UCD candidates.
2.2 Spectroscopic data
We have also obtained GEMINI-GMOS multi-object spectra for objects located in six Antlia fields (GS-2009A-Q-25, PI L. P. Bassino; GS-2010A-Q-21, PI L. P. Bassino; GS-2011A-Q-35, PI A. V. Smith Castelli; and GS-2013A-Q-37, PI J. P. Calderón). The masks designed for these programmes had slits not only on UCDs but also on other targets from GCs to galaxies. The grating B600_G5303 blazed at 5000 Å was used, applying small shifts in the central wavelengths to fill the CCD gaps. The slit width was 1 arcsec. The wavelength coverage for this configuration spans 3300-7200 Å (depending on the positions of the slits) and the resultant spectral resolution is ∼ 4.6 Å. The total exposure times ranged between 2 and 3.5 h. As part of the programme, we also obtained individual calibration flats and CuAr arc spectra for each exposure to correct for small variations that may be introduced by telescope flexion. Data reduction was performed using the gemini.gmos package within iraf in the usual manner, following the same procedure explained in Paper I. For the faintest objects, it was not possible to trace the individual exposures. In these cases, the exposures were combined to achieve a higher S/N. The trace of these objects were obtained from these combined images, and then used to extract the spectra from the individual exposures.
We measured the heliocentric radial velocities for the UCD and GC candidates in the GMOS fields using the iraf task FXCOR within the noao.rv package. We used synthetic templates, selected from the single stellar population (SSP) model spectra at the MILES library (http://www.iac.es/proyecto/miles; Sánchez-Blázquez et al. 2006). For this purpose, SSP models with metallicity [M/H]= −0.71, a unimodal IMF with slope 1.30, and ages of 8 and 10 Gyr were considered. The wavelength coverage of these templates is 4200–7300 Å, and their spectral resolution is 2.3 Å full width at half-maximum (FWHM). As in Paper I, the 10 Gyr template provided slightly better correlations.
2.3 Selected sample of GCs and UCDs
According to our previous studies of the galaxy populations of the Antlia cluster, cluster members have radial velocities in the range 1200–4200 km s−1 (Smith Castelli et al. 2008a, 2012). Such a velocity range points to a complex structure, probably due to a mixture of Hubble flow and internal cluster velocities. Assuming the same criterion, we confirm as Antlia members 24 new objects (23 of them in the vicinity of NGC 3268, and the remaining one close to NGC 3273), listed in Table 1. As the sample of newly confirmed objects include both, GCs and UCDs (i.e. objects fainter and brighter than MV = −10.5, respectively), we will follow the notation adopted in Paper I, using the acronym ‘ACO’ for Antlia Compact Object.
Their J2000 coordinates, extinction-corrected V, I (when available) and Washington C, T1 photometry, as well as heliocentric radial velocities are listed in this table. Hereafter, extinction corrections are applied to magnitudes and colours. We refer to Bassino et al. (2008) and Dirsch et al. (2003b) for explanations on how the extinction corrections applied to the V, I and Washington C, T1 data, respectively, have been calculated.
3 RESULTS
The mean radial velocity for our sample of 23 confirmed ACOs around NGC 3268, is 2720 ± 56 km s−1. NED1 lists for NGC 3268 a radial velocity of 2800 ± 21 km s−1. The agreement is acceptable, given the small object sample.
3.1 CMD of ACOs and dwarf elliptical nuclei
Only those ACOs located in the VLT fields have (V, I) photometry available. For the rest of them, we attempted to transform Washington photometry to the V Johnson and I Cousins system. To this aim, we calculated V − R for the GC-like sources in the vicinity of NGC 3268 that have photometry in both photometric systems, i.e. in common between MOSAIC and VLT samples. Removing outliers iteratively, we obtained a mean and dispersion of (V − T1)0 = 0.51 ± 0.01 and |$\sigma _{(V-R)_0} = 0.09$|. This value is in agreement with V − R = 0.5 used by Mieske et al. (2004) in Fornax (if we assume R − T1 = 0.02, from Dirsch et al. 2003b). We also search for a possible correlation between (V − I)0 and (C − T1)0 colours. We found that a straight line gives an acceptable fit, resulting (V − I)0 = 0.29 ± 0.01 × (C − T1)0 + 0.56 ± 0.02. This relation, together with (V − R)0 = 0.51, will be used hereafter to transform the Washington photometry of those objects lacking (V, I) data. However, there is a large scatter, particularly for the colours in the usual range of bona fide metal-poor GCs. Objects with 0.8 < (V − I)0 < 0.9 span 1.1 < (C − T1)0 < 1.8. For this reason, the transformed V, I colours should be considered with caution. We use them only for comparison with the literature.
The (V, I) CMD of the ACOs is shown in the left-hand panel of Fig. 1. The blue squares indicate the ACOs around NGC 3268 with available (V, I) photometry while the red squares identify those ACOs whose colours and magnitudes were obtained from the Washington photometry, as described above. ACO 35, the only object measured around NGC 3273, is shown with a brown triangle, and the ACOs associated with NGC 3258 listed in Paper I with black circles. Orange diamonds represent the nuclei of dE,N galaxies that are members of the Antlia cluster and were studied in Paper I. The right-hand panel of Fig. 1 shows the Washington CMD for the ACOs around NGC 3258 (red circles, Paper I), NGC 3268 (blue squares), and NGC 3273 (brown triangle). A sample of confirmed Fornax UCDs from Mieske et al. (2004) with available Washington photometry (Dirsch et al. 2003a; Bassino et al. 2006b) and similar luminosities is also indicated (orange diamonds). For comparison, the position of ω Cent (Harris 1996, 2010 Edition) is indicated in both CMDs.
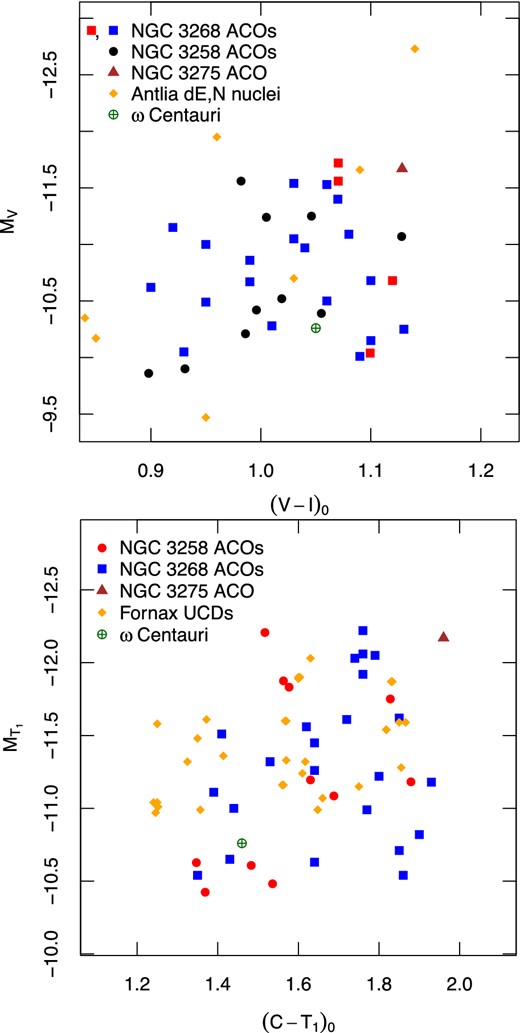
Left-hand panel: CMD of ACOs (confirmed objects) and ω Cen (Harris 1996, 2010 Edition) in the (V, I) photometric system. The blue squares indicate the objects around NGC 3268 with available (V, I) photometry while for the red ones their colours and magnitudes were obtained from the Washington photometry (see the text). Orange diamonds indicate the Antlia dE,N nuclei measured in Paper I. The brown triangle represents ACO 35, the only object confirmed around NGC 3273. Its colour and magnitude was also obtained from the Washington photometry. Black circles shows ACOs around NGC 3258 (Paper I) with available (V, I) photometry. Right-hand panel: CMD of ACOs in the Washington photometric system. The blue squares indicate the ACOs around NGC 3268 with (V, I) photometry available, while the red circles represent the ACOs around NGC 3258 (Paper I). Confirmed Fornax UCDs from Mieske, Hilker & Infante (2004) with available Washington photometry (Dirsch et al. 2003a; Bassino et al. 2006b) and similar luminosities are shown with orange diamonds. ω Cent (Harris 1996, 2010 Edition) is also shown.
None of the ACOs confirmed in this paper nor in the previous one present a luminosity as high as those of the brightest Virgo or Fornax UCDs (e.g. Gregg et al. 2009; Brodie et al. 2011). Blue ACOs around NGC 3258 and NGC 3268 seem to occupy the same locus in the CMD as the nuclei of Antlia dE,N, that follow a colour–luminosity correlation, getting redder when their luminosities increases (Paper I and references therein). Considering that our ACOs are mainly fainter that MV = −11.5, blue ones are more likely to have a common origin with dE,N nuclei than red ones.
Out of the 16 ACOs in the neighbourhood of NGC 3268 brighter than MV = −10.5, 7 are redder than V − I = 1.05, a usual limit between metal-poor (‘blue’) and metal-rich (‘red’) GCs (e.g. Bassino et al. 2008). In comparison with NGC 3258 ACOs, this represents a higher fraction of red ACOs.
The picture is quite different if we analyse the Washington colours. Just four ACOs brighter than MT1 = −11 are bluer than C − T1 = 1.55 a value commonly used as the limit between metal-poor and metal-rich GCs in this photometric system (e.g. Dirsch et al. 2003a, b; Dirsch, Schuberth & Richtler 2005; Bassino, Richtler & Dirsch 2006a; Bassino et al. 2006b), and all of them are redder than C − T1 = 1.4. Fornax UCDs also present a large fraction of UCDs with red colours, but the sample spreads over a larger colour range, with some bright objects presenting blue colours.
3.2 Effective radii of ACOs
The high resolution of the HST data allows us to measure effective radii (Reff) of GCs or UCDs (Mieske et al. 2007, 2008; Evstigneeva et al. 2008; Madrid et al. 2010; Paper I) at distances as large as that of the Antlia cluster. At the adopted Antlia distance, the ACS pixel size of 0.055 arcsec corresponds to ∼9.3 pc. Sizes of a similar order have been obtained for a large fraction of UCDs (Mieske et al. 2008; Brodie et al. 2011; Misgeld et al. 2011).
ishape (Larsen 1999) was used to fit the light profiles of ACOs located in the NGC 3268 ACS field and obtain their Reff. We chose a King profile (King 1962, 1966) with concentration parameter c = 30 (defining c as the ratio of the tidal over the core radius). King30-profiles have been used in Paper I as well as in previous work (e.g. Harris 2009; Madrid et al. 2010; Brodie et al. 2011). We refer to Paper I for more details on how ishape was run.
12 ACOs spectroscopically confirmed in this paper are located within the NGC 3268 ACS field. In all the cases, we measured 2.8 < Reff[pc] < 8.5. For testing the reliability of the fit, we applied ishape to seven foreground stars confirmed with radial velocities, and obtained typically FWHM-values of ∼ 0.01-0.03 pixels, that is approximately one tenth of the smallest FWHM obtained for the confirmed ACOs. We also measured Reff for objects classified as point-like sources from the MOSAIC and FORS1 photometry, that were located in the two ACS fields, and present colours in the same range as GCs and MV < −9, i.e. we added fainter GC candidates to our sample. This magnitude limit was adopted so as to reach S/N > 70. Larsen (1999) recommends an S/N > 50 for obtaining accurate shape parameters with ishape.
As explained in Paper I, the FWHM of the ACOs analysed with ishape is less than one pixel, so possible eccentricities will not be considered, but the ellipticities of UCDs or GCs are anyway not large (e.g. Harris 2009 and references therein; Chiboucas et al. 2011).
Fig. 2 shows log(Reff) versus T1, for all confirmed ACOs in the NGC 3258 and NGC 3268 ACS fields. ACOs identified in Paper I are indicated with squares, while circles are used for the new ACOs presented in this paper. The Reff for the ACOs around both Antlia gEs are similar, presenting an upper limit of approximately 10 pc. Diamonds represent Fornax UCDs from Mieske et al. (2008) with available Washington photometry (Dirsch et al. 2003a; Bassino et al. 2006b) and similar luminosity, converted to Antlia distance. Considering the Antlia samples together, a Reff-MT1 trend could exist.
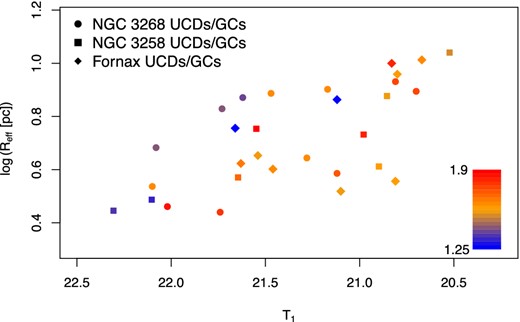
log(Reff) versus T1 for Antlia GCs (T1 > 21.6) and UCDs (T1 < 21.6) located close to NGC 3268 in the ACS field (circles), and the ACOs from Paper I whose Reff was measured (squares), plus Fornax UCDs from Mieske et al. (2008) with available Washington photometry (Dirsch et al. 2003a; Bassino et al. 2006b) and similar luminosity (diamonds), converted to the Antlia distance. The colour palette represents the Washington colour for the objects, spanning 1.25 < (C − T1)0 < 1.9.
The top panel of Fig. 3 shows the Reff versus MV for UCDs and GCs candidates brighter than MV = −9 around NGC 3268, with colours in the same range as GCs. As explained above, the value (V − I)0 = 1.05 is adopted to separate between metal-poor and metal-rich GC candidates, which are indicated with blue triangles and red inverted triangles, respectively. Spectroscopically confirmed ACOs are shown with green filled squares.
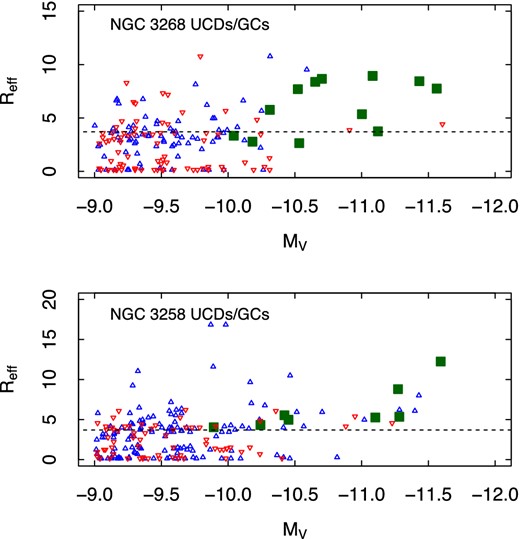
Top panel: Reff versus MV for the GC and UCD candidates around NGC 3268, discriminated between those objects bluer and redder than (V − I)0 = 1.05 (blue triangles and red inverted triangles, respectively). Confirmed ACOs in the vicinity of this galaxy are indicated as green filled symbols. Bottom panel: analogue for the candidates around NGC 3258. The dashed line in both panels is the mean Reff for a sample of Galactic GCs (Harris 1996, 2010 Edition).
The dashed line represents the mean Reff for a sample of 84 Galactic GCs with −10 < MV < −7 (Harris 1996, 2010 Edition), which results in 3.7 ± 0.3 pc. For our sample, we calculate the mean Reff for the blue and red candidates fainter than MV ≈ −10.5. Both subsamples are restricted to objects with 1 < Reff [pc] < 10. This lower limit was chosen because at the Antlia distance, smaller Reff are very uncertain due to the ishape fitting limitations (Harris 2009). The upper limit leaves the ECs out of the sample, as these objects present masses and luminosities comparable with GCs, but effective radii larger than 10 pc (Brüns & Kroupa 2012).
The resulting Reff averages for blue and red GC candidates are 3.4 ± 0.15 and 3.3 ± 0.1 pc, respectively. The bottom panel is analogous, but for the candidates around NGC 3258, and their mean Reff-values are 3.4 ± 0.15 and 3.1 ± 0.2 pc, respectively. In both cases, the differences in the mean Reff for blue and red GCs are within the uncertainties. This results is in agreement with Nantais et al. (2011) who found that M 81 blue and red GC candidates present nearly identical half-light radius, despite that a difference between blue and red GCs has been found in other systems (e.g. Larsen, Forbes & Brodie 2001). They mean Reff for blue and red GCs in our samples are in agreement, within the errors, with the mean value obtained for the Galactic GCs.
We adopted the same limit as the one proposed in Paper I, i.e. MV = −10.5, to discriminate between ‘regular’ GCs and brighter objects. As a consequence, the small open triangles with MV < −10.5 in that figure will be considered as UCD candidates.
Still in Fig. 3, we also find GC candidates fainter than MV = −10.5 around both gEs with Reff ≳ 10 pc, that appear separated from the bulk of GC candidates. Thus, following the literature definition (Madrid 2011; Brüns & Kroupa 2012, and references therein), we classified them as EC candidates. There are in total nine EC candidates, two of the around NGC 3268 and seven near NGC 3258. (V, I) is available for all the ECs, but Washington one is available for just eight of them. Six have colours resembling blue GCs in both photometric systems, and only one is a red GC considering (V, I) and Washington. The coordinates, magnitudes and colours, and Reff for the EC candidates are indicated in Table 2. The two largest EC candidates are located around NGC 3258, with Reff ≈ 17 pc. Both objects have (V − I)0 colours in the range of blue GCs, MV ≈ −10 and are located at ∼30 arcsec from NGC 3258 centre.
Basic properties of the newly confirmed Antlia Compact Objects. They are labelled with the acronym ‘ACO’ plus an order number, following the notation used in Paper I.
| ID | RA(J2000) | Dec.(J2000) | V0 | (V − I)0 | (T1)0 | (C − T1)0 | RVhel |
|---|---|---|---|---|---|---|---|
| (hh mm ss) | (dd mm ss) | (mag) | (mag) | (mag) | (mag) | (km s−1) | |
| ACO 12 | 10 29 49.344 | −35 17 40.128 | 21.19 | 1.03 | 20.68 | 1.79 | 2279 ± 45 |
| ACO 13 | 10 29 52.584 | −35 19 20.532 | 22.68 | 0.93 | 22.19 | 1.35 | 2668 ± 44 |
| ACO 14 | 10 29 54.42 | −35 17 47.472 | 22.48 | 1.13 | 21.91 | 1.90 | 2304 ± 37 |
| ACO 15 | 10 29 54.888 | −35 18 45.036 | 22.23 | 1.06 | 21.74 | 1.77 | 2470 ± 24 |
| ACO 16 | 10 29 57.228 | −35 19 28.416 | 21.33 | 1.07 | 20.81 | 1.60 | 2437 ± 45 |
| ACO 17 | 10 29 58.704 | −35 21 4.86 | 21.73 | 0.95 | 21.22 | 1.41 | 2860 ± 18 |
| ACO 18 | 10 29 58.92 | −35 24 8.028 | – | – | 20.67 | 1.76 | 2747 ± 20 |
| ACO 19 | 10 29 59.316 | −35 18 51.984 | 22.45 | 1.01 | 22.08 | 1.43 | 2865 ± 32 |
| ACO 20 | 10 30 0.828 | −35 20 20.076 | 21.87 | 0.99 | 21.41 | 1.53 | 3013 ± 30 |
| ACO 21 | 10 30 1.764 | −35 20 15.936 | 21.20 | 1.06 | 20.70 | 1.74 | 2628 ± 16a |
| ACO 22 | 10 30 1.836 | −35 21 21.6 | 22.58 | 1.10 | 22.02 | 1.85 | 2734 ± 31 |
| ACO 23 | 10 30 1.908 | −35 20 59.352 | 22.06 | 0.99 | 21.47 | 1.64 | 2277 ± 36 |
| ACO 24 | 10 30 2.988 | −35 19 10.02 | 21.76 | 1.04 | 21.28 | 1.64 | 2930 ± 29 |
| ACO 25 | 10 30 3.132 | −35 20 11.184 | 21.64 | 1.08 | 21.12 | 1.56 | 2796 ± 32a |
| ACO 26 | 10 30 4.212 | −35 16 18.048 | – | – | 21.55 | 1.93 | 2629 ± 38 |
| ACO 27 | 10 30 4.356 | −35 20 27.564 | 22.24 | 0.95 | 21.73 | 1.44 | 2712 ± 19 |
| ACO 28 | 10 30 4.68 | −35 20 2.868 | 22.72 | 1.09 | 22.10 | 1.64 | 2972 ± 76 |
| ACO 29 | 10 30 5.436 | −35 21 15.624 | 22.11 | 0.90 | 21.62 | 1.39 | 2611 ± 40 |
| ACO 30 | 10 30 7.632 | −35 20 51.432 | 21.68 | 1.03 | 21.17 | 1.62 | 2776 ± 35 |
| ACO 31 | 10 30 7.884 | −35 16 48.144 | – | – | 22.19 | 1.86 | 2890 ± 34 |
| ACO 32 | 10 30 8.136 | −35 22 40.512 | 21.58 | 0.92 | 21.11 | 1.85 | 2125 ± 75 |
| ACO 33 | 10 30 9.828 | −35 17 57.768 | 22.05 | 1.10 | 21.51 | 1.80 | 3200 ± 22 |
| ACO 34 | 10 30 30.492 | −35 13 2.604 | – | – | 20.51 | 1.76 | 2544 ± 18 |
| ACO 35 | 10 30 30.511 | −35 36 45.828 | – | – | 20.56 | 1.96 | 2660 ± 43 |
aACOs were observed in two different programmes. The listed radial velocities are the weighted means of their individual measurements.
Basic properties of the EC candidates (defined as objects with MV ≳ − 10.5 and Reff ≳10 pc) around both gEs.
| RA(J2000) | Dec.(J2000) | V0 | (V − I)0 | (T1)0 | (C - T1)0 | Reff |
|---|---|---|---|---|---|---|
| (hh mm ss) | (dd mm ss) | (mag) | (mag) | (mag) | (mag) | (pc) |
| 10 30 10.22 | −35 19 42.66 | 22.42 | 0.93 | 21.94 | 1.33 | 10.74 |
| 10 29 58.87 | −35 19 02.54 | 22.94 | 1.11 | 22.26 | 1.88 | 10.60 |
| 10 28 55.40 | −35 36 23.43 | 22.86 | 0.93 | – | – | 16.80 |
| 10 28 55.94 | −35 36 31.71 | 22.84 | 0.89 | 22.10 | 1.47 | 11.56 |
| 10 28 52.49 | −35 35 56.54 | 23.4 | 0.92 | 23.13 | 1.80 | 9.22 |
| 10 28 47.24 | −35 35 37.27 | 23.4 | 0.91 | 22.88 | 1.49 | 11.01 |
| 10 28 49.06 | −35 35 26.44 | 22.56 | 0.97 | 21.94 | 1.42 | 9.63 |
| 10 28 51.94 | −35 34 58.02 | 22.27 | 0.98 | 21.62 | 1.50 | 10.46 |
| 10 28 56.64 | −35 36 08.81 | 22.75 | 0.97 | 22.10 | 1.52 | 16.79 |
3.3 Comparison with the blue tilt extrapolation
In this section, we first investigate whether the so-called blue tilt is present in the GCS of NGC 3268, as it is in NGC 3258, and then compare its extrapolation with the colours of ACOs and UCDs candidates. In some galaxies, a correlation that has been named ‘blue tilt’ is followed by the blue GCs in the CMD, in the sense that bright blue GCs get redder when we move towards brighter luminosities. It is understood as a mass–metallicity relation for this metal-poor subpopulation of old GCs. This effect had been noticed in the Antlia gEs (Harris et al. 2006). In Paper I, we calculated a slope of d(V − I)0/dV0 ≈ −0.03 for NGC 3258 GCS. Now, we take into account the blue GC candidates in the FORS1 field that contains NGC 3268 with 22.3 < V0 < 25.75 and 0.8(V − I)0 < 1.05. The background sample contains the point-sources that fulfil the same criteria than the blue GC candidates in a FORS1 field located towards the north-east from NGC 3268 (see fig. 1 in Bassino et al. 2008). In order to detect if a blue tilt is also present in the NGC 3268 GCS, we statistically subtracted the background contribution. For this purpose, we separated into cells the CMD of the GC candidates and the background samples. Then, we counted the number of objects found in each cell of the background sample, and subtracted randomly the same number of GC candidates in the corresponding cell. Afterwards, the GC candidates from the clean sample were split into five equally populated magnitude bins, spanning in the range 22.3 < V0 < 25. For each bin we calculated the mean, that are represented by filled diamonds in the CMD of NGC 3268 GCS (Fig. 4). The solid line was obtained by fitting the mean values, while the dashed lines indicate its extrapolation towards brighter and fainter magnitudes. We obtained a slope d(V − I)0/dV0 ≈ −0.004, which at most indicates just a marginal effect. Hence, a blue tilt in the V versus (V − I) CMD is detected for the blue GCs around NGC 3258 but not for NGC 3268. On the other hand, its presence can be seen for both galaxies in the respective I versus (B − I) CMDs performed by Harris et al. (2006) with ACS data.
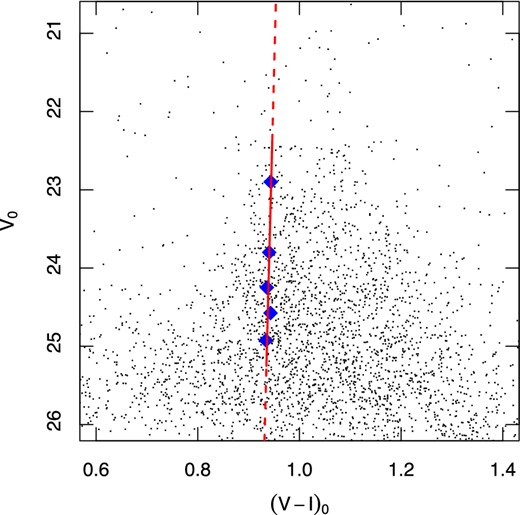
(V, I) CMD for the NGC 3268 GCS. Filled blue diamonds are the mean colours of blue GCs in five equally populated magnitude bins. The red solid line represents the fit to these points, while the dashed lines indicate its extrapolation.
The left-hand panel of Fig. 5 shows the (V, I) CMD for the NGC 3268 ACOs (filled circles) and UCD candidates (open circles). The black circles indicate the ACOs with available (V, I) photometry and the brown circles the ones located outside the FORS1 fields, for which such photometry was derived from the (C, T1) Washington photometry (see Section 3). The dashed line indicates the extrapolation of the ‘blue tilt’. The blue and red regions in the CMD are centred on the (V − I) peaks of the Gaussians fitted to the blue and red GC colour distributions, respectively, and their widths are twice the corresponding dispersions (values from Bassino et al. 2008). The right-hand panel is like the left-hand panel but for the NGC 3258 ACOs and UCD candidates presented in Paper I.
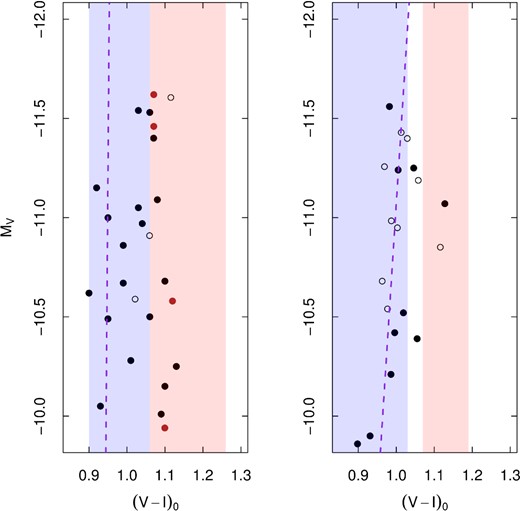
Left-hand panel: (V, I) CMD for the NGC 3268 ACOs (filled circles) and UCD candidates (open circles). The black circles indicate ACOs with available (V, I) photometry while the brown ones identify ACOs with (V, I) photometry derived from the Washington photometry (see Section 3). The dashed line indicates the extrapolation of the ‘blue tilt’. The blue and red regions are centred on the peaks of the Gaussians fitted to the blue and red GCs colour distributions, respectively, while their widths are twice the respective dispersions (values from Bassino et al. 2008). Right-hand panel: as in the left-hand panel but for the NGC 3258 ACOs and UCD candidates from Paper I.
Fig. 5 shows that, as already mentioned in Paper I, ACOs and UCD candidates around NGC 3258 (right-hand panel) seem to follow the extrapolation of the blue tilt towards brighter luminosities. However, this behaviour is not similar in NGC 3268 (left-hand panel). In this latter galaxy, the brightest ACOs (with MV ≈ −11.5) have colours close to the limit between blue and red GCs, i.e. (V − I)0 ∼ 1.05. At the same time, the subsample corresponding to the rest of compact objects with fainter luminosities occupy a wider colour range, including the whole range of blue GCs (two thirds of the subsample) and the bluest side of the range of red GCs (one third of the subsample). It is also clearly seen that, as mentioned in Section 3, the fraction of ACOs with colours like red GCs is higher in NGC 3268 than in NGC 3258, and the same applies to the UCD candidates.
3.4 Expected number of bright GCs around NGC 3268
In the following, we will compare the number of bright GCs, estimated from the luminosity function of the GC candidates (GCLFs), with the actual number of ACOs and UCD candidates we have identified in the ACS field.
We obtained the GCLF around NGC 3268 from our FORS1 photometry, taking into account GC candidates with 0.7 < (V − I)0 < 1.3 in the radial regime 0.33 arcmin < Rproj < 2 arcmin. The LF was corrected for incompleteness and background subtracted. The GCLF is usually represented by a Gaussian profile (e.g. Bassino et al. 2008) or a t5 function (e.g. Harris 2001; Richtler 2003). We fitted both profiles to the GC candidates brighter than V = 25.75 (which corresponds to a completeness of ≈60 per cent). For the Gaussian profile, the fitted scaling factor, maximum magnitude and dispersion were 547 ± 15 GCs, 25.2 ± 0.1 mag and 1.16 ± 0.08 mag, respectively. In the case of the t5 function, the scaling factor and maximum magnitude result 566 ± 15 GCs and 25.1 ± 0.04 mag.
The numerical integration for GCs brighter than MV = −10.5, within 2 arcmin from the centre of NGC 3268 (this area is similar to the ACS field of view), gives 8 ± 3 or 25 ± 1 bright GCs, using Gaussian and t5 profiles, respectively. Our previous analysis of the ACS field centred on NGC 3268, showed that it contains nine ACOs plus three UCD candidates, all objects brighter than MV = −10.5. This falls within the range of the number of bright GCs estimated from both profiles. We can extrapolate the previous results out to 10 arcmin from the centre of NGC 3268, obtaining 22 ± 8 and 70 ± 3 GCs brighter than MV = −10.5, using the Gaussian and the t5 profiles, respectively.
We could try a different approach. Assuming for the GCS of NGC 3268 a population of 4750 members (Bassino et al. 2008), we generate 100 samples of the same size with a Monte Carlo code. We use as distribution function the Gaussian profile fitted previously. For different Monte Carlo runs, we perform slight variations in the distribution parameters, assuming a normal distribution for their errors. Then, we find that the mean magnitude of the brightest object is MV ≈ −11.7, with a high scatter. In less than 10 per cent of the cases the brightest object reaches MV ≈ −13. Afterwards, we look for the magnitudes of the five brightest objects in each run. The mean magnitude of the fifth brightest artificial GCs is MV ≈ −11.1. These results suggest that the magnitudes of ACOs around NGC 3268 are within the expected values for the bright end of the GCLF. This was also found when we generated the samples from the t5 distribution.
3.5 Mass estimate for NGC 3268
The sample of radial velocities is much too small to perform a radially dependent analysis of the mass profile, but some mass estimators have been proposed whose strengths it is to make best use of such small samples.
Then, we get for the constant C = 6.54. We exclude from the analysis the outermost ACO, because its projected distance to NGC 3268 is more than twice the projected distance for the rest of them. Then, the mass within 47.2 kpc is 2.7 × 10¹² M⊙.
4 DISCUSSION
Mieske et al. (2012) address two possible formation channels for the UCDs: that they are tidally disrupted dwarf galaxies or just the brightest members of the GC population. They perform a statistical analysis based on the sizes of the UCD samples in different environments and conclude that the latter option, i.e. UCDs being massive GCs, can fully explain the number of discovered UCDs. Our results support this conclusion, despite the differences in the estimated number of GCs for Gaussian and t5 functions.
The galaxy ‘threshing’ scenario, i.e. the tidal disruption of a dE,N galaxy where only remains its nucleus, has been proposed by several authors (Bassino et al. 1994; Bekki et al. 2001, 2003; Goerdt et al. 2008). Moreover, it has been suggested as the possible origin for ω Cent (Lee et al. 1999; Bekki & Freeman 2003; Wylie-de Boer, Freeman & Williams 2010), and other remarkable extragalactic compact objects (e.g. Strader et al. 2013). The simulations made by Pfeffer & Baumgardt (2013) show that, for a galaxy with a nucleus of MV = −10, depending on the dwarf galaxy structure and its orbital parameters, an object as faint as MV = −9-10.2 and a few parsecs of half-light radius could be generated. This implies that the remnant of disrupted dE,N galaxies could present similar photometric properties to many of the UCDs and bright GCs in our sample. The UCDs in our sample occupy a similar region in the CMD than Antlia dE,N nuclei, particularly for the bluer objects.
The mass estimator applied to the heliocentric radial velocities of the ACOs presented in this work indicates that NGC 3268 is a massive elliptical galaxy. Its mass up to ≈47 kpc is similar than that of many gEs in dense environments (e.g. Humphrey et al. 2006; Schuberth et al. 2010, 2012).
Considering the luminosity profile and the mean colour V − R ≈ 0.7 derived for NGC 3268 by Dirsch et al. (2003b), its integrated magnitude up to ≈47 kpc is V ≈ 10.65, which implies (assuming m − M = 32.73) a total mass-to-light ratio of ϒ⊙ ≈ 46.5. This value would indicate the presence of a massive group-scale halo.
5 SUMMARY AND CONCLUSIONS
Using CTIO (MOSAIC II), VLT (FORS1), and archival HST (ACS) imaging data as well as GEMINI (GMOS) spectroscopic data, we have studied a sample of objects in the Antlia cluster, that could be identified as UCDs and bright GCs. We discuss the entire sample of UCDs identified until now in the Antlia cluster, including those around NGC 3258 (Paper I). We summarize our results and conclusions as follows.
We present 24 objects in the Antlia cluster that, according to their luminosities, are classified either as bright GCs or as UCDs. From the total, 23 are located around one of the two central Antlia galaxies, NGC 3268. The whole sample of ACO now consists of 35 spectroscopically confirmed objects.
For a subsample of ACOs, UCD candidates, and GC candidates located within the ACS fields, Reff have been measured with the ishape software. The GC candidates in the magnitude range −9 < MV < −10.5 seem to have almost equal effective radii, whose mean value is in agreement with the mean value of Galactic GCs. For objects brighter than MV = −10.5, classified as UCD candidates, a size–luminosity relation could exist, but there is no compelling evidence. The UCDs in this paper do not present Reff as large as Virgo ones.
In an MV versus (V − I) CMD, blue ACOs cover the same colour and magnitude ranges as the nuclei of dE,N galaxies studied in Paper I. Some of the ACOs may thus be remnants of nucleated galaxies. In comparison with Fornax, we did not find any UCD as bright as MV ≈ −13. The ACOs in our sample present similar brightnesses, colours and radii as faint UCDs in Fornax. A comparison with Virgo UCDs could be biased due to the selection limit in Reff applied by the authors in that case.
We have discovered 10 objects around both central galaxies, with magnitudes similar to GCs, but having larger radii (10 < Reff < 17 pc). They appear to be similar to the ‘ECs’ found in the Milky Way and other galaxies (Madrid 2011; Brüns & Kroupa 2012, and references therein) but that still have to be confirmed as members. Most of them have colours similar to blue GCs.
From the GCLF of NGC 3258 and NGC 3268 we estimated the expected number of GCs brighter than MV = −10.5. These values, once corrected by the areal coverage of our UCDs search, are of the same order as our UCD samples. In this case, it would be not necessary to invoke a different origin to explain the number of UCDs. Finally, in the scheme proposed by Norris & Kannappan (2011), our results support the idea that UCDs could be both, previous galaxy nuclei or normal, but bright GCs.
We used the sample of spectroscopically confirmed ACOs around NGC 3268 as tracers for the total galaxy mass. We obtained for the mass enclosed up to 47.2 kpc from the galaxy centre a value of 2.7 × 10¹² M⊙. This value is in reasonable agreement with the value derived from X-ray observations.
This work was funded with grants from Consejo Nacional de Investigaciones Científicas y Técnicas de la República Argentina, and Universidad Nacional de La Plata (Argentina). TR is grateful for financial support from FONDECYT project no. 1100620, and from the BASAL Centro de Astrofísica y Tecnologías Afines (CATA) PFB-06/2007. JP Caso is grateful to Francisco Azpillicueta, Ignacio Gargiulo, and Cristian Vega Martínez for useful discussions.
Based on observations collected at the Cerro Tololo Interamerican Observatory (CTIO); observations obtained at the Gemini Observatory, which is operated by the Association of Universities for Research in Astronomy, Inc., under a cooperative agreement with the NSF on behalf of the Gemini partnership: the National Science Foundation (United States), the Science and Technology Facilities Council (United Kingdom), the National Research Council (Canada), CONICYT (Chile), the Australian Research Council (Australia), Ministério da Ciencia e Tecnologia (Brazil) and Ministerio de Ciencia, Tecnología e Innovación Productiva (Argentina); and observations carried out at the European Southern Observatory, Paranal (Chile), programme 71.B-0122(A).
This research has made use of the NASA/IPAC Extragalactic Database (NED) which is operated by the Jet Propulsion Laboratory, California Institute of Technology, under contract with the National Aeronautics and Space Administration.
