


Abstract
Non-thermal pressure in the intracluster gas has been found ubiquitously in numerical simulations, and observed indirectly. In this paper we develop an analytical model for intracluster non-thermal pressure in the virial region of relaxed clusters. We write down and solve a first-order differential equation describing the evolution of non-thermal velocity dispersion. This equation is based on insights gained from observations, numerical simulations, and theory of turbulence. The non-thermal energy is sourced, in a self-similar fashion, by the mass growth of clusters via mergers and accretion, and dissipates with a time-scale determined by the turnover time of the largest turbulence eddies. Our model predicts a radial profile of non-thermal pressure for relaxed clusters. The non-thermal fraction increases with radius, redshift, and cluster mass, in agreement with numerical simulations. The radial dependence is due to a rapid increase of the dissipation time-scale with radii, and the mass and redshift dependence comes from the mass growth history. Combing our model for the non-thermal fraction with the Komatsu–Seljak model for the total pressure, we obtain thermal pressure profiles, and compute the hydrostatic mass bias. We find typically 10 per cent bias for the hydrostatic mass enclosed within r500.
1 INTRODUCTION
During hierarchical assembly of galaxy clusters through accretion and mergers, gravitational energy is transferred to random motion of the intracluster matter. Most of the random motion of baryonic matter is thermalized, leading to X-ray emitting temperatures as well as high thermal pressure support which sustains the intracluster gas against a gravitational collapse.
In addition to the thermal motion, there can be other sources of pressure support in the intracluster gas, including bulk motion, turbulence, cosmic rays, and magnetic fields. The non-thermal pressure support is difficult to detect directly using X-ray or Sunyaev–Zel'dovich (SZ) observations due to the small electron velocities it is associated with. However, if not accounted for, it causes a bias in the cluster mass estimated from X-ray or SZ observations assuming hydrostatic equilibrium between gravity and thermal, rather than total, pressure.
While observational evidence of intracluster non-thermal pressure exists (see e.g. Allen 1998; Mahdavi et al. 2008; Richard et al. 2010; Zhang et al. 2010; Shang & Oh 2012; von der Linden et al. 2014, and references within), most of the current knowledge on the level of non-thermal pressure support comes from numerical simulations (e.g. Dolag et al. 2005; Vazza et al. 2006, 2009; Iapichino & Niemeyer 2008; Maier et al. 2009; Shaw et al. 2010; Iapichino et al. 2011; Battaglia et al. 2012a). The simulations show a common trend of non-thermal fraction increasing towards larger radii in the cluster outskirts, and becoming comparable to the thermal pressure support at the virial radius. In terms of the cluster mass estimation, a hydrostatic mass bias is usually found to be on the order of 5–20 per cent in simulations (e.g. Rasia et al. 2006, 2012; Nagai, Vikhlinin & Kravtsov 2007b; Piffaretti & Valdarnini 2008; Meneghetti et al. 2010; Conte et al. 2011; Nelson et al. 2012; Krause et al. 2012).
In this paper, we present an analytical model for the non-thermal pressure support, which combines the insights gained from observations and numerical simulations.
The rest of the paper is organized as follows. In Section 2, we review the existing knowledge of non-thermal energy density in the intracluster gas, and draw reasonable postulations from them. In Section 3, we present a model for the fraction of non-thermal pressure relative to the total in the intracluster gas. In Section 4, we combine our model for the non-thermal fraction with a model for the total pressure to derive non-thermal and thermal pressure profiles. In Section 5, we compare the model predictions with simulations and observations. In Section 6 we calculate the hydrostatic mass bias. We discuss other sources of non-thermal pressure support in Section 7, discuss future research directions in Section 8, and conclude in Section 9.
We use the following cosmological parameters of a flat ΛCDM cosmology: matter content Ωm0 = 0.28, dark energy content ΩΛ = 0.72, Hubble parameter h0 = 0.7, slope of the initial power spectrum ns = 0.96, and the normalization of the matter power spectrum σ8 = 0.8.
2 INJECTION AND DISSIPATION OF INTRACLUSTER TURBULENCE
We decompose the total pressure into a thermal (‘th’) and a non-thermal (‘nth’) part, Ptot ≡ Pth + Pnth. We focus our study on what is usually considered as the major source of Pnth: the non-thermal random motion in the intracluster gas, and refer to it as ‘turbulence’ without distinguishing it from isotropic bulk motions. Other possible sources of non-thermal pressure, e.g. magnetic fields and cosmic rays, are neglected for the moment. We shall discuss them later in Section 7.
Note that turbulent motions exist in the intracluster medium only as a transient phenomenon. Given a sufficiently long time, they will all dissipate into heat, and the intracluster gas will be in perfect hydrostatic equilibrium. Therefore, how much turbulence there is in a cluster depends predominantly on its dynamical state, and the amplitude of intracluster turbulence reflects the past and undergoing growth of the cluster via accretion and merger events.
2.1 Turbulence injection
Physically, kinetic energy can be converted into turbulence and thermal energy through different processes, e.g. merger and accretion shocks and wakes, cluster core sloshing and galaxy wakes, with the help of plasma instabilities. Gravitational energy can also be adiabatically converted into thermal and turbulence energy via adiabatic contraction. Supported by hydrodynamic simulations (e.g. Ryu et al. 2003; Pfrommer et al. 2006; Skillman et al. 2008), we consider the low Mach-number intracluster shocks created at merger events or merger-induced complex flows called ‘internal shocks’ to be the major machinery of energy conversion. Consequently, we shall call the parameter η in equation (2) the ‘turbulence injection efficiency’ of the internal shocks. This parameter should be determined primarily by the Mach number of the internal shocks.
We shall assume that η is a constant. While it is mainly for simplicity, this assumption is supported by the fact that the Mach numbers of the merger induced shocks are expected to be nearly universal from simple physical arguments (e.g. Sarazin 2002, and references therein). In simulations, the redshift and radius dependencies of the internal shock Mach number are indeed found to be weak within the virial region of the cluster [see e.g. fig. 6 of Ryu et al. 2003 for the redshift dependence, and fig. 9 of Vazza et al. (2009) for the radius dependence; see also Vazza et al. (2011) for a comparison of different simulation methods, although at lower resolutions]. We shall discuss the consequence of additional dependence of η in Section 7.
The energy injected into the intracluster gas during the cluster mass growth gets distributed over different radii as follows. To the first order, the intracluster pressure profile, and thus the energy density profile of the intracluster gas, is self-similar (Nagai, Kravtsov & Vikhlinin 2007a; Arnaud et al. 2010). To maintain this self-similarity during the mass growth of a cluster, the energy density must increase in a multiplicative fashion, i.e. the energy gained by a gas particle in the cluster is proportional to the existing energy of that particle, |$\Delta \sigma ^2_{\rm tot} \propto \sigma ^2_{\rm tot}$|. It has been shown numerically that this near self-similarity holds even after violent major-merger events (McCarthy et al. 2008). This can again be understood physically by the fact that the intracluster gas is processed by shocks whose Mach numbers do not vary very much as the shocks travel across the whole cluster.
In previous analytical studies, different turbulence energy injection scenarios have been considered. Cassano & Brunetti (2005) consider turbulence injection at single merger events, and assume that a fraction of the PdV work done by the in-falling sub-cluster is converted into intracluster turbulence energy. The volume swept by the sub-cluster in which turbulence is injected is estimated from the virial radius of the main cluster and the radius of the sub-cluster after ram-pressure stripping, following Fujita, Takizawa & Sarazin (2003). In their model, the turbulence injected roughly scales with the thermal energy of the cluster, which is in accordance with the |$\Delta \sigma ^2_{\rm nth} \propto \Delta \sigma ^2_{\rm tot} \propto \sigma ^2_{\rm tot}$| relation in our considerations, although they do not consider the radial distribution of the energy.
Cavaliere, Lapi & Fusco-Femiano (2011) also consider the non-thermal pressure support in the intracluster medium contributed by turbulence. In their work, turbulence is driven by the inflows of intergalactic gas across the virial accretion shocks. They assume an exponential decay of the radial profile of the turbulence-to-thermal fraction. The correlation length and the amplitude of the profile need to be obtained from fitting to observations. Since their turbulence driving mechanism is very different from what we consider, their results on turbulence pressure differ from ours, which we will discuss in Section 5.2.
In addition to the structure formation process, magnetothermal instability may drive turbulence in the presence of intracluster magnetic fields and a long-standing negative temperature gradient (Parrish et al. 2012; McCourt, Quataert & Parrish 2013). The turbulence driven by magnetothermal instability is found to be generally additive to the turbulence produced by structure formation. We shall not consider this potential source of non-thermal pressure in this paper.
2.2 Turbulence dissipation
The relation, td ∝ tdyn, derives from our assumption on the largest eddy size at each radius. Large coherent motions can be easily broken into eddies with sizes proportional to r owing to the geometry and density structure of the cluster. Whether the eddies at cluster outskirts could reach such large sizes depends on the turbulence injection mechanism. In hydrodynamical simulations, large-scale flows and low-curvature shocks are observed at cluster outskirts (e.g. Vazza et al. 2010), enabling the formation of large sized turbulence eddies.
If intracluster turbulence is coupled with magnetic fields, turbulence can give rise to magnetohydrodynamical waves which transfer energy from magnetic fluctuations to relativistic particles on small scales. This process provides an additional channel for energy dissipation at high k modes (e.g. Brunetti & Lazarian 2011). However, this does not affect the evolution of turbulence pressure, as the turbulence energy is contained predominantly in the largest scales which has the longest time-scale. In other words, the turbulence dissipation time-scale is insensitive to the small-scale physics, including the resistivity and viscosity of the gas.
3 EVOLUTION OF THE INTRACLUSTER NON-THERMAL PRESSURE FRACTION
3.1 The model
The dynamical time-scales in a galaxy cluster increase significantly from the inner region to the outskirts due to a steep slope of the density profile. It then follows from equation (3) that the turbulence dissipation time in the inner region of a galaxy cluster is much shorter than that in the outskirts. As a consequence, the magnitude of the non-thermal fraction at each radius evolves roughly independently with different time-scales. The scalings |$\Delta \sigma ^2_{\rm tot} \propto \sigma ^2_{\rm tot}$| and |$\Delta \sigma ^2_{\rm nth} = \eta \;\Delta \sigma ^2_{\rm tot}$| suggest that the injection of turbulence energy can also be treated independently at each radius. These considerations motivate our focusing on the evolution of turbulence and thermal energies at a single Eulerian radius, r.
The total one-dimensional velocity dispersion, σtot, is determined by the depth of cluster's gravitational potential. We present a method to compute |$\sigma ^2_{\rm tot}$| in Section 4, and regard it as a given quantity here. Equation (6) then forms an initial value problem. Once the initial condition, |$\sigma ^2_{\rm nth}(r,M_{\rm i},t_{\rm i})$|, at the initial time, ti, is chosen, we can use equation (6) to solve for the evolution of |$\sigma ^2_{\rm nth}(r,M_{\rm obs},t_{\rm obs})$| for any later times, tobs, given the mass growth history of the cluster, M(t).
The parameters in our model, β and η, have physical origins and therefore are not free parameters. From the current knowledge of intracluster gas, however, their values are not yet known precisely. The turbulence injection efficiency, η, ranges between 0 and 1 by definition. A high value of η > 0.6 is expected from the low Mach number (Mach number <3) of the internal shocks (Ryu et al. 2003; Kang et al. 2007). The parameter β ∼ 1 is expected from theory of turbulence, with rather large uncertainty. We will discuss the range of their values in more detail in Section 5.
3.2 Analytical solutions
Whereas the ratio of tgrowth and td sets the relative importance of turbulence growth and dissipation, a comparison of tobs − ti and the smaller of these two time-scales, min(tgrowth, td), determines how much turbulence energy can be accumulated by the time of observation.
4 TOTAL PRESSURE SUPPORT
To calculate the source term in equation (6), we need a model for the total pressure, Ptot. We may measure Ptot as a sum of the thermal and turbulence pressure directly from hydrodynamical simulations, or infer it assuming the hydrostatic equilibrium between the total pressure and gravitational potential gradients.
We shall follow the prescription of Komatsu & Seljak (2001) in this paper. We assume that the intracluster gas obeys a polytropic equation of state, |$P_{\rm tot} \propto \rho _{\rm gas}^{\Gamma }$|. While a polytropic distribution was introduced by Lea (1975) as a power-law relation between Pth and ρgas, recent simulations find that Ptot obeys a polytropic equation of state better than Pth (Shaw et al. 2010; Battaglia et al. 2012b). This assumption is valid to within 10 per cent precision inside the virial radius (Battaglia et al. 2012b).
Note that |$\sigma ^2_{\rm tot}$| and its growth rate can be obtained for individual galaxy clusters only when their individual mass growth history, M(t), is known. This is not a problem when studying numerically simulated clusters.
For observed galaxy clusters, individual mass growth histories are not known. Therefore, to compare to observational results, we study an averaged view of galaxy clusters, i.e. we consider ‘representative clusters’ whose mass growth histories are described by the average mass growth histories of all clusters of the same final mass. We shall use the average mass growth histories given by Zhao et al. (2009).
5 RESULTS
We use equation (19) with M(t) from Zhao et al. (2009; see Fig. 1) and |$\sigma ^2_{\rm tot}$| from Komatsu & Seljak (2001) to compute |$d\sigma ^2_{\rm tot}/dt$|, and use it to solve equation (6) for |$\sigma _{\rm nth}^2$|. We choose |$\sigma ^2_{\rm nth} = \eta \sigma ^2_{\rm tot}$| at zi = 6 as the initial condition of equation (6). We have already argued that the results are insensitive to a particular choice of initial conditions. We have confirmed this by varying |$\sigma ^2_{\rm nth}$| from 0 to |$\sigma ^2_{\rm tot}$| at zi, and by shifting zi to higher redshifts.
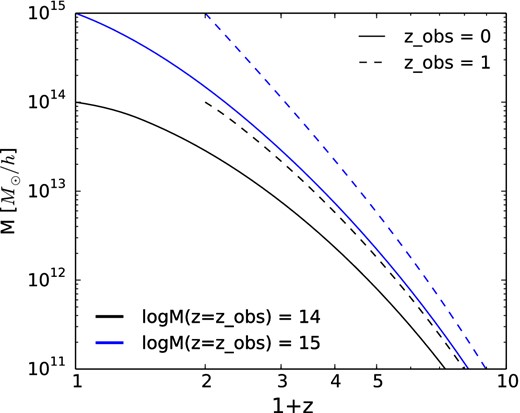
Mass growth histories from Zhao et al. (2009). The growth histories for galaxy clusters with the final masses of 1014h− 1M⊙ (black) and 1015h− 1M⊙ (blue) observed at z = 0 (solid lines) and z = 1 (dashed lines) are presented.
In the end, our procedure yields non-thermal and thermal pressure profiles as well as a gas density profile as a function of radius, mass, and redshift for a given set of β and η. We describe our procedure in more detail in Appendix A.
5.1 Time scales
Before we present the results on non-thermal pressure, let us study the relevant time-scales of the problem. In Figs 2 and 3 we compare tgrowth and tdyn = td/β to the proper time of the universe, t, at a few different redshifts.
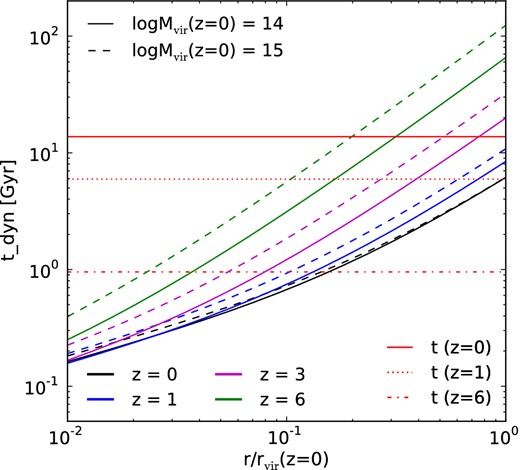
Dynamical time, tdyn (as defined by equation 3), of progenitors of clusters observed at z = 0 with the final masses of 1014h− 1M⊙ (solid lines) and 1015h− 1M⊙ (dashed lines), as they grow in mass with the mean mass growth rate from z = 6 to z = 0 (top to bottom lines; tdyn decreases with z). Shown is tdyn at a fixed Eulerian radius, r, divided by the corresponding virial radius computed at z = 0. The horizontal lines show the proper times (ages) of the universe at z = 0, 1, and 6 from the top to the bottom.

The dynamical time-scale given in equation (3), tdyn, at one radius is inversely proportional to the mean mass density of all gravitating matter inside that radius. Due to the steep density profile, tdyn is much shorter in the inner regions than at cluster outskirts. At a fixed Eulerian radius, tdyn decreases as galaxy clusters grow with time for most of the radius and redshift range, while the typical density of the clusters decreases with time. This happens because, when the cluster is more massive, the same Eulerian radius approaches the inner region of the cluster. The radius at which tdyn = t increases with time.
The cluster growth time-scale given in equation (7), tgrowth, increases rapidly towards low redshifts. Especially, at z = 0, we find tgrowth ≈ t for representative clusters with 1015h− 1M⊙, and tgrowth ≫ t for less massive clusters.
Comparing Figs 2 and 3, we find tgrowth ≳ tdyn in the inner regions of a cluster already since z = 6, and tgrowth ≫ tdyn at low redshifts where galaxy clusters are typically observed. At around the virial radius of clusters at z = 0, we find tgrowth ≪ tdyn at high redshifts and tgrowth ≳ tdyn at z = 0. If we choose β = td/tdyn ≈ 1, these results imply that turbulence dissipates efficiently in the inner regions of a cluster, while dissipation is less effective in the cluster outskirts.
As argued in Section 3.2, a comparison between tobs − ti and min(tgrowth, td) determines how close the non-thermal fraction is to its limiting value |$f_{\rm nth}^{\rm lim}$| given by equation (10). For the representative galaxy clusters considered here, we find (tobs − ti)/min(tgrowth, td) > 5 at small radii, mostly at low redshifts; thus, we expect |$f_{\rm nth}^{\rm lim}$| to be a good approximation of the non-thermal fraction at small radii.
The criterion (tobs − ti)/min(tgrowth, td) > 1 holds at a much wider redshift and radius range. At redshifts above z ≈ 1, it holds for all radii due to the rapid growth of clusters (hence small tgrowth), suggesting that |$f_{\rm nth}^{\rm lim}$| can also provide a rough estimate of the non-thermal fraction at high redshifts for all radii.
5.2 Non-thermal fraction
As the cluster mass increases and its gravitational potential deepens, the total velocity dispersion of the intracluster gas grows as well. The turbulence velocity dispersion, however, depends on a competition of the injection and dissipation of intracluster turbulence, and does not grow monotonously with time.
Fig. 4 shows the evolution of the total (from the Komatsu–Seljak profile) and turbulence (from equation 6) velocity dispersions for progenitors of clusters observed at z = 0 with the final mass of 1014.5h− 1M⊙. The coefficient β is taken to be unity, and a value of η = 0.7 is taken for the turbulence injection efficiency.
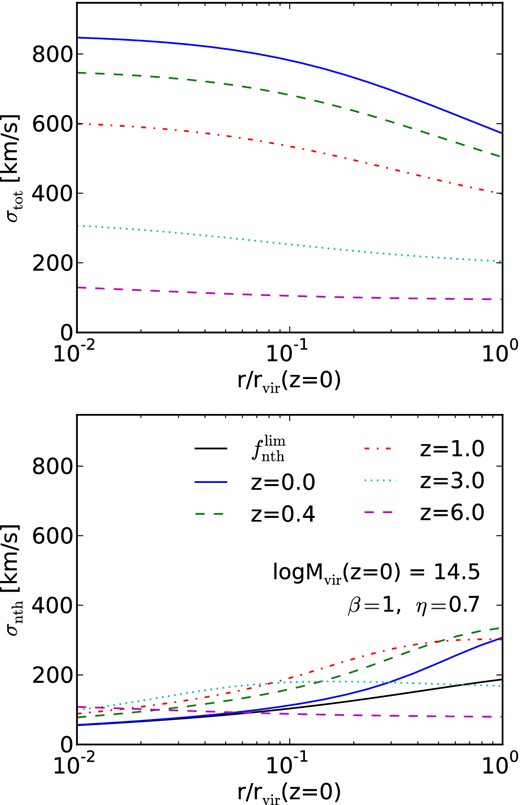
Total and non-thermal velocity dispersions, σtot (top panel) and σnth (bottom panel), in progenitors of clusters observed at z = 0 with the final mass of Mvir = 1014.5h− 1M⊙. The velocity dispersions are shown as functions of z and the Eulerian radius, r, divided by the corresponding virial radius computed at z = 0. The black solid line in the lower panel shows the limiting value of the turbulence velocity dispersion, |$\sigma _{\rm nth}^{\rm lim} = \sqrt{f_{\rm nth}^{\rm lim}} \;\sigma _{\rm tot}$|, at z = 0, with |$f_{\rm nth}^{\rm lim}$| given by equation (10).
The relevant time-scales at z = 0 are such that tgrowth ≳ tobs ≳ td at cluster outskirts, and tobs ≳ tgrowth ≫ td in the inner regions. At early times (z ≈ 6), while td ≲ tgrowth in the inner regions, tgrowth is the shortest time-scale at the outskirts.
We expect that |$\sigma ^2_{\rm nth}$| grows initially with |$\sigma ^2_{\rm tot}$|, but reaches a saturation value and starts to decrease when tgrowth/td ≥ η/fnth (see equation 8). The above time-scale arguments suggest that this transition happens earlier in the inner regions than at cluster outskirts. This behaviour is indeed seen in Fig. 4.
Comparing the limiting value of the non-thermal velocity dispersion (black solid line) and its actual value (blue solid line) at z = 0, we find that the limiting value is reached in the inner regions, but not at the outskirts. This is because tobs − ti ≫ min(tgrowth, td) holds in the inner regions but not at the outskirts.
Fig. 5 shows the value of the non-thermal fraction, fnth, for galaxy clusters of Mvir = 1014h− 1M⊙ and 1015h− 1M⊙ at three redshifts z = 0, 0.3 and 1. The radial dependence of the predicted fnth is primarily a reflection of the radial dependence of the turbulence dissipation time-scale, td. The higher density, hence the smaller td, in the inner region of a cluster makes it harder for turbulence to grow; thus, the predicted fnth increases with radii.
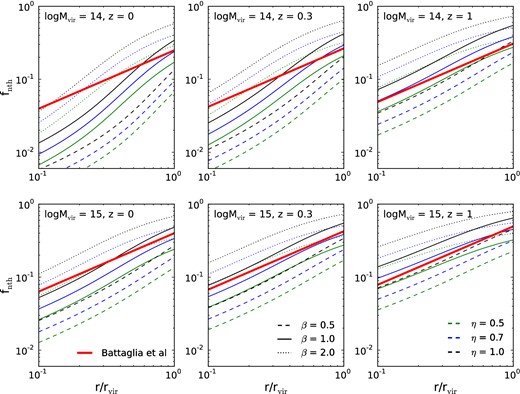
Predicted non-thermal fraction, fnth, of representative galaxy clusters with the mean mass growth history. The upper and lower panels show fnth for clusters with Mvir = 1014 and 1015h− 1M⊙, respectively. The left, middle, and right panels show three different redshifts z = 0, 0.3, and 1. In each panel, the dashed, solid, and dotted lines show β = 0.5, 1, and 2, respectively, while the green, blue, and black lines show η = 0.5, 0.7, and 1, respectively. The non-thermal fraction increases linearly with η, and roughly linearly with β. The fitting formula given by Battaglia et al. (2012a) is shown as the thick solid line.
The same argument also explains the dependence of the predicted fnth on β. The larger β is, the larger td is, and the larger the predicted fnth becomes. Fig. 5 shows that fnth is almost proportional to β, until when fnth starts to saturate to its long-term upper limit set by the turbulence injection efficiency, η. As shown in Section 3.2, when the initial condition is no longer important, fnth ∝ η, which explains the dependence on η presented in Fig. 5.
The mass and redshift dependence of fnth originate from different mass growth histories of clusters. To the first order, the increase of fnth with cluster masses and redshifts can be understood as a result of the higher mass growth rates (hence smaller tgrowth) at high redshifts and for more massive clusters. The radial dependence of fnth also depends on masses and redshifts. As fnth approaches its limiting value, the radial dependence weakens.
5.3 Comparison with hydrodynamical simulations
Hydrodynamical simulations help us further constrain the range of the model parameters. In two independent sets of simulations (Shaw et al. 2010; Battaglia et al. 2012a), the non-thermal fraction is found to be ≳50 per cent at the cluster outskirts. There is no evidence for saturation to a certain value. From this, the turbulence injection efficiency is constrained to be 0.5 ≤ η ≤ 1, in accordance with the expectation from the high turbulence injection efficiency associated with the low Mach numbers of the internal shocks. Fig. 5 shows that fnth increases roughly linearly with the product of η and β, as predicted by equation (10) for tgrowth > td. Even when η is set to its upper limit, β = 0.5 cannot give fnth seen in simulations. Therefore β > 0.5 is expected.
Recent simulation studies (Shaw et al. 2010; Battaglia et al. 2012a) provide fitting formulae of fnth. Shaw et al. (2010) use 16 clusters in adaptive mesh refinement (AMR) simulations (Nagai et al. 2007a), whereas Battaglia et al. (2012a) use a larger sample of galaxy clusters from TreePM-SPH simulations. While their results agree at z = 0, Battaglia et al. (2012a) find stronger redshift evolution of the non-thermal pressure (see fig. 3 of Battaglia et al. 2012a, and their text).
We find that fnth with β ≈ 1 and η ≈ 1 agree with the fitting formula of Battaglia et al. (2012a; thick red solid lines in Fig. 5). Given that the fitting formula assumes factorizable dependence on the radius, redshift, and mass, and that the typical mass1 is chosen to lie between those shown in Fig. 5, we conclude that the predicted radial slope also matches well with the simulations. This strongly supports our explanation for the radial dependence of fnth; namely, it is determined by the dependence of the turbulence dissipation time on radii, i.e. td increases rapidly with radii from the inner regions to the outskirts.
Dependence of fnth on redshifts and masses found in numerical simulations is also consistent with our analytical predictions. The redshift dependence of fnth predicted by our model appears to be stronger than the fitting formula shows. However, note that the simulation of Battaglia et al. (2012a) actually shows stronger redshift dependence than that is captured by the fitting formula.
5.4 Comparison with previous analytical work
Cavaliere et al. (2011) assume that the amplitude of the turbulence pressure is determined by the residual kinetic energy of the gas inflow after crossing the virial accretion shock, based on a smooth accretion model of Tozzi & Norman (2001) and Voit et al. (2003). The weakening of the accretion shocks at lower redshift due to the subsided accretion rate suggests a lower shock heating efficiency, hence a higher turbulence injection efficiency. Therefore, in their picture, the turbulence pressure is expected to become important only at late cosmic epochs, z < 0.3. This is in complete contrast to our results, which show that the subsided accretion rate at lower redshifts leads to a decreasing non-thermal fraction. The increase of the non-thermal fraction with redshift seen in the simulations of Battaglia et al. (2012a) agrees with our results.
Our model is highly predictive. We can calculate the radius, mass, and redshift dependence of the non-thermal pressure, once two physical dimensionless parameters, β and η, are specified. Cavaliere et al. (2011) parametrize the non-thermal fraction as Pnth/Pth = δRexp [−(rvir − r)2/ℓ2], treating δR and ℓ as free parameters. While these parameters must at least depend on masses and redshifts, no prescriptions for computing these parameters from their turbulence injection scenario are given. Bode et al. (2012) use the fitting formulae of Shaw et al. (2010) for the radial dependence of the non-thermal pressure, and set the amplitude according to dynamical state of clusters; thus, their approach is more phenomenological than ours.
More specific tests of our model using simulations and observations will be discussed in Section 8.
5.5 Thermal pressure
Combining our model of the non-thermal fraction and the model of the total pressure, we can calculate the observable quantity: the thermal pressure profile.
X-ray observations of a sample of nearby clusters (Arnaud et al. 2010) have shown that the intracluster thermal pressure profile follows an approximately universal shape out to a radius of r500 within which the mean mass density is 500 times the critical density. This ‘universal thermal pressure profile’ agrees roughly with the profiles seen in numerical simulations (Borgani et al. 2004; Nagai et al. 2007b; Piffaretti & Valdarnini 2008) after considering a 15 per cent mass bias between the two.
Recent observations of the SZ effect by the Planck satellite provide a direct measurement of the stacked thermal pressure profile of intracluster gas out to large radii (Planck Collaboration et al. 2013). They find a good agreement with the X-ray-derived profiles in the inner regions, while the Planck-derived profiles are shallower than the X-ray-derived ones at the outskirts.
Fig. 6 shows a comparison of the total and thermal pressure profiles predicted by our model and the observations.2 The predicted total pressure is significantly higher than the thermal pressure derived from the observations at the cluster outskirts. The difference between them increases towards larger radii, suggesting larger non-thermal pressure support there. The thermal pressure profiles we compute from our model, with preferred values of the parameters of (β, η) = (1, 1) or (1, 0.7), agree remarkably well with the observations. Our model has passed an important observational test.

Predicted total (thin dashed) and thermal (solid) pressure profiles compared to observations. The blue (lower) and green (upper) thick dashed lines show the profiles derived from X-ray (Arnaud et al. 2010) and SZ (Planck Collaboration et al. 2013) observations, respectively. Note that the total pressure depends very weakly on β and η, because the derived true cluster masses differ for different non-thermal pressure fraction.
6 HYDROSTATIC MASS BIAS
It is common practice to use X-ray data of galaxy clusters to infer their masses assuming hydrostatic equilibrium between the thermal pressure and gravity. The presence of non-thermal pressure inevitably biases such mass estimates. Our model allows us to calculate this ‘hydrostatic mass bias.’ Specifically, we calculate the mass enclosed within a given radius r inferred from hydrostatic equilibrium, MHSE(<r), and compare it to the true mass, M(<r). By definition, MHSE(<r) ≤ M(<r) at all radii.
Fig. 7 shows the ratios of MHSE and the true mass as a function of r/r500 for various combinations of β and η. The true virial mass of the cluster is 1014.5h− 1M⊙. The hydrostatic mass bias increases towards large radii due to the increased non-thermal pressure support. We typically find 5–10 per cent and 20–30 per cent mass biases for r ≈ r500 and 2r500, respectively, for plausible parameters, (β, η) = (1, 1) and (1, 0.7).
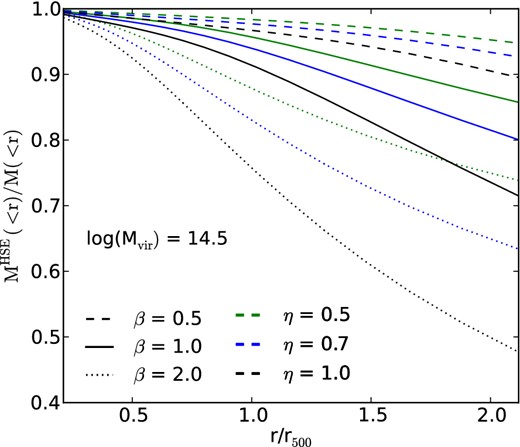
Predicted hydrostatic mass bias for a galaxy cluster at z = 0 with the mass of 1014.5h− 1M⊙ as a function of r/r500. The dashed, solid, and dotted lines show β = 0.5, 1, and 2, respectively, while the green, blue, and black lines show η = 0.5, 0.7, and 1, respectively.
Fig. 8 shows the ratios of MHSE and the true mass enclosed within r = r500 as a function of the true M500 ≡ M(<r500) for various combinations of β and η. The hydrostatic mass bias increases towards large masses due to higher mass accretion rates. We typically find 10 per cent bias for rich clusters for (β, η) = (1, 1) and (1, 0.7).
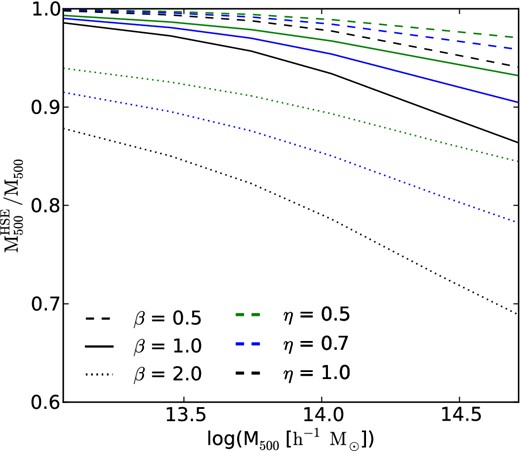
Similar to Fig. 7, but for the predicted hydrostatic mass bias for the mass enclosed within r500 as a function of the true M500.
7 OTHER SOURCES OF DEVIATION FROM HYDROSTATIC EQUILIBRIUM
In our model the source of intracluster turbulence is the growth of clusters via mergers and accretion. Another commonly recognized source is the active galactic nuclei (AGNs) hosted by central galaxies in clusters, which can inject additional turbulence into the cluster cores. This additional source can be taken naturally into account by adding a radius-dependent source term to the r.h.s. of equation (6). In this paper we neglect this, and focus on the outskirts of galaxy clusters.
The parameters β and η are taken as constants in our model. In principle, they may vary with radii, cluster masses, and redshifts. For example, η is in general a weak function of radii, as some simulations indicate that the Mach number of internal shocks varies weakly with radii. Once the forms of these dependencies are known, it is straightforward to incorporate them into our model. Neglecting a possible dependence of β and η on radii, masses, and redshifts would introduce an error in our model. However, the td-induced radial dependence and the tgrowth-induced cluster mass and redshift dependence are much stronger, and additional dependencies are expected to be negligible compared to them.
So far, we have assumed the turbulence pressure to be isotropic. Whereas an isotropic state usually is a higher entropy state to which a system generally evolves, physical conditions, for instance the density stratification in the intracluster medium, can trigger an anisotropic velocity field. The degree of anisotropy induced by the density stratification can be estimated by comparing the buoyancy time-scale and the turbulence eddy turnover time-scale. The corresponding dimensionless number, the Froude number, is found to be close to, or greater than, 1 in a typical cluster environment (Gaspari & Churazov 2013; Gaspari et al. 2014), implying that the anisotropy is weak. Vazza, Roediger & Brüggen (2012) use hydrodynamical simulations to demonstrate that anisotropy of the turbulence velocity field is not particularly strong in the virial region of relaxed clusters. Anisotropic magnetic field, if exists, can also induce anisotropic turbulence pressure. This is beyond the scope of this paper. In any case, in the presence of anisotropy, the non-thermal fraction given in this paper should be interpreted as the ratio of the radial components of |$\sigma ^2_{\rm nth}$| and |$\sigma ^2_{\rm tot}$|, whose evolution is described by equation (6).
Other sources of pressure support in the intracluster gas include magnetic fields and cosmic rays. Non-thermal cluster phenomena such as radio haloes, radio relics, and non-thermal X-ray emission (e.g. Nevalainen et al. 2004; Brunetti et al. 2008; Million & Allen 2009; Feretti et al. 2012; Kale et al. 2013) have been observed in some nearby galaxy clusters, suggesting the existence of magnetic fields and cosmic ray electrons in those clusters. The inferred amplitude of magnetic fields is on the order of μG, but its origin, universality and the non-thermal pressure it gives are still under debate (see e.g. Dolag & Schindler 2000; Carilli & Taylor 2002; Iapichino & Brüggen 2012). If, as commonly anticipated, magnetic fields in clusters are amplified by turbulence dynamo (Enßlin & Vogt 2006; Kang et al. 2007), then its saturation time-scale is set by the eddy turnover time-scale, and its energy dissipates as turbulence energy dissipates. The non-thermal pressure it contributes to can then be modelled conveniently by adding another source term to the r.h.s. of equation (6), and its amplitude is limited by that of the turbulence pressure. Cosmic rays are expected to be generated in accretion and merger shocks with high Mach numbers. However, efforts to detect signatures of cosmic ray ions in galaxy clusters have so far resulted in null results, which limits the cosmic ray pressure contribution to a few per cent of the thermal pressure in several clusters (e.g. Ackermann et al. 2010, 2013).
Recently, some numerical studies (Lau, Kravtsov & Nagai 2009; Lau, Nagai & Nelson 2013; Suto et al. 2013; Nelson et al. 2014) show that residual, collective accelerated motion in the gas at cluster outskirts contributes to additional deviation from hydrostatic equilibrium. This ‘acceleration bias’ cannot be taken into account as a form of pressure; however, it also originates from recent merger/accretion of the cluster, and has a dissipation time-scale of the sound crossing time which is comparable to the dynamical time defined in equation (3). Therefore one naturally expects that the acceleration bias increases towards larger radii due to significantly longer sound crossing times there. This may enable a treatment of the acceleration bias using the same framework of our model by considering its effect at each Eulerian radius separately.
8 FURTHER TESTS OF OUR MODEL
The fitting formula for fnth proposed by Battaglia et al. (2012a), to which we compared our results in Section 5.3, is not optimal in describing the simulation results since it assumes a factorizable form in terms of radius, cluster mass, and redshift. In general, these dependencies are coupled to each other, as found in both simulations and our model. Since our model predicts how these dependencies couple, e.g. radial dependence of fnth is stronger for low redshift and less massive clusters, one can test the existence of the predicted coupling in numerical simulations.
We have compared our model with simulations and observations using the average properties of cluster samples. With the help of hydrodynamical simulations with high time resolution, the evolution of profiles of individual galaxy clusters along their mass growth histories can be measured. This would enable a far more detailed comparison between the predicted non-thermal pressure and simulations of individual clusters.
Although comparison with observations is limited to cluster samples, here too, exists a large room for improvements. For instance, the redshift evolution and mass dependence of the HSE mass bias could be studied and tested against the predicted trend.
The biggest uncertainty in our non-thermal fraction model so far is the uncertainty in two physical parameters: the turbulence injection efficiency η, and especially β, the ratio between the turbulence dissipation time and the local dynamical time. We have constrained them to be 0.6 < η ≤ 1 and 0.5 < β < 2 from comparison to simulation results of non-thermal fraction and its mass dependence. We find that ηβ ≈ 1 is preferred from the existing observations. Numerical experiments of, e.g., turbulence generation by a single minor merger event and turbulence dissipation in an isolated cluster can help us further pin down their values, as well as prove the basis of our theoretical model.
9 CONCLUSION
We have developed an analytical model for non-thermal pressure of intracluster gas. The key part of this model is a model of the non-thermal fraction, fnth, which is based on a description of the evolution of turbulence energy in the intracluster medium in the form of a first-order differential equation.
Three time-scales are responsible for the non-thermal fraction. In particular, the ratio of tgrowth and td determines the limiting value of the non-thermal fraction, while the ratio of tobs − ti and min(tgrowth, td) determines how much the value of fnth at tobs has replaced its initial value and approached its limiting value.
The other parts of our non-thermal pressure model include a model of the total pressure, which is based on a re-interpretation of the self-similar model of gas pressure profile presented in Komatsu & Seljak (2001), and a model of the average mass growth history of clusters presented in Zhao et al. (2009).
The non-thermal fraction predicted by our model lies in the range seen in numerical simulations. Generic trends of the non-thermal fraction, e.g. the increase with radius, cluster mass and redshift, seen in numerical simulations are successfully reproduced by our analytical model. Our analytical model gives physical insights into the cause of the generic trends. For example, the increasing non-thermal fraction with radii is explained by the increasing turbulence dissipation time-scale, and the increase at higher redshift is mainly due to the higher cluster growth rate.
Combining our model of the non-thermal fraction and the self-similar model of the total pressure profile, we obtain thermal pressure profiles which match well with the existing simulations and observations. We also calculate the hydrostatic mass bias, typically finding 10 per cent mass bias for M500 of rich clusters.
Our model provides physical understandings as well as detailed predictions of the non-thermal pressure support in galaxy clusters. Once validated by hydrodynamical simulations of individual clusters and observations of different cluster samples (in addition to validation presented in this paper), it promises more accurate cluster mass estimations using HSE.
We thank Klaus Dolag for helpful discussions, as well as giving us access to his simulation data. We are also grateful to many colleagues at MPA, in particular Eugene Churazov, Rishi Khatri, Friedrich Meyer and Simon White for related discussions. We thank Nick Battaglia, Hy Trac, and Peng Oh for comments on the draft.
A typical mass of M200 = 3 × 10¹⁴ M⊙ is chosen by Battaglia et al. (2012a).
The electron pressure profiles derived from the observations are converted to the pressure contributed by all particles with the number density conversion factor of ne/n = 0.52 for fully ionized gas with the hydrogen abundance of 76 per cent and the helium abundance of 24 per cent.
Fortran routines are provided at http://www.mpa-garching.mpg.de/komatsu/CRL/clusters/komatsuseljakprofile
Fortran routines are provided at http://www.shao.ac.cn/dhzhao/mandc.html
REFERENCES
APPENDIX A: COMPUTE THE NON-THERMAL PRESSURE
Fig. A1 is a flowchart of the steps necessary for computing the non-thermal pressure. The key part of our non-thermal pressure model is the first-order differential equation given in equation (6). The steps of solving this equation are shown in the box in the middle of Fig. A1. Two inputs, namely the turbulence dissipation time td and the total velocity dispersion σtot as functions of radius, cluster mass and redshift, are required before solving the differential equation.
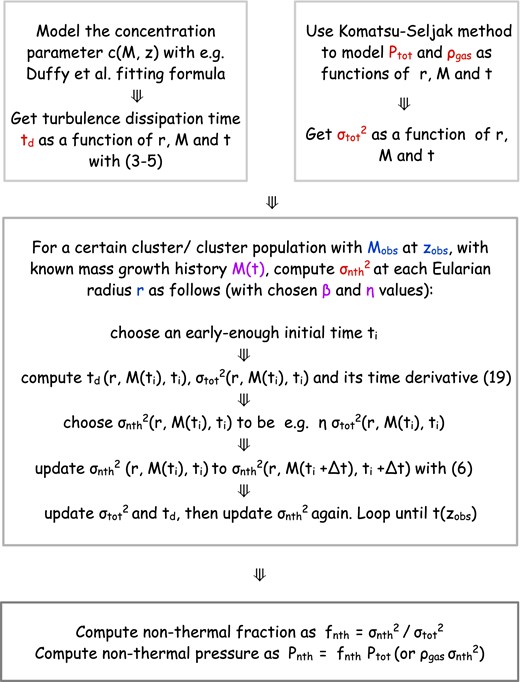
Steps necessary for computing the non-thermal pressure. Important intermediate quantities are marked in red. The mass growth history, M(t), and the two model parameters, β and η, which are marked in magenta, need to be chosen in advance. The final outputs (fnth, Pnth) are given as functions of the Eulerian radius r, and depend on the final mass and redshift of the cluster, which are marked in blue.
The procedures we have adopted in this paper for modelling td and σtot are shown as the two separate boxes at the top of Fig. A1. The turbulence dissipation time, td, is proportional to the dynamical time-scale which is determined by the depth of the gravitational potential well. We model the gravitational potential as a function of radius, cluster mass and redshift with that of an NFW profile. The total velocity dispersion, σtot, is calculated from the Komatsu–Seljak profile3 (Komatsu & Seljak 2001), which is re-interpreted as a model for the total pressure and the gas density profiles. Other models of td and/or σtot may be used instead of these models.
Solving equation (6) also requires a known mass growth history M(t) of the target galaxy cluster or cluster sample. In this paper we consider a representative sample of galaxy clusters; namely, those with the average mass growth history of all clusters of a given mass and redshift. For the average mass growth history we take the model of Zhao et al. (2009).4
The final outputs, fnth and Pnth, can be computed directly from the solution of equation (6), as shown in the box at the bottom of Fig. A1.
