


Abstract
We study particle dynamics in self-gravitating gaseous discs with a simple cooling law prescription via two-dimensional simulations in the shearing sheet approximation. It is well known that structures arising in the gaseous component of the disc due to a gravitational instability can have a significant effect on the evolution of dust particles. Previous results have shown that spiral density waves can be highly efficient at collecting dust particles, creating significant local overdensities of particles. The degree of such concentrations has been shown to be dependent on two parameters: the size of the dust particles and the rate of gas cooling. We expand on these findings, including the self-gravity of dust particles, to see how these particle overdensities evolve. We use the pencil code to solve the local shearing sheet equations for gas on a fixed grid together with the equations of motion for solids coupled to the gas through an aerodynamic drag force. We find that the enhancements in the surface density of particles in spiral density wave crests can reach levels high enough to allow the solid component of the disc to collapse under its own self-gravity. This produces many gravitationally bound collections of particles within the spiral structure. The total mass contained in bound structures appears nearly independent of the cooling time, suggesting that the formation of planetesimals through dust particle trapping by self-gravitating density waves may be possible at a larger range of radii within a disc than previously thought. So, density waves due to gravitational instabilities in the early stages of star formation may provide excellent sites for the rapid formation of many large, planetesimal-sized objects.
1 INTRODUCTION
The field of planet formation currently provides two methods through which large gas giant planets can form in discs around young stars. The favoured model of planet formation is known as the core accretion model. This model proposes that planets grow via a ‘bottom-up’ process, where a core of solid material grows from initially small, kilometre-sized objects via a series of collisions. If this core becomes massive enough, it will begin to accrete a gaseous envelope from the disc (Pollack et al. 1996). For a Jupiter-like gas giant planet to form, the solid core must reach a mass of ∼10 M⊕ before the disc is depleted of gas, a process which is observationally estimated to take from 106 to 107 yr (Haisch, Lada & Lada 2001). A key uncertainty in the core accretion model is the mechanism through which the disc becomes populated with kilometre-sized solid objects, similar to those found in the asteroid belt. It is likely that these objects are assembled via collisional growth from initial small dust grains present in the interstellar medium (ISM) during the star formation process that creates the protoplanetary disc. However, current theory has difficulties explaining the growth of dust grains past the metre-scale – the velocities of metre-sized objects should be larger than the critical threshold for sticking (see e.g. Blum & Wurm 2008; Guttler et al. 2010), so individual collisions between the bodies are no longer expected to be constructive. In this case, the self-gravity of any resulting rubble pile will be too weak to allow the debris to collapse into a gravitationally bound structure.
The dynamics of these smaller particles that ultimately grow to form kilometre-sized planetesimals is largely governed by the aerodynamic drag force that arises from the velocity difference between the particles and the surrounding gas. The radial pressure gradient within the disc tends to be negative, making the gas orbit with sub-Keplerian velocities. The dust is not affected by the gas pressure gradient and would orbit at Keplerian velocities in the absence of drag. The drag force exerted on the dust results in the solids losing angular momentum to the disc and drifting inward at a rate that depends on the particles’ size (Weidenschilling 1977). For very small grain sizes, the dust is tightly coupled to the gas in the disc and the radial drift velocities are small. For very large objects, the solids are decoupled from the gas, move in approximately Keplerian orbits and again have very small drift velocities. Particles in the intermediate-size range can, however, have large drift velocities. Although the exact size range depends on the local properties of the disc, drift velocities can exceed 103 cm s−1 for objects with sizes between 1 cm and 1 m (Weidenschilling 1977). Therefore the process through which planetesimals form must be rapid, unless this inward drift is offset. Laibe, Gonzalez & Maddison (2012) have shown that there may be surface density and temperature profiles for which particles may survive this inward migration, and Rice et al. (2004, 2006), Gibbons, Rice & Mamatsashvili (2012) have shown that local pressure maxima associated with density waves due to gravitational instabilities in the disc can trap the particles, saving them from the inward drift. Nevertheless, in the standard core accretion scenario, the period of growth from micron- to decametre-sized objects is assumed to be rapid, otherwise objects in this size range would rapidly spiral inward and be accreted on to the central protostar.
It has been shown that these spiral waves are highly effective at trapping the solids in the disc. Rice et al. (2004) showed, using global disc simulations, that the surface density of certain particle sizes can be enhanced by a factor of over 100 in spiral wave structure. Gibbons et al. (2012, hereafter Paper I) used local shearing sheet simulations to expand on these findings, mimicking the conditions at a range of disc radii to study the particle trapping capabilities of spiral density waves through the disc. These results showed that gravitational instabilities are responsible for creating large overdensities in the solid component of the disc at intermediate to large orbital radii (>20 au) within the disc. Rice et al. (2006) estimated from global disc simulations that the observed increase in the surface density of solids will lead to the creation of kilometre-scale planetesimals due to the gravitational collapse of the solids in these overdense regions. Here we aim to extend this to study the gravitational collapse of the solids via local shearing sheet simulations.
The goal of the present work is to demonstrate how the overdensities that form in the solid component of the disc can undergo gravitational collapse as a result of the solids’ self-gravity, promoting further grain growth, which can ultimately lead to the formation of planetesimals at very early evolutionary stages when the disc is still self-gravitating. This directly expands on the work in Paper I, where we studied the effect of varying effective cooling time of the gas on the particle-trapping capabilities of spiral density waves for a range of particle sizes (friction times), but including neither the particle self-gravity nor the back-reaction from the particles on gas via drag force. In this paper, taking into account both these factors, we numerically studied dynamical behaviour of particles embedded in a self-gravitating disc using a local shearing sheet approximation. We investigated the possibility that density enhancements in the solid component of the disc can lead to the direct formation of gravitationally bound solid clumps and, if so, study how such clumps might behave. In particular, we are interested in whether gravitationally bound accumulations of solids can form within the disc, since the formation of a large reservoir of planetesimals at early times in the disc is a major obstacle for the core accretion theory. In this regard, we would like to mention that self-gravity of the solid component has been demonstrated to be a principal agent promoting the formation of large planetesimals inside gaseous overdensities arising in compressible magnetohydrodynamic turbulence driven by the magnetorotational (MRI) instability in discs (Johansen et al. 2007; Johansen, Klahr & Henning 2011).
The paper is organized as follows. In Section 2 we outline the disc model and equations we solve in our simulations. In Section 3 we describe the evolution of the gas and dust particles. Summary and discussions are given in Section 4.
2 DYNAMICAL EQUATIONS
To investigate the dynamics of solid particles embedded in a self-gravitating protoplanetary disc, we solve the two-dimensional (2D) local shearing sheet equations for gas on a fixed grid, including disc self-gravity as in Gammie (2001), together with the equations of motion of solid particles coupled to the gas through aerodynamic drag force. As mentioned in the Introduction, following Johansen et al. (2011), we also include self-gravity of particles to examine their collapse properties. As a main numerical tool, we employ the pencil code.1 The pencil code is a sixth-order spatial and third-order temporal finite difference code (see Brandenburg 2003 for full details). The pencil code treats solids as numerical superparticles (Johansen, Klahr & Henning 2006; Johansen et al. 2011).
In the shearing sheet approximation, disc dynamics is studied in the local Cartesian coordinate frame centred at some arbitrary radius, r0, from the central object and rotating with the disc's angular frequency, Ω, at this radius. In this frame, the x-axis points radially away from the central object, the y-axis points in the azimuthal direction of the disc's differential rotation, which in turn manifests itself as an azimuthal parallel flow characterized by a linear shear, q, of background velocity along the x-axis, |${\boldsymbol u}_0=(0,-q\Omega x)$|. The equilibrium surface densities of gas, Σ0, and particles, Σp, 0, are spatially uniform. Since the disc is cool and therefore thin, the aspect ratio is small, H/r0 ≪ 1, where H = cs/Ω is the disc scale height and cs is the gas sound speed. The local shearing sheet model is based on the expansion of the basic 2D hydrodynamic equations of motion to the lowest order in this small parameter assuming that the disc is also razor thin (see e.g. Gammie 2001).
2.1 Gas density
2.2 Gas velocity
2.3 Entropy
2.4 Dust particles
2.5 Self-gravity
2.6 Units and initial conditions
We normalize our parameters by setting cs0 = Ω = Σ0 = 1. The time and velocity units are [t] = Ω−1 and [u] = cs0, resulting in the orbital period T = 2π. The unit of length is the scale-height, [l] = H = cs0/Ω. The initial Toomre Q = cs0Ω/πGΣ0 parameter is taken to be 1 throughout the domain. This sets the gravitational constant G = π− 1. The surface density of gas is initially uniform and set to unity. The simulation domain is a square with dimensions Lx = Ly = 80GΣ0/Ω2 and is divided into a grid of Nx × Ny = 1024 × 1024 cells with sizes Δx × Δy = Lx/Nx × Ly/Ny. This choice of units sets the domain size Lx = 80H/πQ = 25.46H. It is worth noting that the cooling time, tc, which we have assumed to be constant throughout the sheet, in reality is tc = tc(Σ, U, Ω) as described by Johnson & Gammie (2003). However, the use of constant cooling time over a sheet of this size allows us to infer the general behaviour of the dust particles at a given location within the disc.
The gas velocity field is initially perturbed by some small random fluctuations with the uniform rms amplitude |$\sqrt{\langle \delta {\boldsymbol u}^2\rangle } = 10^{-3}$|. We take the viscosity and diffusion coefficients to be ν = 10−2 and νsh = Dsh = 5.0. As shown in Paper I, typical values of the radial drift parameter, Δv, does not have a significant effect on the outcome of the simulations, therefore, in all the simulations presented below we take Δv = 0.02. We use 5 × 10⁵ particles, split evenly between five friction times, τf = [0.01, 0.1, 1, 10, 100] Ω− 1. Bai & Stone (2010) and Laibe et al. (2012) have shown that there is a spatial resolution criterion which applies to coupled dust and gas simulations such as those outlined above. For the dust particles to be properly resolved, the grid spacing must satisfy Δx < csτf. For the chosen set of parameters we have Δx ∼ 0.07csτf, so this condition is satisfied for all but the τf = 0.01 Ω−1 particles. As noted in Paper I, this underresolution of particles does not appear to create any numerical inconsistencies in the evolution of the smallest particles.
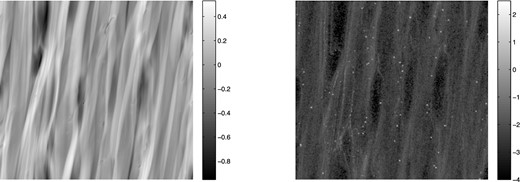
In all the runs below, each particle species with a fixed radius/friction time is distributed spatially uniformly with the average surface density of Σp, 0 = 10− 2Σ0 prescribed according to the standard value of dust-to-gas ratio, except one low particle mass run (Fig. 1), where we take Σp, 0 = 10− 3Σ0. The particles are initially given random positions within the sheet and zero velocities, relative to the background Keplerian flow, |${\boldsymbol v}_{\rm p}(t=0)=0$|.
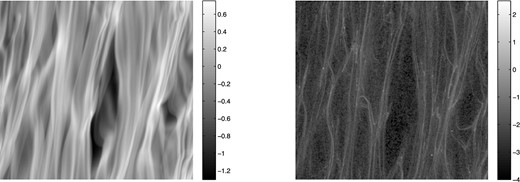
Logarithmic surface density of the gas (left) and particles (right) in the quasi-steady state in the run starting with a lower surface density of particles, Σp, 0 = 10− 3Σ0, at tc = 10 Ω−1. The dust particles are preferentially collected in the overdensities (crests) of density waves formed due to the gravitational instability in the gas. Because of the low dust mass, the gas and particle dynamics are largely unaffected by the particle self-gravity and by the back-reaction via drag force.
3 RESULTS
3.1 Gas evolution
The evolution of the gaseous component of the disc is in good agreement with that observed in analogous studies based on the shearing sheet formalism (Gammie 2001; Johnson & Gammie 2003; Mamatsashvili & Rice 2009; Rice et al. 2011; Paper I). The small initial velocity fluctuations grow and develop into non-linear fluctuations in velocity, surface density and potential. Shocks then develop which proceed to heat the gas, while the cooling acts to reduce the entropy of the gas. Density structures develop which are sheared out by differential rotation. These density structures tend to take a trailing form, leading to a finite shear stress and angular momentum transport parameter α (Gammie 2001). After a few orbits, the heating due to shocks is balanced by the cooling term and the disc settles into a quasi-steady self-regulated gravitoturbulent state (Fig. 1, left-hand panel), where the domain-averaged thermal, kinetic and gravitational energies of the disc are approximately constant with time. In this state, the surface density field clearly shows elongated trailing surface density features, or spiral density waves. The amplitude of these density waves, and consequently their capability to trap dust particles, depends on the cooling time of the gas (Cossins, Lodato & Clarke 2009; Rice et al. 2011).
In this study, as noted above, we also include the self-gravity of particles and back-reaction of the particles’ drag force on the evolution of the gas, the processes omitted in Paper I, due to the massless test particles adopted by that study. Here we include the back-reaction for both values of initial dust-to-gas mass ratios, 0.01 and 0.001, considered. Figs 1–5 show the surface density of the gas and particles (for all species, i.e. friction times) in the quasi-steady gravitoturbulent state at the end of each simulation performed. Generally, the evolution of the gas appears to be almost identical to the results presented in Paper I, where the particles do not affect the gas, however, close examination of the Σp, 0/Σ0 = 10− 2 runs shows that when the particle density reaches extremely high concentrations, the wakes of large clouds of particles are visible in the gas. These wakes appear to become more pronounced as the cooling time increases, possibly due to the density waves having less robust structure in the simulations with longer cooling times. However, in none of the runs do these features appear to have a significant influence on the overall evolution of the gas.
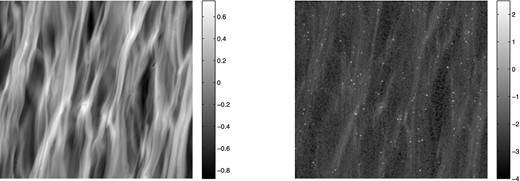
As in Fig. 1, but for the standard simulation starting with Σp, 0 = 10− 2Σ0 and tc = 10 Ω−1. Particles are trapped in the overdensities created by density waves in the gas. Because of the particles’ gravitational interaction with each other, some of these trapped particle groups, which happen to reach large enough concentrations, collapse and form very dense bound clumps (white dots). Part of these clumps has so high densities that their back-reaction on the gas results in the wake of the clumps’ motion appearing in the gas.
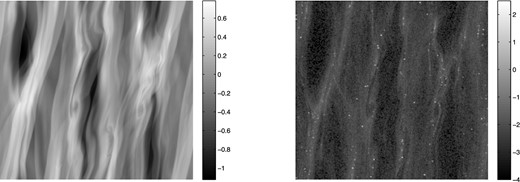
Same as in Fig. 2, but for tc = 20 Ω−1.
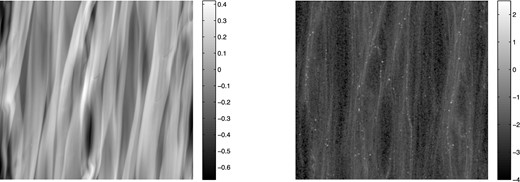
Same as in Fig. 2, but for tc = 40 Ω−1. Wakes of three bound clumps of particles are discernible in the gas density map.
Same as in Fig. 2, but for tc = 80 Ω−1. Wakes of several bound clumps of particles are clearly visible in the gas density map.
3.2 Particle concentration
The particles, which initially have zero velocities (relative to the Keplerian flow) and random locations within the simulation domain, are not evolved until the gas has undergone an initial burst phase of gravitational instability and settled into a quasi-steady state. Once the gas has reached this state, we release the dust particles. For the tc = 10 Ω−1 and 20 Ω−1 runs, the particles are introduced at a time tpar = 10T, while for the tc = 40 Ω−1 and 80 Ω−1 runs they are introduced at tpar = 20T and 30T, respectively. At this point, we switch on the drag force between the gas and the dust particles, evolving the system for a further five orbits in each case until the dust particles have begun to trace the structure of the gas. Finally, we introduce the self-gravity of the particles, evolving the system with both the drag force and particle self-gravity for another 25 orbits.
Once the particles are introduced, they are drawn to local pressure maxima associated with the density waves in the gas. Fig. 1 shows the logarithmic surface densities of both the gas and dust grains once the system has reached a quasi-steady state at t = 40T in the run with tc = 10 Ω−1 and Σp, 0 = 10− 3Σ0. Comparing the gaseous and dust components of the simulation, we see the same correlation between the density enhancements in the gas and overdensities in the particles, as also observed in Paper I. The degree to which the presence of spiral density waves affects the particle concentration depends strongly on the friction time of the particles. As found in Paper I, the smaller particles with friction times τf = [0.01, 0.1, 1.0] Ω−1, tightly map the structure which forms due to gravitational instabilities in the gas, whilst the larger particles are not as affected by the drag force and their evolution is not significantly altered by the structures and motion of the gas. Comparing this low particle density case with both the higher particle density case in Fig. 2 and the previous massless particle case considered in Paper I, we see that particle self-gravity for low-mass particles does not have a significant effect on their evolution. The evolution of particles in this case is qualitatively the same as that of the massless ones.
Figs 2–5 show the particle surface density in the simulations with Σp, 0 = 10− 2Σ0 and different cooling times. As outlined in Paper I, the cooling time imposed on the disc is related to the location of the simulation domain within the disc (Rafikov 2005; Clarke 2009; Rice & Armitage 2009), with the range of cooling times considered spanning the radial range 20–60 au for typical disc parameters. Typically, this radial interval corresponds to saturated quasi-steady self-gravitating state characterized by Q ∼1 in discs; at larger radii fragmentation is expected, whereas at smaller radii the effect of self-gravity becomes weaker, i.e. Q increases (see e.g. Boley et al. 2006; Clarke 2009). It is seen in Figs 2–5 that at all cooling times considered, the accumulation of particles within gas overdensities created by spiral density waves leads to the formation of very high density clouds of particles there. These particle clouds form exclusively as a result of the inclusion of the particle self-gravity term. Once the particle surface density in the clouds reaches a certain value, typically equal to the gas local density, gravitational instabilities set in the solid component of the disc, causing these filaments of particles that form within spiral density wave crests to contract into several highly dense, gravitationally bound objects (white dots on the particle density maps in Figs 2–5). Fig. 6 shows the surface density of the particles at the end of the Σp, 0 = 10− 2Σ0, tc = 10 Ω−1 simulation decomposed into separate friction times. Here we see that the clouds are primarily composed of intermediate-size particles with friction times τf = [0.1, 1.0] Ω−1. Particles with these friction times tend to most efficiently concentrate into the density waves (see also Paper I) and make up the bulk of the mass that is contained in the clumps formed due to the particles’ self-gravity, for example, over 90 per cent of the mass in the most massive particle cloud in this simulation is made up of particles with these friction times.
![Logarithmic surface densities of the dust particles with different friction times in the run with Σp, 0 = 10− 2Σ0 and tc = 10 Ω−1 (Fig. 2) at t = 40T, when the disc is already in a quasi-steady state, or after 30 orbital times since the drag force between the gas and particles has been turned on. The total particle density field shown in Fig. 2 has been decomposed according to particle friction times τf = [0.01, 0.1, 1, 10, 100] Ω−1, so that each panel shows the surface density of particles with a specific friction time from the lowest in upper left-hand panel to the highest in the bottom middle panel. In the density maps of the τf = 0.1 Ω−1 (top right) and 1.0 Ω−1 (middle left) particles, we clearly see a number of highly dense structures (white dots), which are gravitationally bound.](https://oup.silverchair-cdn.com/oup/backfile/Content_public/Journal/mnras/442/1/10.1093_mnras_stu809/1/m_stu809fig6.jpeg?Expires=1749870764&Signature=ZSOA7jB~tOusOODNuPxR9T2Q71ncPbZE8heaLL2peN3Y7kljJdxgF2-impJayGj49rhJPxcge5wffVleGTcMMNT0bRSsiKOhw~hxZQe2pfQaOjmhR~IenvqaicLEnn3KMr1xjwT8UA1F6-1juFzc6jMPNITtsfE5GBYUU5P-9pvqMuWrOvVpcQx-1~8KNJr3o5ToqrPACYeu6TXIRgXW0WreVuPekMAWb6u6fh16iq4xkic19UsKDIDYCdvO5vS7VbFLjdqixx1YXXhWmmwZcT8cnC75qo-FVLAj2zMsmJfbk~48C~uzzqOUxw8jnPYIcusnpkujG-YEci9x8lIPSA__&Key-Pair-Id=APKAIE5G5CRDK6RD3PGA)
Logarithmic surface densities of the dust particles with different friction times in the run with Σp, 0 = 10− 2Σ0 and tc = 10 Ω−1 (Fig. 2) at t = 40T, when the disc is already in a quasi-steady state, or after 30 orbital times since the drag force between the gas and particles has been turned on. The total particle density field shown in Fig. 2 has been decomposed according to particle friction times τf = [0.01, 0.1, 1, 10, 100] Ω−1, so that each panel shows the surface density of particles with a specific friction time from the lowest in upper left-hand panel to the highest in the bottom middle panel. In the density maps of the τf = 0.1 Ω−1 (top right) and 1.0 Ω−1 (middle left) particles, we clearly see a number of highly dense structures (white dots), which are gravitationally bound.
The inclusion of self-gravity in the evolution of the dust particles causes their surface density to reach values ∼10 times higher than those in the absence of particle self-gravity. Fig. 7 plots the maximum surface density of the particles over the simulation domain as a function of time at different cooling times. Although for longer cooling times it takes accordingly longer for the particle surface density to reach a maximum value, this maximum appears to be almost independent of the cooling time, instead being determined by the strength of particle self-gravity (i.e. the total mass of particles in the simulation domain).
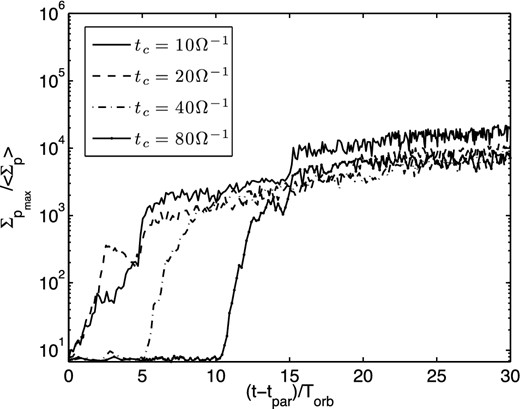
Maximum surface density of the dust particles within the domain as a function of time for each cooling time. There is little correlation between cooling time and the maximum surface density reached, implying the particle self-gravity can produce significant density enhancements in the solid component, even for longer cooling times.
Fig. 8 shows the mass of the largest gravitationally bound aggregate of particles in the domain as a function of time. It is seen that the mass of clumps that form does not really correlate with cooling time (and by extension with radius within the disc). Any increase in particle concentration which occurs in the case of lower cooling time tends to be offset by the larger surface density of particles at inner radii where cooling times are relatively long.
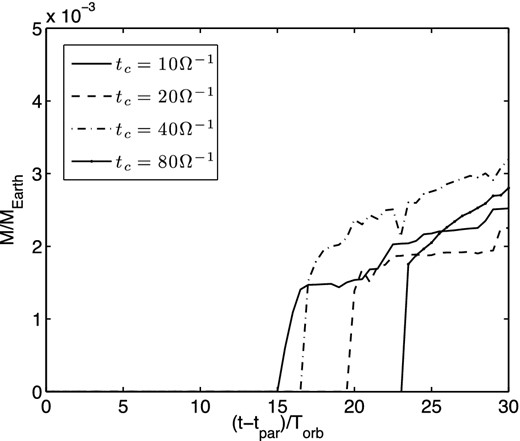
Mass of the largest gravitationally bound collection of particles in the domain as a function of time at each cooling time.
In practice, the particles will also undergo collisions as a result of being so densely packed in a given bound clump, potentially leading to their destruction and inhibiting planetesimal formation. As we showed in our previous studies (Rice et al. 2006; Paper I), the velocity dispersion of particles in self-gravitating discs is usually comparable to the gas sound speed, ∼100–1000 m s−1, which is much larger than the breakup collisional speed threshold (1–10 m s−1; Benz 2000; Blum & Wurm 2008). However, as shown in this paper, the main factor that holds the τf ∼ 1.0 Ω−1 particles2 together into bound clumps, despite such high velocities, is their self-gravity which is effective due to sufficiently high particle concentrations achieved in gaseous density waves (see also Rice et al. 2006). These clumps are bound in the sense that the velocity dispersion of their constituent particles is smaller than the escape velocity of self-gravitational binding energy of the mass enclosed within the clump. Of course, inside individual clump, particles can collide and even undergo fragmentation because of their large velocities. So, it is likely that each such clump may represent a number of small fragments rather than a single object. However, it is shown in Paper I that, in density waves, particle velocities tend to align due to drag force and therefore their relative velocities turn out to be smaller, possibly preventing collisional destruction. The resolution limits of our simulations do not allow us to follow the subsequent evolution of each bound clump, since it is smaller than the grid cell and probably continues to shrink even further due to its own gravity as a result of dissipation of particle velocity dispersion by drag force (see Lyra et al. 2009), so we only determine clump masses (i.e. how many particles are trapped in a given clump), like other related simulations addressing particle capture in gaseous structures in discs (Johansen et al. 2007, 2011; Lyra et al. 2008b, 2009). One of the main results of this study is to show that such gravitationally bound, long-lived clumps can do form when particle self-gravity is included. With a more detailed analysis, which takes into account the effects of collisions between particles, a clearer picture of the evolution of these ‘rubble piles’ can be built. By replacing the accumulations of particles presented here with a single massive particle, and modelling the accretion of gas from the disc on to the growing planet, the late stages of planet formation could be studied.
Figs 9 and 10 also show the number of particle clumps in the domain, which are gravitationally bound, next to the total mass of particles contained in gravitationally bound structures with time. From these figures, we see that at shorter cooling times clumps tend to form over shorter time intervals, and the runs with a shorter cooling time produce more gravitationally bound structures over the time period modelled. The total mass contained in bound structures is nearly independent of the cooling time, for similar reasons mentioned for Fig. 8. Although the simulations adopting a shorter cooling times tend to produce more clumps, and concentrate a higher fraction of the total particle mass available in the domain into bound clumps, the higher particle surface densities associated with the inner radii result in the total mass contained in bound structures being still somewhat higher.
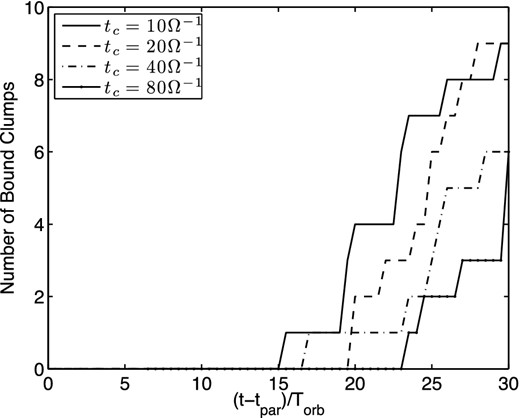
Number of gravitationally bound concentrations of particles in the domain as a function of time at each cooling time.
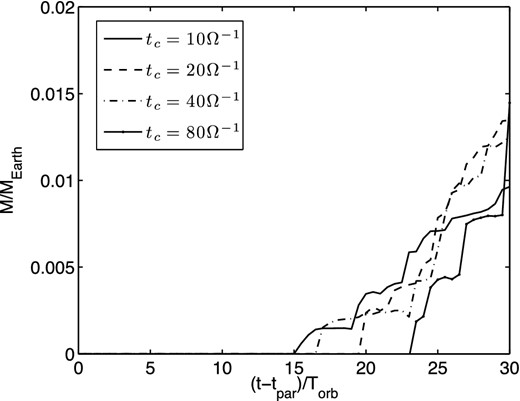
Total mass of gravitationally bound concentrations of particles in the domain as a function of time at each cooling time.
4 SUMMARY AND DISCUSSIONS
The work presented in this paper expands on the findings of Paper I, presenting a series of simulations modelling the evolution of dust particles in the presence of spiral density waves occurring as a result of gravitational instabilities in the disc. In particular, our study focuses on the effect that the gravitational interaction between massive dust particles, or their self-gravity, has on their evolution, expanding on the massless ‘tracer’ particles adopted previously by also taking into account the particle back-reaction on the gaseous component via drag force. A general picture of the evolution of the dust particles remains unchanged, they evolve through a quasi-steady gaseous density structures associated with density waves produced by a combined effect of disc self-gravity and cooling. Particles accumulate in high-density/pressure regions of spiral density waves, producing as a result significant overdensities in the solid component of the disc, with the magnitude of the particle density enhancement depending on both the cooling time of the gas and the friction time of the particles.
The inclusion of the particles’ self-gravity can have several significant effects on the evolution of the disc. The intensity of these effects depends on the total mass of particles in a given simulation. If this mass is low (i.e. the dust-to-gas mass ratio ≪0.01) particles’ self-gravity has no significant effects on the evolution of either the gas or solid component of the disc. For more canonical dust-to-gas mass ratios (∼0.01), particle self-gravity causes the particle aggregates, which are trapped in the crests of spiral density waves, to contract further. If such particle concentrations reach high enough densities, gravitational interactions among particles inside become sufficiently large to cause local collapse of the solid component of the disc, leading to the formation of gravitationally bound structures within the disc. This picture, obtained within the local shearing sheet approach permitting higher numerical resolution, is consistent with the results of analogous global simulations by Rice et al. (2006) of particle dynamics in self-gravitating discs which also take into account self-gravity of dust component. Assuming typical disc parameters, however, predicts masses for these structures to be comparable to those of very large planetesimals, with the most massive structures identified, comparable to the mass of large asteroids and dwarf planets, potentially providing seed objects for the growth of terrestrial planets and the cores of gas giant planets as outlined in the calculations of Pollack et al. (1996). These structures are robust enough to survive in the disc, even after the ‘parent’ spiral density wave in which they formed has been sheared out and the remainder of the solid particles have diffused back into the disc. Interestingly, the physical mass of these structures is only weakly related to the cooling time of the disc. Although at short cooling times particles get trapped within density waves more efficiently, resulting in structures forming faster and usually accounting for a larger fraction of the particles, for a given disc, the lower surface density of material present at the larger radii associated with these shorter cooling times tends to offset this. This suggests that density waves arising from gravitational instabilities in the gas are able to produce large-scale planetesimals, even if the effects of self-gravity in the gas is relatively weak. Determination of the full extent of the region where this mechanism can operate is beyond the scope of the present simulations, since to probe inner radii down to about 10 au, where effective (radiative) cooling times are long but at the same time Toomre's parameter is Q ∼ 1, i.e. the effect of gas self-gravity can still be appreciable (e.g. Boley et al. 2006; Rice & Armitage 2009; Cossins, Lodato & Clarke 2010), long simulation times are required, which are not feasible for the simulations posed here. For such large cooling times, numerical viscosity will begin to dominate the shear stresses, requiring us to perform higher resolution studies.
In summary, the presented results tend to support and expand upon those obtained in Rice et al. (2006) and Paper I, suggesting an attractive scenario for the rapid creation of a reservoir of planetesimals, along with several very massive objects with ∼0.01 M⊕. One of the main findings of this study has been to demonstrate the possibility for this mechanism to form planetesimals at a larger range of radii than previously thought (see e.g. Clarke & Lodato 2009). This process potentially solves a major problem in the standard planet formation scenario. Rather than rapidly migrating into the central star, centimetre- to metre-sized particles become concentrated in self-gravitating spiral structures. The densities achieved can then lead to planetesimal formation via direct gravitational collapse of the particle aggregates. In this scenario, kilometre-sized planetesimals form very early, removing a major bottleneck in the planet formation process. However, for a fuller understanding of the role of this scenario in the planet formation, one should study the process of subsequent growth and interaction of these planetesimals, which then decouple from the gas and should be dominated by their own gravitational attraction.
In this paper, we investigated the dynamics of gas and dust particles in an idealized razor thin disc, so the limitations of such a 2D model and its extension to the three-dimensional (3D) case should be discussed. For the gaseous component, the description of gravitational instabilities within the 2D shearing sheet model is acceptable (see e.g. Goldreich & Tremaine 1978; Gammie 2001), since the characteristic horizontal length scale of the instability and induced structures (density waves) is larger than the vertical one (Goldreich & Lynden-Bell 1965; Romeo 1992; Mamatsashvili & Rice 2010; Shi & Chiang 2013). As a result, the gas motion associated with self-gravitating density waves occurs primarily in disc plane. The situation is more complicated with dust particles, since in the 2D case we cannot take into account their motions perpendicular to the disc mid-plane, or sedimentation, which depends on the particle size – smaller particles are well mixed with the gas, essentially do not sediment and closely follow the gas, whereas particles with larger (from centimetre to metre) size gradually settle towards the disc mid-plane on a time-scale of a few orbital times (Goldreich & Ward 1973). This implies that the back-reaction drag force from the particles on the gas, which we calculated in terms of the ratio of the vertically integrated surface densities of the particles and gas, Σp/Σ, in equation (2), is strictly speaking valid if particles are well mixed with the gas. For larger particles, as they settle into the mid-plane, the ratio of the bulk density of particles to the volume gas density, ρp/ρ, there is expected to be larger than the ratio of the corresponding surface densities, Σp/Σ, and since in 2D particles and the gas have the same infinitely thin scale height, this causes the back-reaction of the drag force from the particles on the gas to be underestimated in the 2D case (Youdin & Goodman 2005; Lyra et al. 2008b, 2009). In the 3D case, the stronger back-reaction force on the gas from the settled dust particles close to the mid-plane is known to lead to streaming (Youdin & Goodman 2005; Youdin & Johansen 2007) and Kelvin–Helmholtz (Sekiya 1998; Youdin & Shu 2002; Johansen et al. 2006) instabilities. The streaming instability enhances particle clumping, thus aiding collapse (Johansen & Youdin 2007), while the Kelvin–Helmholtz instability causes vertical stirring of the dust layer (e.g. Johansen et al. 2006). To study in detail these 3D effects related to particle dynamics in the presence of gas and particle self-gravity and how they compete with the process of particle trapping in density waves, one has to carry out more extensive simulations in the 3D stratified shearing box. In the present local analysis, following analogous 2D global simulations of particle–gas dynamics by Lyra et al. (2008b, 2009), we have restricted ourselves to expressing the back-reaction drag force by the particle and gas column densities. Evidently, this is a simplification and meant as an initial step towards understanding all the above complex ingredients of particle dynamics in self-gravitating discs. Nevertheless, such a 2D approach allows us to gain insight into the characteristics of particle accumulation in overdense structures due to self-gravity.
In regard to the above mentioned, a question may arise as to whether there is still a way to incorporate sedimentation of the particles in the 2D model of gas–dust coupling. When the particles sediment, the particle scale height is set by the balance between turbulent stirring (diffusion) and vertical gravity (e.g. Johansen & Klahr 2005; Fromang & Papaloizou 2006). Being controlled by the drag force, the turbulent diffusion and therefore the equilibrium scale height of solids Hp depend on the particle radius (friction time). As a consequence, larger particles settle into thinner layers than smaller ones (obviously particle scale heights are different from that of gas). Inside density waves, where, as mentioned above, motion is horizontal, vertical turbulent motions are expected to be weaker bringing the layer of solids closer to a 2D quasi-static configuration, but a dependence on particle size is still expected. Provided these scale heights of solids are known, one could, in principle, find particle surface density as Σp ≈ 2ρpHp and similarly for the gas Σ ≈ 2ρH and in this way relate the ratios of dust to gas volume and surface densities, Σp/Σ ≈ (Hp/H)(ρp/ρ). However, in the 2D case, Hp remains largely uncertain, as it depends on the vertical stirring properties of gravitoturbulence (and other above-mentioned instabilities which will develop in 3D) and should be self-consistently determined through 3D analysis.
This work made use of the facilities of HECToR, the UK's national high-performance computing service, which is provided by UoE HPCx Ltd at the University of Edinburgh, Cray Inc. and NAG Ltd, and funded by the Office of Science and Technology through EPSRCs High End Computing Programme. GRM acknowledges financial support from the Rustaveli National Science Foundation (Georgia). WKMR acknowledges support form STFC grant ST/J001422/1.
This friction time, at which particle concentration in density waves is most efficient, corresponds to particle sizes 3–10 cm in the radial range 20–60 au where the disc resides in the quasi-steady self-gravitating state with Q ∼ 1 (see Clarke 2009; Rice & Armitage 2009; Paper I). For comparison, in Rice et al. (2006), where the disc is confined to a maximum radius 25 au, the optimally trapping friction time τf ∼ 1.0 Ω−1 corresponds to metre-sized particles.
