-
PDF
- Split View
-
Views
-
Cite
Cite
B. Stelzer, A. Marino, G. Micela, J. López-Santiago, C. Liefke, Erratum: The UV and X-ray activity of the M dwarfs within 10 pc of the Sun, Monthly Notices of the Royal Astronomical Society, Volume 442, Issue 1, 21 July 2014, Pages 343–346, https://doi.org/10.1093/mnras/stu817
Close - Share Icon Share
1 CORRECTION OF ULTRAVIOLET FLUXES
The paper entitled ‘The UV and X-ray activity of the M dwarfs within 10 pc of the Sun’ was published in MNRAS, 431, 2063 (2013). By mistake the Galaxy Evolution Explorer (GALEX) bandwidths for the FUV and NUV filters, used for the calculation of ultraviolet fluxes, have been interchanged for the 10-pc sample. Formally, this means an error in the zero-points. This affects several figures (Figs 8–12, 14 and 15), the tables with results of regression fits and saturation levels (Tables 3 and 4), and the table with the measured fluxes (Table 2). Figs 5–7, and 13 that also include results on UV data are unchanged. These figures either were produced with a different macro where the mistake in bandwidth was not made or they show magnitudes or flux densities but not fluxes. Despite the quantitatively different UV fluxes, the majority of our conclusions have remained unchanged. We describe here in detail which of the results obtained in our paper are modified after the correction of the FUV and NUV fluxes. We present all updated tables and new figures. In Figs 9–11, the correction results only in shifts. These figures are not reproduced here but the changes are summarized in the text.
Observed NUV, FUV and X-ray fluxes for 10-pc sample. NUV fluxes have been corrected upwards and FUV fluxes downwards according to the error that was introduced by having exchanged the NUV and FUV bandwidths. Flux units are erg cm−2 s−1. Lower and upper values for the fluxes derived from the uncertainties are given in brackets. Full table is available online as Supporting Information.
| Name . | . | log fNUV . | log fNUV, lo, fNUV, up . | . | log fFUV . | log fFUV, lo, fFUV, up . | . | log fX . | log fX, lo, fX, up . |
|---|---|---|---|---|---|---|---|---|---|
| PM I00054−3721 | −12.70 | [−12.74, −12.66] | < | −14.20 | −13.01 | [−13.07, −12.96] | |||
| PM I00115+5908 | < | −13.20 | |||||||
| PM I00154−1608 | −13.71 | [−13.93, −13.49] | < | −14.15 | −13.41 | [−13.58, −13.29] | |||
| PM I00184+4401 | −11.89 | [−11.94, −11.85] | |||||||
| PM I01025+7140 | −12.54 | [−12.58, −12.49] | −13.65 | [−13.92, −13.39] | −13.19 | [−13.43, −13.03] | |||
| PM I01026+6220 | < | −13.27 | |||||||
| PM I01103−6726 | −12.54 | [−12.58, −12.50] | −13.65 | [−13.87, −13.43] | < | −12.87 | |||
| PM I01125−1659 | −12.66 | [−12.71, −12.62] | −13.14 | [−13.24, −13.04] | −12.41 | [−12.45, −12.36] |
As specified in the original paper the FUV and NUV magnitudes were converted to fluxes with the transformation relations presented by Bianchi (2009) and the effective filter bandwidths, δλFUV = 268 Å and δλNUV = 732 Å. Our accidental use of the FUV bandwidth for the NUV data and vice versa had led to an overestimation of the FUV fluxes and an underestimation of the NUV fluxes for the 10-pc sample. The luminosities and activity indices derived from the fluxes were incorrect in an analogous way. The fluxes of the comparison sample in the TW Hya association (TWA) were not affected by this mistake.
The corrected FUV and NUV fluxes for the 10-pc sample together with the unmodified X-ray fluxes are presented here in the new version of Table 2.
2 CHARACTERISTICS OF ACTIVITY ON M DWARFS
2.1 High-energy spectral energy distributions
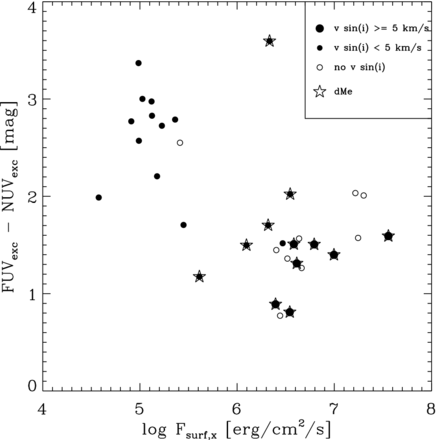
After the correction of the fluxes, the distribution of the UV colour, (FUV − NUV)exc, is shifted to higher values. The new version of Fig. 8 shows that in absolute terms the NUV emission is for all stars of the 10-pc sample stronger than the FUV emission. The dependence of UV excess on other activity signatures has remained qualitatively unchanged, i.e. relatively lower, ‘bluer’ values of (FUV − NUV)exc are found for strong X-ray emitters, fast rotators and Hα active stars. Our suggestion that higher (X-ray) activity goes along with an enhancement of emission in the transition region, therefore, remains valid.

‘Colour’ representing FUV versus NUV excess in function of X-ray surface flux. Hα emitting stars (dMe) are highlighted. Fast and slow rotators and stars without information on v sin i are distinguished by different plotting symbols.
2.2 Relations between Hα, UV and X-ray emission
The new UV fluxes have required to recompute the power-law relations between surface fluxes, activity indices and luminosities involving one or both of the UV bands.
The coefficients of the corresponding log–log relations are given in the new Table 3. The correction does not affect the slope of the correlations. It applies only a shift that changes coefficient c1 in Table 3. Similarly, the axis of the corresponding figure (Fig. 9) are shifted but not qualitatively changed. This figure is not displayed here. As previously, upper limits are not considered in the regression fits. The pair of activity diagnostics with the smallest spread continues to be FUV versus NUV. In the original paper, we have mentioned that the interpretation by an influence of variability on relations involving non-simultaneous observations is not favoured by our comparison of multi-epoch data for a subsample of the 10-pc sample. To this argument, we can add that the GALEX fluxes are now in much better agreement with published Hubble Space Telescope (HST) fluxes (see Section 2.4).
Coefficients of double-logarithmic relations for three different measures for activity (surface flux, activity index and luminosity) and four energy bands (Hα, NUV, FUV and X-rays). The results for X-ray versus Hα emission are unchanged and are reproduced here to facilitate the comparison with the relations involving the UV bands.
| Line 1 . | Line 2 . | N* . | c1 . | c2 . |
|---|---|---|---|---|
| Surface flux | ||||
| X | Hα | 24 | −4.29 ± 1.77 | 1.89 ± 0.31 |
| FUV | X | 36 | −0.59 ± 0.43 | 0.93 ± 0.07 |
| NUV | X | 46 | 0.80 ± 0.36 | 0.83 ± 0.06 |
| NUV | FUV | 46 | 1.93 ± 0.24 | 0.77 ± 0.04 |
| Activity index | ||||
| X | Hα | 24 | 4.43 ± 1.23 | 1.90 ± 0.31 |
| FUV | X | 36 | −1.22 ± 0.21 | 0.94 ± 0.06 |
| NUV | X | 46 | −0.95 ± 0.19 | 0.81 ± 0.05 |
| NUV | FUV | 46 | −0.36 ± 0.18 | 0.76 ± 0.04 |
| Luminosity | ||||
| X | Hα | 24 | −15.71 ± 6.27 | 1.61 ± 0.23 |
| FUV | X | 36 | 0.67 ± 2.26 | 0.94 ± 0.08 |
| NUV | X | 46 | 1.36 ± 1.70 | 0.94 ± 0.06 |
| NUV | FUV | 46 | 3.41 ± 1.32 | 0.90 ± 0.05 |
The representation of the flux–flux relationships that distinguishes between Hα emitters (dMe stars) and stars with upper limit to the Hα flux (dM stars) is qualitatively unchanged (Fig. 10, not shown here). Analogous to Fig. 9, only a shift of the axes is introduced.
2.3 Activity indices versus spectral type and rotation rate
The correction of the fluxes results in a vertical shift of the activity indices for the FUV and the NUV bands in Fig. 11 (not shown here) and a change in the saturated activity levels for the UV bands. The mean level of all activity indices in the presumed saturated regime, as in the original paper computed for stars with v sin i ≥ 5 km s−1, are given in Table 4 together with their standard deviations. The X-ray and Hα activity indices are unaffected and are reproduced here to allow for a direct comparison with the UV activity indices. The systematic trend of increasing mean activity level with increasing atmospheric height (Hα, NUV, FUV, X-rays) is not present any more. The FUV emission is comparable to the Hα emission level and, as already pointed out in Section 2.1 for a given star the NUV emission is stronger than the FUV emission. As before, the X-ray saturation level is the largest of all examined activity diagnostics.
Average emission level in the activity indices for fast rotating M dwarfs (v sin i ≥ 5 km s−1), standard deviation, and number of stars.
| Act. index . | Mean . | Std.dev . | N* . |
|---|---|---|---|
| log RX | −3.18 | 0.57 | 15 |
| |$\log {R^\prime _{\rm FUV}}$| | −3.96 | 0.59 | 10 |
| |$\log {R^\prime _{\rm NUV}}$| | −3.38 | 0.54 | 10 |
| log RHα | −4.04 | 0.40 | 15 |
| Act. index . | Mean . | Std.dev . | N* . |
|---|---|---|---|
| log RX | −3.18 | 0.57 | 15 |
| |$\log {R^\prime _{\rm FUV}}$| | −3.96 | 0.59 | 10 |
| |$\log {R^\prime _{\rm NUV}}$| | −3.38 | 0.54 | 10 |
| log RHα | −4.04 | 0.40 | 15 |
2.4 Comparison with published UV data of M dwarfs
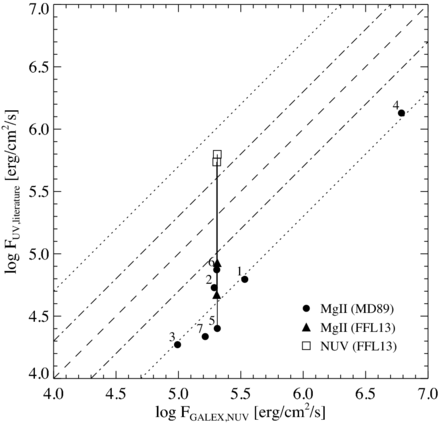
The correction of our FUV and NUV fluxes has a significant impact on the comparison with FUV and NUV measurements from the literature (see updated Fig. 12). The two available NUV fluxes from HST STIS are now in much better agreement with our GALEX measurements for the same stars, the difference being little more than a factor of 2 with respect to the nearly 1 dex difference we had deduced before. The Mg ii fluxes represent only a minor contribution (about 1/5) of the total NUV flux as evident from the new Fig. 12.

Flux–flux relation for NUV measurements from the literature and GALEX/NUV broad-band. The literature data comprise Mg iiλ 2800 Å line emission published by Mathioudakis & Doyle (1989, MD89; circles) and by France et al. (2013, FFL13; triangles) and broad-band emission in 1150-1790 Å excluding Lyα (FFL13). The Mg iiλ 2800 Å data points from MD89 are labelled with numbers corresponding to the following stars: 1 – Gl 83.1, 2 – Gl 411, 3 – Gl 412 A, 4 – Gl 803, 5 – Gl 832, 6 – Gl 876, 7 – Gl 908. Two of them (Gl 832 and Gl 876) have data from FFL13. All literature data for these two stars are connected with a vertical line. The dashed line denotes the 1:1 relation, the dash–dotted lines a factor 2 and the dotted lines a factor 5 difference between the two measurements.
The differences of the GALEX/FUV band with C iv fluxes as well as with the broad-band FUV emission observed with HST COS persist for the two stars in common with the study of France et al. (2013). These discrepancies are much larger than the change of the GALEX/FUV fluxes due to the correction.
2.5 Age evolution
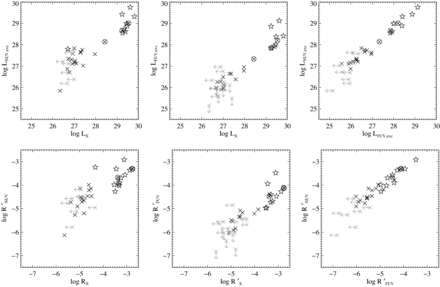
In our original paper, the mistake in the GALEX band width regards only the 10-pc sample not the stars in the TWA. The connection between these two samples in terms of luminosities and activity indices is even more pronounced after we corrected the GALEX fluxes of the 10-pc sample (see new Fig. 14). In particular, the three most active stars that we had identified in the 10-pc sample (AU Mic, FK Aqr and Gl 569 AB; highlighted by circles in Fig. 14) are now directly interspersed with the data points of TWA members bolstering our conclusion that these are young and/or extremely active stars.

X-ray versus UV luminosity and activity index for M0–M3 stars from the 10-pc sample (crosses) and stars in the same spectral type range in TWA (star symbols). The three young stars AU Mic, FK Aqr and Gl 569 AB in the 10-pc sample are highlighted with annuli surrounding the plotting symbol. Upper limits are shown in grey.
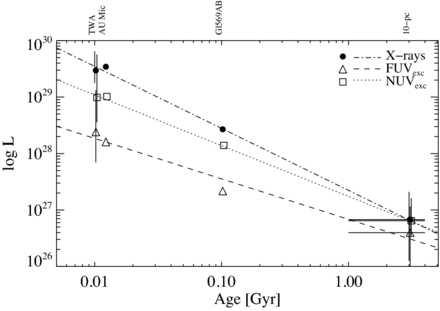
We recomputed the power-law slopes of the linear regression fits for the age dependence of the FUV and NUV luminosities, displayed in a new version of Fig. 15. The slope in the FUV results slightly shallower than stated before, βFUV = −0.72 ± 0.05 while in the NUV it is slightly steeper than before, βNUV = −0.90 ± 0.01. The slope in X-ray luminosities, for comparison, is βX = −1.10 ± 0.02. As before, the young M dwarf in the 10-pc sample, Gl 569 AB, is intermediate in both age and activity level between the ∼10 Myr-old TWA objects and the Gyr-old bulk of the 10-pc sample, indicating that the decrease of activity with age is a continuous process.

Age evolution of UV and X-ray luminosity for M0–M3 stars from the TWA and the 10-pc sample. The lines represent regression fits to the three activity diagnostics.
3 CONCLUSIONS
After the correction of the UV fluxes the excess flux is larger in the NUV than in the FUV for all stars in the 10-pc sample. Moreover, our conclusion that the saturation level of the activity index increases systematically for shorter wavelength emission cannot be retained. The FUV and NUV saturation levels are – as in the original paper – between those of Hα (the faintest level) and X-rays (the highest level). However, the FUV saturation is fainter than the NUV saturation.
In the comparison with UV measurements from the literature, there is now much better agreement between GALEX and HST NUV fluxes, albeit large discrepancies remain between the FUV fluxes obtained with the two satellites. We recall that this comparison regards only two stars and may well be affected by variability. The comparison of GALEX/NUV fluxes with Mg ii measurements available for seven stars of the 10-pc sample suggests that this line contributes only ≈20 per cent to the total NUV emission of M stars.
Finally, the correlations between pairs of luminosities and activity indices with inclusion of the TWA sample, evident already in the original paper, are now improved. Especially, the FUV and NUV luminosities and activity indices of the 10-pc sample form now a straight line together with analogous measurements in the TWA, and the three young stars in the 10-pc sample line up directly with the TWA sample while in the original paper they were slightly offset.
We thank Evgenya Shkolnik who has noticed the error.
REFERENCES
SUPPORTING INFORMATION
Additional Supporting Information may be found in the online version of this article:
Table 2. Observed NUV, FUV and X-ray fluxes for 10-pc sample (Supplementary Data).
Please note: Oxford University Press is not responsible for the content or functionality of any supporting materials supplied by the authors. Any queries (other than missing material) should be directed to the corresponding author for the paper.


