-
PDF
- Split View
-
Views
-
Cite
Cite
James R. A. Davenport, Željko Ivezić, Andrew C. Becker, John J. Ruan, Nicholas M. Hunt-Walker, Kevin R. Covey, Alexia R. Lewis, Yusra AlSayyad, Lauren M. Anderson, The SDSS–2MASS–WISE 10-dimensional stellar colour locus, Monthly Notices of the Royal Astronomical Society, Volume 440, Issue 4, 1 June 2014, Pages 3430–3438, https://doi.org/10.1093/mnras/stu466
Close - Share Icon Share
Abstract
We present the fiducial main-sequence stellar locus traced by 10 photometric colours observed by Sloan Digital Sky Survey (SDSS), Two Micron All Sky Survey (2MASS), and Wide-field Infrared Survey Explorer (WISE). Median colours are determined using 1052 793 stars with r-band extinction less than 0.125. We use this locus to measure the dust extinction curve relative to the r band, which is consistent with previous measurements in the SDSS and 2MASS bands. The WISE band extinction coefficients are larger than predicted by standard extinction models. Using 13 lines of sight, we find variations in the extinction curve in H, Ks, and WISE bandpasses. Relative extinction decreases towards Galactic anticentre, in agreement with prior studies. Relative extinction increases with Galactic latitude, in contrast to previous observations. This indicates a universal mid-IR extinction law does not exist due to variations in dust grain size and chemistry with Galactocentric position. A preliminary search for outliers due to warm circumstellar dust is also presented, using stars with high signal-to-noise ratio in the W3 band. We find 199 such outliers, identified by excess emission in Ks − W3. Inspection of SDSS images for these outliers reveals a large number of contaminants due to nearby galaxies. Six sources appear to be genuine dust candidates, yielding a fraction of systems with infrared excess of 0.12 ± 0.05 per cent.
1 INTRODUCTION
The Two Micron All Sky Survey (2MASS; Skrutskie et al. 2006) and Sloan Digital Sky Survey (SDSS; York et al. 2000) have provided revolutionary improvements in our understanding of the stellar populations within our Galaxy at near-infrared (NIR) and optical wavelengths, respectively. For example, Milky Way halo substructures have been discovered in both SDSS and 2MASS photometry (Ibata et al. 2001, 2002). Normal stars have been separated from more exotic objects with much greater accuracy by matching sources between these surveys (Finlator et al. 2000). This wide-field data set has continued to set the standard for multiwavelength studies, enabling science not possible with either survey individually, and providing astrometric and flux standards to calibrate future surveys.
Covey et al. (2007, hereafter C07) used a sample of ∼600 000 stars matched between SDSS and 2MASS to measure the fiducial stellar colour locus in ugrizJHKs passbands as a function of g − i colour. This parametrization provides colours of main-sequence stars as a function of their effective temperature. The C07 main-sequence locus has been used to search for colour outliers due to being, for example, white dwarf binaries, quasars, or post-main-sequence stars. The C07 locus has also provided a robust method to identify and classify normal stars given any combination of SDSS and 2MASS colours.
TheWide-field Infrared Survey Explorer (WISE; Wright et al. 2010) has produced a modern census of the entire sky with unprecedented accuracy and depth in four bandpasses, ranging from 3.4 to 22 |$\mu$|m. Combining this survey with the well-studied SDSS and 2MASS data sets will enable the discovery of new classes of both Galactic and extra-Galactic objects. Furthermore, this will provide improved understanding of the cool solar neighbourhood, young stellar populations, dust content, and substructure within our Galaxy. Already, WISE and SDSS data have been used to survey infrared excesses around white dwarfs (Debes et al. 2011) and to discover many new brown dwarf candidates (Aberasturi, Solano & Martín 2011). The first confirmed Y0 dwarf (Cushing et al. 2011) has also been discovered with WISE, probing the stellar mass function at its lowest extrema for the first time. WISE photometry will also provide the best data set for mapping asymptotic giant branch, with the ability to trace them to well beyond the Galactic centre (Hunt-Walker, in preparation). All of these studies will critically depend on the proper understanding of photometric behaviour for ‘normal’ stars simultaneously in all 10 colours, as was done with the seven colours from SDSS and 2MASS in C07.
In this paper, we present the first detailed study of the stellar locus for nearby stars as observed by 2MASS, SDSS, and WISE. In Section 2, we describe the creation of a matched sample of low-extinction point sources. A detailed measurement of the stellar locus is given in Section 3. Using this fiducial stellar colour sequence as a set of ‘standard crayons’ (termed by Peek & Graves 2010), we measure the relative dust extinction coefficients from the u band to 22|$\,\mu$|m in Section 4. We search for warm dust discs from WISE colour outliers in Section 5. A summary of our work is given in Section 6.
2 DATA
Our data come from three surveys that differ greatly in their sky coverage, photometric depth, and wavelength coverage. In the following section, we briefly describe each of the three photometric surveys, as well as the quality cuts, selection criteria, and matching used to produce a clean sample of nearby stars to use in measuring the fiducial stellar locus.
2.1 SDSS photometry
The optical photometry for our study came from the SDSS Data Release 8 (DR8; Aihara et al. 2011). This survey contiguously mapped over 14 000 deg2 of the northern and southern Galactic caps, with small extensions of the footprint through the Galactic plane. The drift-scanning technique used by the SDSS camera produced nearly simultaneous 54 s exposures in five optical filters (u, g, r, i, |$z$|), spanning wavelengths from 0.36 to 0.90 |$\mu$|m (Fukugita et al. 1996). The DR8 photometry has a nominal calibration precision of 1 per cent for griz bands, and 2 per cent for the u band.
We used the value-added tables of SDSS DR8 data provided from Berry et al. (2012), which included an independent extinction measurement for each source using SDSS and 2MASS photometry. We selected only photometric objects with the object flag set to Objc_Type = 6, which corresponds to objects the SDSS pipeline determined to be unresolved point sources (dominated by stars and quasars). The error rate of this morphological classification is below 5 per cent at r = 21 (Lupton et al. 2001). We used standard SDSS flag cuts to select high-quality point sources, including BINNED1 = 1, BRIGHT = 0, SATURATED = 0, EDGE = 0, BLENDED = 0, and NOPROFILE = 0.
We required each object to have 13.8 < r < 21.5. To remove the majority of quasars and white dwarfs from our sample we selected objects with u − g > 0.6. Following C07, to select main-sequence stars, we choose objects within the range −0.1 < g − i < 5.
Since interstellar dust causes wavelength-dependent extinction and reddening, we selected objects with very low extinction Ar ≤ 0.125, as provided by both the DR8 data base and Berry et al. (2012). The DR8 data base extinction estimates are derived from the dust maps by Schlegel, Finkbeiner & Davis (1998), and were verified as accurate for low-extinction regions in the SDSS by Schlafly & Finkbeiner (2011) and Berry et al. (2012). This criterion was more strict than the Ar ≤ 0.2 used by C07, and ensured a sample of stars where effects of extinction errors would be much smaller than the intrinsic scatter in the locus.
2.2 2MASS and WISE photometry
The mid-infrared photometry we used came from the latest AllWISE data release. Simultaneous photometry was provided in four filters, with central wavelengths of 3.4, 4.6, 12, and 22 |$\mu$|m. Astrometric calibration for WISE was achieved by matching sources to the full-sky 2MASS point source catalog (Wright et al. 2010). As a result, the WISE data base provides 2MASS JHKS photometry for every source that had a match between these surveys. An independent cross-match between these two surveys was therefore not necessary.
We required every source to have a detection in the J band and W1 band, and selected point sources with W1 < 13.6 mag to remove objects fainter than the WISE completeness limit. Photometric uncertainty requirements of σW1 < 0.05 mag, σW2 < 0.1 mag, and σW3 < 0.2 mag were also imposed to ensure 5σ detections in WISE bands. Spurious detections of sources were removed by requiring each band to have a photometric error >0. A rough method to remove nearby giant stars from the sample was used by selecting sources with J > 12 (Covey et al. 2008).
2.3 Matched sample
The AllWISE data covered the entire SDSS DR8 footprint, including the low Galactic latitude stripes. We positionally matched these two data bases using a radius of 2.0 arcsec. This retrieved 9.9× 10⁶ unique objects with a detection in SDSS and at least a 5σ detection in the W1 and W2 bands.
Imposing the SDSS quality cuts, as well as selecting sources with Ar < 0.125, yielded 5.4 × 10⁶ matched sources. The final sample used to measure the stellar locus, after all quality and selection cuts in both optical and infrared bands, and removing sources with low Galactic latitude |b| < 10, contained 1052 793 stars. The sky distribution of this matched sample is shown in Fig. 1. For measurements in the W3, we placed additional constraint on the sample, requiring W3 < 11.5 and W3 PH_QUAL = A or B This produced a W3 sample of only 7430 stars. For the W4 band, no stars were able to pass the requirement of W4 PH_QUAL = A or B. As a result, we cannot trace the detailed stellar locus in W4 with this sample.
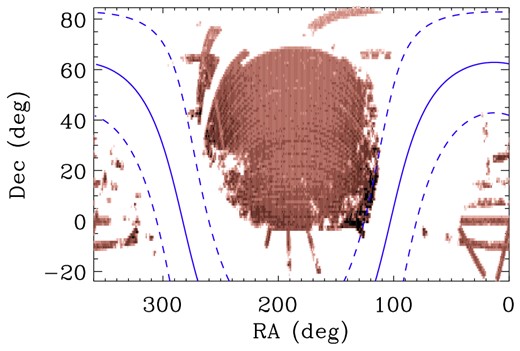
Map of the final 1052 793 source sample matched between the three surveys. A pixel size of 1 deg2 was used, with number density of sources increasing from light to dark. Also shown is the b = 0 Galactic equator (blue solid line) and b = ±10° (blue dashed lines).
The SDSS DR8 data were calibrated to the AB photometric system (Oke & Gunn 1983), while the WISE and 2MASS data have been calibrated to the Vega system (Cohen et al. 1992; Cohen, Wheaton & Megeath 2003). As in C07, we have used the data from each survey in its native magnitude system, mixing AB and Vega magnitudes.
In Fig. 2, we show a subset of the colour–magnitude and colour–colour diagrams for our matched sample in the SDSS and 2MASS bands. The (g − i, u − g) diagram can be used to identify many types of stars, binaries, and white dwarfs, as well as contaminants from quasars (e.g. Ivezić et al. 2007). The position along the narrow locus in the (i − J, g − i) diagram of Fig. 2 is parametrized by effective temperature over a wide range of stellar mass, as shown by Bochanski et al. (2007) and West et al. (2011) for red stars, and Ivezić et al. (2008) for blue stars. The SDSS (g − i, g) colour–magnitude diagram in Fig. 2 reveals that our sample is almost entirely composed of stars from the Galactic thin disc at distances ≲1 kpc (Ivezić et al. 2008).
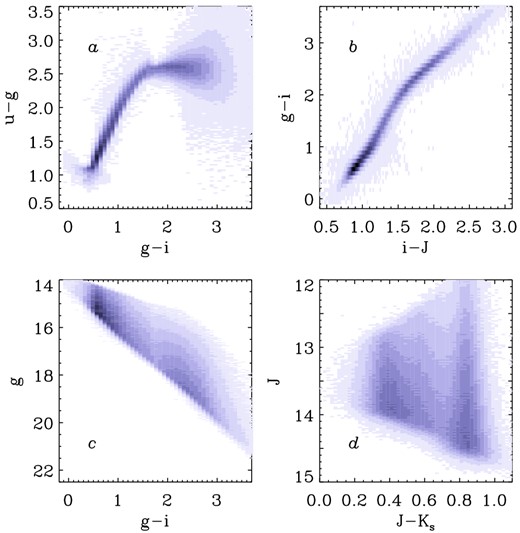
Color versus apparent magnitude and colour versus colour plots for the SDSS passbands of our low-extinction matched sample. Pixel intensity from light to dark represents an exponentially increasing density of stars.
3 THE 10-DIMENSIONAL LOCUS
Using the 11 passband sample defined above, we measured the median colours of stars in all 10 adjacent photometric colours. As this sample was selected on the basis of low extinction, we did not apply reddening corrections. C07 showed that for main-sequence stars the g − i colour traced effective temperatures 3540 K |$<T_{{\rm eff}} <$| 7200 K. We measured the colour locus in each of the filter combinations (u − g, g − r, r − i, i − |$z$|, |$z$| − J, J − H, H − Ks, Ks − W1, W1 − W2, W2 − W3) as a function of their g − i colour.
Fig. 3 shows a subset of our measured median colour locus. Following C07, the locus was defined in small δ(g − i) steps. Because our sample selection placed strong limitations on both extremely blue and red objects, the bin size was increased near both ends of the locus to increase the numbers of stars per bin. A bin size of δ(g − i) = 0.02 mag was used from 0.4 < g − i < 2.7, and was increased to δ(g − i) = 0.04 mag from 2.7 < g − i < 3.1, and then further increased at both the red and blue limits. The median and standard deviation of all 10 colours was computed within each δ(g − i) bin, tracing out the stellar locus (and its width) in the adjacent colours. These measurements, along with the number of stars for each δ(g − i) bin, are given in Table 1 for SDSS bands, and Table 2 for 2MASS and WISE bands. There was an average of 2000 stars per colour bin, which is sufficient for statistical errors to be negligible compared to the systematic photometric uncertainties. However, we did not have a sufficient number of blue stars that passed our W3-specific selection criteria. As a result, we only provide the W2 − W3 locus for red stars with g − i > 1.4. To smooth out non-physical variations in the locus due to small sample sizes we applied a boxcar smoothing kernel to the W2 − W3 locus, using a kernel width of g − i = 0.1. Excellent agreement with the C07 measurement is found for the SDSS and 2MASS colours, with a median difference between the two loci of 0.015 mag.
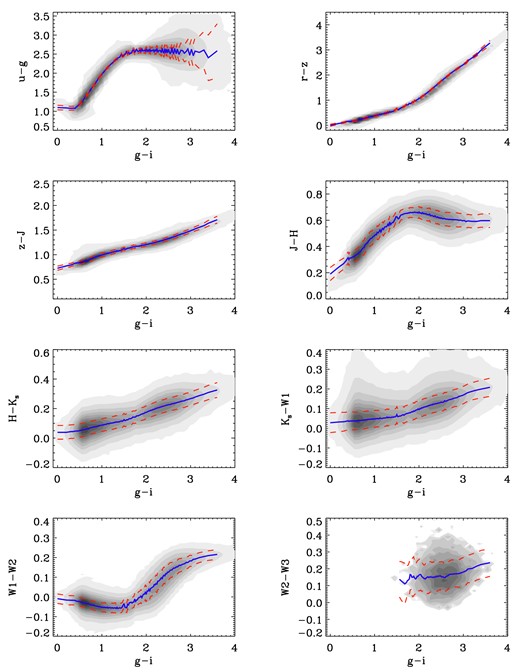
Subsets of the median 10D colour locus (blue line) as a function of g − i colour. The standard deviation measured in each g − i bin is also indicated (red dashed line). Shaded density pixels show our low-extinction matched sample, with source density increasing exponentially from light to dark.
The optical and NIR colour locus as a function of g − i colour bins. The number of stars in each bin is included (#). Values in parenthesis indicate the standard deviation of the locus in each colour. The entire table is available online in machine readable format.
| (g − i) . | (#) . | (u − g) . | (g − r) . | (r − i) . | (i − |$z$|) . | (|$z$| − J) . | (J − H) . | (H − Ks) . |
|---|---|---|---|---|---|---|---|---|
| 0.200 | 5708 | 1.087(0.032) | 0.268(0.029) | 0.082(0.021) | −0.007(0.018) | 0.772(0.034) | 0.245(0.041) | 0.039(0.045) |
| 0.300 | 4264 | 1.077(0.066) | 0.303(0.025) | 0.098(0.017) | 0.010(0.020) | 0.790(0.033) | 0.269(0.040) | 0.044(0.046) |
| 0.350 | 9259 | 1.082(0.052) | 0.327(0.026) | 0.118(0.022) | 0.018(0.021) | 0.807(0.034) | 0.289(0.042) | 0.044(0.046) |
| 0.400 | 15 934 | 1.075(0.042) | 0.374(0.031) | 0.132(0.021) | 0.031(0.019) | 0.829(0.036) | 0.314(0.043) | 0.048(0.046) |
| 0.420 | 2494 | 1.112(0.029) | 0.366(0.029) | 0.133(0.024) | 0.010(0.020) | 0.829(0.034) | 0.300(0.043) | 0.047(0.045) |
The mid-IR colour locus as a function of g − i colour. The number of stars in each bin from the primary sample is included (#), as well as the W3-limited subsample (#W3). Values in parenthesis indicate the standard deviation of the locus in each colour. The entire table is available online in machine readable format.
| (g − i) . | (#) . | (Ks − W1) . | (W1 − W2) . | (#W3) . | (W2 − W3) . |
|---|---|---|---|---|---|
| 0.20 | 5708 | 0.032(0.047) | −0.016(0.024) | 0 | …(…) |
| 0.30 | 4264 | 0.033(0.047) | −0.017(0.024) | 0 | …(…) |
| 0.35 | 9259 | 0.035(0.046) | −0.017(0.023) | 0 | …(…) |
| 0.40 | 15 934 | 0.038(0.047) | −0.018(0.023) | 0 | …(…) |
| 0.42 | 2494 | 0.035(0.045) | −0.021(0.022) | 0 | …(…) |
3.1 Locus width
The width of the stellar locus about the median track in Fig. 3 varies notably between panels. This is due to the different photometric errors in each bandpass. The increasing width of the u − g colour for low-mass stars (g − i > 2) for example is due to errors in the u-band measurement for these red objects. For the 2MASS and WISE colours, however, the locus width is consistent with scatter due to photometric errors. Dividing the locus standard deviation by the median photometric colour error in each (g − i) bin, we find that the weighted scatter in the locus ranges from values of ∼0.9 to ∼1.2, consistent with Poisson noise. Our results for the locus width also compare very favourably to C07. The median difference in the locus standard deviations for the SDSS and 2MASS colours between C07 and our study was 0.011 mag.
3.2 Comparison to previous loci
As mentioned above, we find a median difference of 0.015 mag between our locus values and that of C07, smaller than the g − i bin size used in either study. In Fig. 4, we compare our stellar locus to a previous determination of the colours of 825 nearby stars by Bilir et al. (2011). We used their equations 3 and 6, with the (g − r), (r − i), (J − H), and (H − Ks) values from our locus, to generate direct comparisons in the colour spaces they provide. We also show the 1 Gyr isochrone model, with metallicity of Z = 0.019, from Bressan et al. (2012). This isochrone model provides colours for main-sequence stars with masses in the range of 0.1 ≤ M⊙ ≤ 2.15. Our locus differs from both the Bilir et al. (2011) measurement and Bressan et al. (2012) isochrone track by less than 0.1 mag in g − W1 colour over the range 0.25 < g − i < 3. However, neither the Bilir et al. (2011) or Bressan et al. (2012) tracks accurately reproduce the J − W2 colour space shown in Fig. 4.
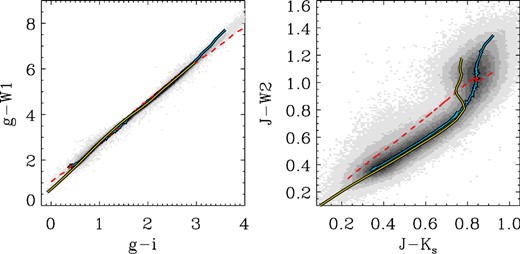
Comparison of our locus (blue line) to the Bilir et al. (2011) fits (red dashed line), using the colours provided in Bilir et al. (2011). We also show the Bressan et al. (2012) isochrone model (yellow line) using Z = 0.019 and t = 109 yr. Shaded pixels in the background show our low-extinction matched sample, with density increasing from light to dark.
4 EXTINCTION LAW
Infrared extinction coefficients (e.g. AW3) are expected to be smaller than those of optical bands (e.g. Ag) by an order of magnitude (Schlafly & Finkbeiner 2011). Bilir et al. (2011) generated extinction estimates for WISE passbands by interpolating Cardelli, Clayton & Mathis (1989) model values to the central wavelengths of the WISE filters. Recently, Berry et al. (2012) examined the extinction coefficients in SDSS and 2MASS filters by measuring the distortion of the stellar locus using photometry for 73 million stars in the SDSS footprint. They simultaneously determined optical and NIR extinction coefficients in each filter relative to the r band, showing a significant improvement on previous extinction estimates for stars at low Galactic latitude. By utilizing these reliable optical extinction values, and armed with our 10-dimensional colour locus, we have empirically determined the extinction coefficients in the WISE filters due to interstellar dust.
4.1 Optical–infrared extinction law
Using the full sky AllWISE data release matched to the Berry et al. (2012) SDSS DR8 with a radius ≤2.0 arcsec, we generated a high-quality matched sample to measure the 11-band relative dust extinction. We imposed the following selection cuts:
r < 20,
W1 − W2 < 0.8,
W1 < 15.8, W2 < 14.8, W3 < 10.5,
W2 − W3 ≤ 2.0,
w1snr & w2snr > 5,
w1sigmpro & w2sigmpro & w3sigmpro > 0,
which produced a sample of 7.8× 10⁶ stars. From this sample 502 378 objects had robust Ar measurements from Berry et al. (2012), with extinctions ranging within 0 ≤ Ar ≤ 3. These stars were spread across the SDSS footprint, including at low Galactic latitudes. For every star in this subsample, we used the Berry et al. (2012) dereddened g − i colour to find its intrinsic position along our 10D colour locus.
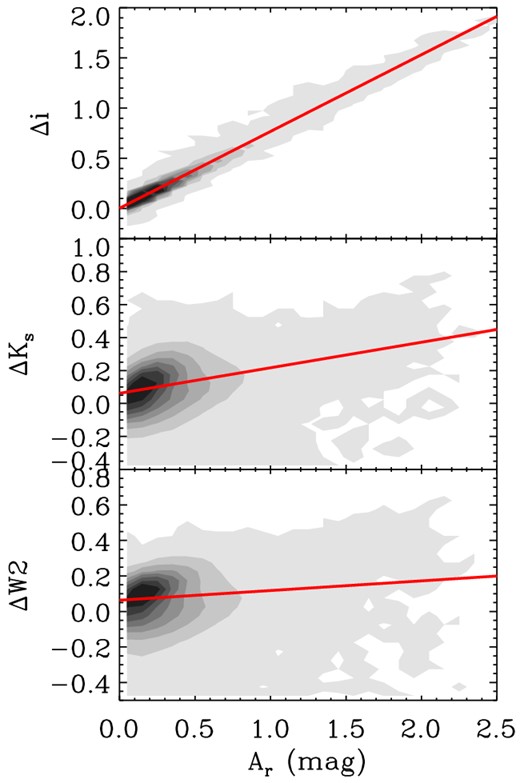
Three examples of our method for measuring the extinction. Background contour shade indicates density of sources. The slope of the resulting linear fit (red) is Aλ/Ar.
The Aλ(Ar) distributions were highly linear, with low numbers of stars showing scatter larger than the photometric errors. The slope of this linear distribution was the relative extinction coefficient in each band. This scatter accounted for less than 5 per cent of the sources in the subsample used, and is due to errors in the SDSS Ar values used, which propagate in to using the wrong location in the 10D locus, and possible unresolved binaries. We also implicitly assumed that the gri-band extinction must obey the RV ∼ 3.1 extinction law used in Berry et al. (2012) when we assigned the star a position in our 10D locus, which may have introduced small amounts of additional scatter.
A linear regression for each of the Aλ versus Ar distributions was computed, weighting each data point by the photometric error, using a Bayesian approach of sampling from the posterior distribution with the idl routine LINMIX_ERR (Kelly 2007). We used 5000 iterations with the Gibbs Markov Chain Monte Carlo (MCMC) sampler for each fit. The extinction coefficient was determined by taking the median value of the slope from the posterior distribution of the MCMC chain. The uncertainties we list were computed as the standard deviation of the extinction laws from the 14 individual lines of sight (LoS) described in the next subsection. This produced two to five times larger uncertainties than for any given extinction measurement in the infrared, and was chosen to incorporate the variations seen between different regions. These values are provided in Table 3 for each filter, and are shown in Fig. 6. The empirically measured extinction coefficients from Berry et al. (2012) match our measurements to within the uncertainties in every SDSS and 2MASS filter. The linear fits were not forced to go through the origin (Ar, Aλ) = (0, 0), as would be physically motivated. The best estimates from our MCMC chains were offset from the origin by less than 0.08 mag for all but the W3 band. This reddest band had the largest amount of scatter due to larger photometric uncertainties, as well as potentially blended point sources in the large W3-band aperture.
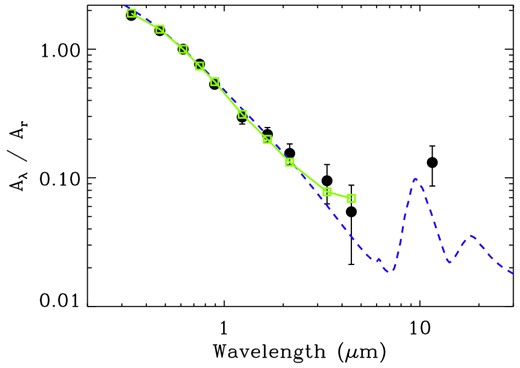
| Filter . | λ . | Aλ/Ar . | σ(Aλ/Ar) . |
|---|---|---|---|
| u | 0.335 |$\mu$|m | 1.83 | 0.02 |
| g | 0.469 |$\mu$|m | 1.39 | 0.01 |
| r | 0.617 |$\mu$|m | 1 | – |
| i | 0.748 |$\mu$|m | 0.76 | 0.01 |
| |$z$| | 0.893 |$\mu$|m | 0.53 | 0.02 |
| J | 1.24 |$\mu$|m | 0.30 | 0.03 |
| H | 1.66 |$\mu$|m | 0.21 | 0.03 |
| Ks | 2.16 |$\mu$|m | 0.15 | 0.03 |
| W1 | 3.35 |$\mu$|m | 0.09 | 0.03 |
| W2 | 4.46 |$\mu$|m | 0.05 | 0.04 |
| W3 | 11.6 |$\mu$|m | 0.13 | 0.05 |
4.2 Variations in extinction law
While extinction in blue optical and UV wavelengths has the largest amplitude changes from variations in RV and AV (Draine 2003), the mid-IR is also a fruitful regime in which to probe the underlying properties of interstellar dust (e.g. temperature, density, grain size distribution). Variations in UV and IR extinction properties have been found to be uncorrelated (Fitzpatrick & Massa 2007), indicating the lack of a ‘universal’ extinction law in the mid-IR. Flaherty et al. (2007) and Fitzpatrick & Massa (2007) have shown that mid-IR extinction can vary significantly between different LoS. Further, a dependence on Galactic latitude and longitude in the shape of the IR and mid-IR extinction law, due to the structure of the Milky Way's disc and spiral arms, has also been observed (Fitzpatrick & Massa 2009; Gao et al. 2009; Chen et al. 2013).
To highlight the utility of WISE photometry in addressing such studies, we have reproduced our extinction measurements for several individual LoS drawn from the 502k star matched sample. We selected 10 regions corresponding to individual low Galactic latitude stripes from Berry et al. (2012). These stripes were each vertical in Galactic latitude, spaced approximately evenly in Galactic longitude from l ∼ 50 to 230, and constrained to |b| < 25. Using our entire 502k star sample, we also selected three non-overlapping regions in Galactic latitude, ranging from the Galactic plane with several magnitudes of extinction to high-latitude regions with very little dust. These regions had limits of |b| < 25, 25 < |b| < 50, and 50 < |b| < 90, all with no limits on Galactic longitude. Due to smaller sample sizes, we were not able to reliably measure extinctions in the W3 band in each LoS.
We used the same Bayesian approach outlined in Section 4.1 to measure the relative extinction coefficients for all 10 bands in each unique region. In Fig. 7, we show the relative extinction coefficients for the LoS indicated by the figure legends. The error bars shown indicate the standard deviation about the median Aλ slopes from each 5000 iteration MCMC chain.
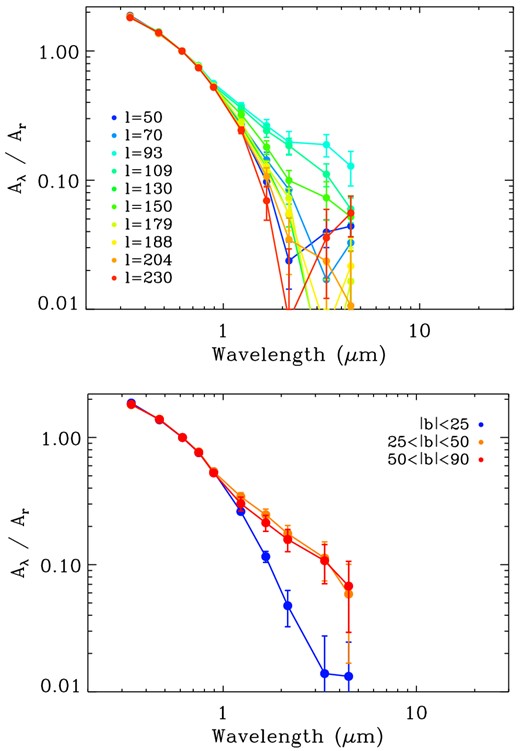
Top: relative extinction coefficients as a function of wavelength for 10 low Galactic latitude LoS. Each LoS was ∼3° wide in l, and limited by |b| < 25. The median Galactic longitude for each LoS is indicated in the legend. Bottom: relative extinction coefficients as a function of wavelength in four regions with Galactic longitude ranging within 0 ≤ l ≤ 360, and range of Galactic latitude indicated in the legend.
Significant variation in the shape of the extinction law for H, Ks, and WISE bandpasses was seen between different regions in both Galactic latitude and longitude in Fig. 7. In most of the regions, the deviation of the relative extinction law in the IR from that of the median values from Section 4.1 are all in the same direction. We emphasize that the dramatic changes in the extinction between each LoS primarily manifested themselves in the IR, while the optical bands remained consistent with RV ∼ 3.0 − 3.1 from Berry et al. (2012).
There is also correlation between Galactic position and the steepness of the extinction law. Fig. 8 shows the fractional extinction coefficients versus Galactic coordinates for three infrared bands. The trend with Galactic longitude was weaker. Gao et al. (2009) measured extinction variations with Galactic longitude in the infrared, indicating a correlation with spiral arm structure. Their overall trend of decreasing infrared extinction towards the Galactic anticentre matches our observation here. A strong coherent trend of increasing fractional infrared extinction with Galactic latitude was observed. Using a small sample of stars with a limited range in optical extinction, Larson & Whittet (2005) demonstrated infrared extinction variations relative to the V band as a function of Galactic latitude. They found a steeper extinction curve with increasing latitude, implying the existence smaller dust grain sizes with height above the plane. Our results seem to strongly contradict this finding, and may instead imply a difference in grain chemistry with Galactic latitude.
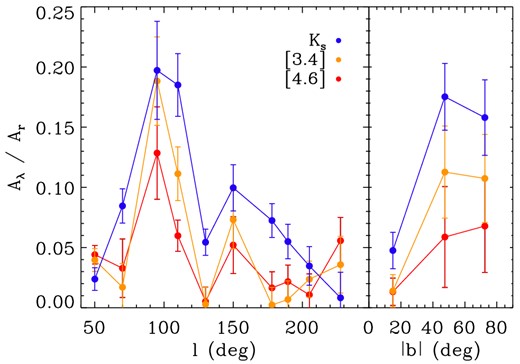
Variations with Galactic longitude (left) and latitude (right) in the fractional extinction coefficients for the Ks, W1, and W2 bands.
5 COLOR OUTLIERS
Using our initial sample of low-extinction point sources, described in Section 2, we carried out a search for objects with unusually red colours in the WISE passbands. For this preliminary investigation, we limited our search to the WISE preliminary data release footprint, which reduced the number of sources to check by eye. Many studies have utilized combinations of optical and mid-IR passbands to find ‘excess’ IR emission, which is frequently attributed to a surrounding dust shell or disc for stellar objects. For example, Beichman et al. (2006) determined the mean K − [24] colour as a function of spectral type for nearby FGKM stars in order to search for excess emission from discs. The mid-IR dust emission is apparent in this K − [24] colour, with Δ(K − [24]) up to 1 mag larger than the intrinsic stellar values (Gorlova et al. 2006). Similarly, we have used our locus to find stars with excess emission in the Ks − W3 colour space.
We first selected all sources from our low-extinction sample that had robust W3-band measurements, requiring a photometric error of σW3 ≤ 0.2. We also required stars to have W2 < 12 and W3 < 11 to remove objects with low signal-to-noise ratio in the WISE bands. This resulted in a refined subsample of 4892 objects to search for outliers in the WISE bands.
From this subsample, we selected objects with Ks − W3 colours more than two standard deviations redder than the locus, as demonstrated in Fig. 9. We also required objects to have Ks − W3 < 4, to avoid contamination from objects whose WISE-only colours show them to be quasars (Wright et al. 2010; Wu et al. 2012). There were 126 such objects that were not removed by our earlier u − g cut, but were eliminated by our Ks − W3 < 4 requirement. The final sample of colour outliers contained 199 objects, highlighted in red in Fig. 9.
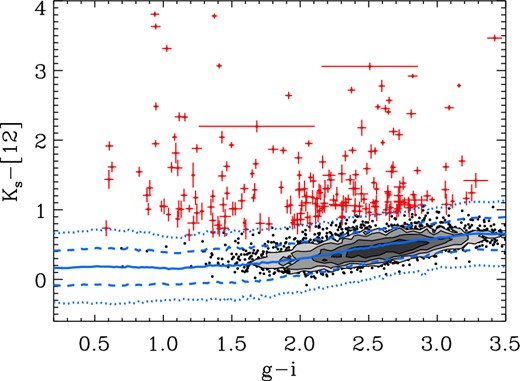
Optical versus infrared colour–colour diagram of the refined subsample of 4892 objects, as defined in the text. Objects selected for their Ks − W3 excess (red crosses) are shown with their photometric error bars. The stellar locus in this colour space (solid blue line) traces the high-density contours of stars. The 1 and 2σ uncertainties on the locus are also shown (dashed and dotted blue lines, respectively).
We elected to not search using the W4 band, as most of the objects in the 4892 subsample had poor signal-to-noise ratio in that filter. The significant number of quasars at red Ks − W3 colours that were removed highlights the difficulty in separating genuine dust discs from contaminating AGN using only optical and NIR filters, and the great utility of matching sources to WISE for classification.
Kennedy & Wyatt (2012) found about 4 per cent of the ∼180 000 objects surveyed in the Kepler field (Borucki et al. 2010) had apparent W3- or W4-band excess emission in WISE. Most of these were attributed to spurious emission from dust overdensities, with only ∼0.15 per cent deemed real mid-IR excesses. Such a low rate may also be due to chance alignments of background galaxies, rather than bona fide dust emission from stars in the Galactic disc.
Our gross rate of detecting excess emission candidates was 199 out of 4892 objects, or 4.1 ± 0.3 per cent, quite close to the initially detected rate of 4 per cent found by Kennedy & Wyatt (2012) in the Kepler field. If we assume the same efficiency in finding bona fide dust discs as in Kennedy & Wyatt (2012), we would expect only ∼7 systems to host astrophysically real infrared excess.
The primary sources of contamination were nearby stars that may not have been properly separated in the WISE or 2MASS imaging, or background galaxies. To further investigate the contamination for our 199 infrared excess candidates, we manually inspected the SDSS imaging within a radius of 20 arcsec around each target. We manually classified the infrared excess candidates in to three categories: 70 objects with background galaxies whose extent was within 10 arcsec of the target, 93 objects with resolved neighbouring point sources within 10 arcsec of the target, and 36 objects with no discernible contaminant with 10 arcsec. The WISE (W2 − W3, W1 − W2) colour–colour distribution for each category is shown in Fig. 10.
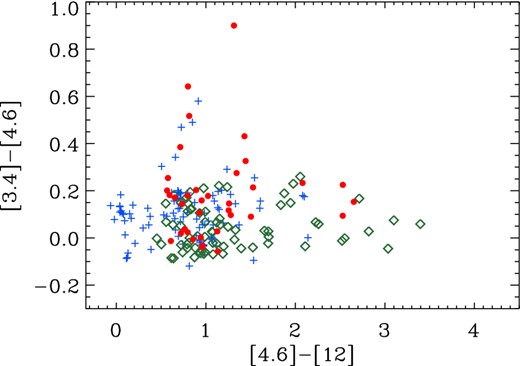
WISE only colour–colour space for the 199 infrared excess candidates. SDSS imaging for each source has been manually inspected. Candidates were put in three categories: objects with a neighbouring star within 10 arcsec (blue crosses), objects with contaminating background galaxies (green diamonds), and objects that appeared isolated within 10 arcsec (red circles).
About half of infrared excess candidates, whose SDSS imaging showed them to have nearby stars, fell close to the stellar locus in the WISE-only colour–colour diagram, blue crosses centered at approximately (0.2, 0.1) in Fig. 10. Objects with clear contamination due to background galaxies in Fig. 10 inhabit a large range in W2 − W3 colour, redward of the stellar locus, shown as green diamonds. These background galaxy contaminants included both small galaxies that, as with the neighbouring star, were not resolved properly in the WISE imaging, and galaxies with highly extended structure that overlapped with the foreground target star and disrupted the local background determination in WISE photometry. Some of the systems with contaminating nearby stars (blue crosses) may have actually been contaminated by unresolved background galaxies instead, creating overlap between these two types of systems in the WISE colour–colour diagram.
A small number of objects follow a linear trend away from the stellar locus, which lie along the asymptotic giant branch track in the WISE colour–colour space (W2 − W3 ∼ 1). Of the objects with no discernible contamination (red circles), only six had W1 < 11 mag. Faint objects with W1 > 11 have a much higher likelihood of being background galaxy contaminants due to increasing densities of galaxies and AGN at fainter WISE magnitudes (Yan et al. 2013; Nikutta, in preparation). These six objects are the most likely warm dust disc candidates in our sample, placing a tentative fraction of stellar systems with real infrared excess at 0.12 ± 0.05 per cent, where the uncertainty quoted is the binomial error. These may also be due to unresolved contamination or binary systems. These three categories of objects (galaxy contaminants, stellar contaminants, and dust disc candidates) all spanned the full range of (g − i) colour in Fig. 9. The six most likely dust candidates, however, all had (g − i) > 2.5, indicating the apparent overdensity of dust candidates in Fig. 9 at blue optical colours was solely due to contamination. Confirming the presence of dust and characterizing the dust temperatures for these candidates will require follow-up at wavelengths of 50–100 |$\mu$|m.
6 SUMMARY
We have presented a study of the fundamental properties of stars across a wide range in wavelength. Our stellar locus, derived from a million low-extinction sources, will be of great utility to many future studies with the powerful multiwavelength combination of SDSS – 2MASS – WISE. Spectroscopically confirmed low-mass stars and brown dwarfs from SDSS, matched to WISE photometry, will also provide an extension of our colour locus to lower mass objects (Schmidt, in preparation).
A brief summary of our work is as follows.
A measurement of the 10-dimensional colour locus was presented, from SDSS u band to WISEW3 band, using 1052 793 stars with low extinction (Ar < 0.125). This locus contains the best characterization of stellar colours in WISE passbands to date.
We have empirically measured the r-band relative dust extinction coefficients, Aλ/Ar, for each of the photometric bands in our sample, providing strong constraints for dust composition models in the infrared.
Variations in the infrared dust extinction have been shown for different LoS. Coherent trends with both Galactic latitude and longitude were seen. Increasing relative infrared extinction with increasing Galactic latitude was found to be in opposition to previous observations. A detailed follow-up investigation of the properties of dust extinction and emission in the infrared with WISE is strongly motivated.
From a subset of our sample, we recovered 199 infrared excess candidates that span a wide range of optical colours. The majority of these were found to be contaminants from neighbouring stars or background galaxies. Six objects appear to be bona fide infrared excess systems, possibly indicative of dust discs. Higher resolution and longer wavelength follow-up is required to verify these systems.
We graciously thank the anonymous referee for whose comments significantly clarified and improved this manuscript. JRAD and ACB acknowledge support from NASA ADP grant NNX09AC77G. ŽI acknowledges support by NSF grants AST-0707901 and AST-1008784 to the University of Washington, and by NSF grant AST-0551161 to LSST for design and development activity.
Funding for SDSS-III has been provided by the Alfred P. Sloan Foundation, the Participating Institutions, the National Science Foundation, and the US Department of Energy Office of Science. The SDSS-III website is http://www.sdss3.org/. SDSS-III is managed by the Astrophysical Research Consortium for the Participating Institutions of the SDSS-III Collaboration including the University of Arizona, the Brazilian Participation Group, Brookhaven National Laboratory, University of Cambridge, Carnegie Mellon University, University of Florida, the French Participation Group, the German Participation Group, Harvard University, the Instituto de Astrofisica de Canarias, the Michigan State/Notre Dame/JINA Participation Group, Johns Hopkins University, Lawrence Berkeley National Laboratory, Max Planck Institute for Astrophysics, Max Planck Institute for Extraterrestrial Physics, New Mexico State University, New York University, Ohio State University, Pennsylvania State University, University of Portsmouth, Princeton University, the Spanish Participation Group, University of Tokyo, University of Utah, Vanderbilt University, University of Virginia, University of Washington, and Yale University.
This research has made use of the NASA/ IPAC Infrared Science Archive, which is operated by the Jet Propulsion Laboratory, California Institute of Technology, under contract with the National Aeronautics and Space Administration.
This publication makes use of data products from the Two Micron All Sky Survey, which is a joint project of the University of Massachusetts and the Infrared Processing and Analysis Center/California Institute of Technology, funded by the National Aeronautics and Space Administration and the National Science Foundation.
This publication makes use of data products from the Wide-field Infrared Survey Explorer, which is a joint project of the University of California, Los Angeles, and the Jet Propulsion Laboratory/California Institute of Technology, funded by the National Aeronautics and Space Administration.
REFERENCES
SUPPORTING INFORMATION
Additional Supporting Information may be found in the online version of this article:
Table 1. The optical and NIR colour locus as a function of g − i colour bins.
Table 2. The mid-IR colour locus as a function of g − i colour (Supplementary Data).
Please note: Oxford University Press is not responsible for the content or functionality of any supporting materials supplied by the authors. Any queries (other than missing material) should be directed to the corresponding author for the article.


