


Abstract
We present simultaneous XMM–Newton and NuSTAR observations of the ‘bare’ Seyfert 1 galaxy, Ark 120, a system in which ionized absorption is absent. The NuSTAR hard-X-ray spectral coverage allows us to constrain different models for the excess soft-X-ray emission. Among phenomenological models, a cutoff power law best explains the soft-X-ray emission. This model likely corresponds to Comptonization of the accretion disc seed UV photons by a population of warm electrons: using Comptonization models, a temperature of ∼0.3 keV and an optical depth of ∼13 are found. If the UV-to-X-ray optxagnf model is applied, the UV fluxes from the XMM–Newton Optical Monitor suggest an intermediate black hole spin. Contrary to several other sources observed by NuSTAR, no high-energy cutoff is detected with a lower limit of 190 keV.
1 INTRODUCTION
The nature of the soft-X-ray excess (i.e. emission in soft X-rays in excess of the extrapolation of the hard power-law component) has been a matter of debate since its discovery (Arnaud et al. 1985; Singh, Garmire & Nousek 1985). The first proposed explanation, pure thermal disc emission, is ruled out by the high temperature implied (about 0.1–0.2 keV) and by its constancy over a wide range of black hole masses (Gierlinski & Done 2004). A great leap forward in our understanding of the soft-X-ray emission was the realization that reflection of the primary X-ray emission from the accretion disc can explain this excess if the disc is at least moderately ionized (e.g. Ross & Fabian 1993; Crummy et al. 2006; Walton et al. 2013). However, there are cases in which even reflection may not be sufficient (Lohfink et al. 2012).
Ark 120 (a.k.a. Mrk 1095, z = 0.0327) is an object where the soft-X-ray emission is prominent (Vaughan et al. 2004). It is a broad-line (Hβ full width at half-maximum of 5800 km s−1; Wandel, Peterson & Malkan 1999) Seyfert 1 galaxy, with an estimated black hole mass of 1.5 × 10⁸ M⊙ (Peterson et al. 2004). It has been observed extensively in X-rays (see Nardini et al. 2011 and references therein), always showing a strong soft excess and never showing a warm absorber – it is indeed often referred to as a ‘bare’ Seyfert 1. Nardini et al. (2011), analysing the 2007 Suzaku observation, found clear evidence for a relativistic iron line, which was not clearly detected in the 2003 XMM–Newton observation (Vaughan et al. 2004).
In this paper, we report on simultaneous XMM–Newton and NuSTAR observations of Ark 120 which demonstrate the importance of broad-band observations to understand the soft excess in AGN.
2 OBSERVATIONS AND DATA REDUCTION
The XMM–Newton observation of Ark 120 analysed in this paper started on 2013 February 18 with the European Photon Imaging Camera (EPIC) CCD cameras, the pn and the two MOS operated in small window and medium filter, and the RGS cameras. Source extraction radii and screening for intervals of flaring particle background were performed with sas 12.0.1 via an iterative process maximizing the signal-to-noise ratio (S/N) (see Piconcelli et al. 2004). After this process, the net exposure time was of about 80 ks for the pn, adopting an extraction radius of 40 arcsec and patterns 0–4. The pn background spectrum was extracted from a source-free circular region with a radius of 50 arcsec. Spectra were binned in order to oversample the instrumental resolution by at least a factor of 3 and to have no less than 30 counts in each background-subtracted spectral channel. This allows the applicability of χ2 statistics. The RGS spectra were reduced following the guidelines in Guainazzi & Bianchi (2007). The net exposure times are about 130 ks for RGS1 and RGS2.
NuSTAR (Harrison et al. 2013) observed Ark 120 simultaneously with XMM–Newton with its two co-aligned telescopes containing focal plane modules A and B (FPMA, FPMB). The level 1 data products were processed with the NuSTAR Data Analysis Software (nustardas) package (v. 1.1.1). Event files (level 2 data products) were produced, calibrated, and cleaned using standard filtering criteria with the nupipeline task and the latest calibration files available in the NuSTAR calibration data base. Extraction radii for both the source and background spectra were 1.5 arcmin. Spectra were binned in order to oversample the instrumental resolution by at least a factor of 2.5 and to have an S/N ratio greater than five in each spectral channel. The net exposure times are about 80 ks for both FPMA and FPMB.
In the following, spectra are analysed with xspec v12.8.0. All errors correspond to 90 per cent confidence levels for one parameter of interest. When performing joint XMM–Newton and NuSTAR fits, we introduced a multiplicative factor to account for differences in the absolute flux calibrations. Fixing this factor to 1 for the pn, it is about 1.06 for FPMA and 1.07 for FPMB (slightly depending on the model). Similar values are found in other AGN observed simultaneously by XMM–Newton and NuSTAR (Brenneman et al. 2014; Marinucci et al. 2014a,b).
3 SPECTRAL ANALYSIS
The XMM–Newton 0.3–0.6, 0.6–2, and 2–10 keV light curves show flux variations of about 15 per cent (Fig. 1), with only a small (less than 10 per cent) variation in the hardness ratios. Similar flux variations, and no spectral variability, are found in the NuSTAR data (Fig. 2). Therefore, for both satellites, we used the spectra integrated over the entire observations and fitted them together.
![Light curves (counts s−1) of the 0.3–0.6 keV (upper panel), 0.6–2 keV (second panel from top), and 2–10 keV fluxes (middle panel) for the XMM–Newton observation (EPIC-pn). The [0.6–2 keV]/[0.3–0.6 keV] and [2–10 keV]/[0.6–2 keV] hardness ratios are also shown (fourth and bottom panels, respectively).](https://oup.silverchair-cdn.com/oup/backfile/Content_public/Journal/mnras/439/3/10.1093/mnras/stu159/2/m_stu159fig1.jpeg?Expires=1750370656&Signature=crAmO0kkIFWBDs4Yu1Uyk8PUinHTopbWpmb0v1bR0srSsMtw-ak0wLWyYsIm8IW8nB7OmUmx8-OpO3TRSzhEJcyVnxp0JSA38yZ5~~UaXzUkfulUDXu2Xf7O5ksz19tWD2TxPVbI98C-Q11ADwSsvescLO2TReAd2UctJDgEqB94UW9FpiRcIEkQrwLpbNGNa9u~Pree4H9svqKVafQqJRDi7XbQv0agI1r4GzDNqFkbiiC~qnav8N-Xu587TxD8TjyGi9us9NaliTbbvs-WJPgS5VVL1eAp4fxPdI8NTzSLwPdSFgHN3j2vDrtUcNPbBW-LVesRGHeIqm1inEcYAA__&Key-Pair-Id=APKAIE5G5CRDK6RD3PGA)
Light curves (counts s−1) of the 0.3–0.6 keV (upper panel), 0.6–2 keV (second panel from top), and 2–10 keV fluxes (middle panel) for the XMM–Newton observation (EPIC-pn). The [0.6–2 keV]/[0.3–0.6 keV] and [2–10 keV]/[0.6–2 keV] hardness ratios are also shown (fourth and bottom panels, respectively).
![Light curves (counts s−1) of the 3–10 keV flux (upper panel), 10–80 keV flux (middle panel), and of the hardness ratio ([10–80 keV]/[3–10 keV], lower panel) for the NuSTAR observation (module B).](https://oup.silverchair-cdn.com/oup/backfile/Content_public/Journal/mnras/439/3/10.1093/mnras/stu159/2/m_stu159fig2.jpeg?Expires=1750370656&Signature=mtetwNVmlliKWQWFyHaadd4V4ve7stx4tlTatoFK7Mtgzrz1mTHcO1UfHj47Ha3gHRVcYeC6CKxvdwgLSpogH92ve1gaT12Xu1X4Uxo5W21WKAMWncfubJQKwTxsvaiwo3P8RBMKSl9TDnHIiAXP-V0rgki664RYyApz555~1GaVc2z03st6wshmelPm~2JpOIS9wtqXlDEu0OtmAjVxNTBugSzeaOW3HY5zMCF6D23GzkOtwtkXcuTZ1SeDUTmUpcc~I9ZhzvcnZp7nQqy6YoUNxxSz-PgmGQX8eflN~vPvKx~TnrxLaJroi~g1cd4NVb8n2L-V3FWrlSYhIEj2Gw__&Key-Pair-Id=APKAIE5G5CRDK6RD3PGA)
Light curves (counts s−1) of the 3–10 keV flux (upper panel), 10–80 keV flux (middle panel), and of the hardness ratio ([10–80 keV]/[3–10 keV], lower panel) for the NuSTAR observation (module B).
First, however, we fitted the two data sets independently. A good fit to the 3–79 keV NuSTAR spectrum is found with a relatively simple model: a power law with a high energy cutoff (Γ = 1.79 ± 0.03, Ec > 340 keV), a cold reflection model (pexrav in xspec; R = 0.26 ± 0.08), and two narrow iron lines (energies of 6.41|$^{+0.03}_{-0.01}$| and 6.91 ± 0.08 keV). The χ2 is 343.0 for 343 d.o.f. (|$\chi ^2_r$| = 1). Then, the XMM–Newton spectrum was added, to show the presence of a strong soft excess below 2 keV (Fig. 3).
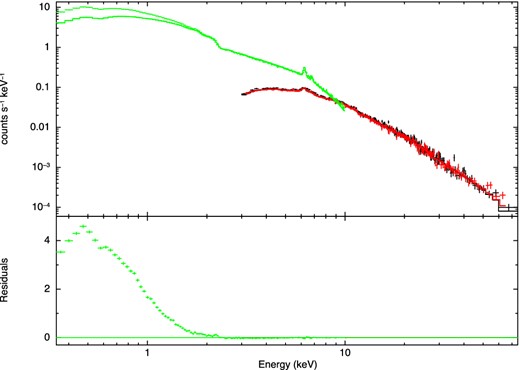
The NuSTAR 3–79 keV spectra (both modules) and the best-fitting model extrapolated to the XMM–Newton EPIC-pn 0.3–10 keV spectrum. Note the strong soft excess.
Then, we fitted the XMM–Newton/EPIC-pn spectrum alone in the 0.3–10 keV band (ignoring the 1.8–2.5 keV band to exclude the instrumental features present there). For simplicity, we used the EPIC-pn detector only. We used a model composed of a power law absorbed by both the Galactic column (NH = 9.78 × 1020 cm−2; Kalberla et al. 2005) and an intrinsic absorber (which, however, in all fits is found to be very small or negligible), neutral and ionized reflection components (xillver in xspec; Garcia et al. 2013), and iron emission lines in addition to those present in the reflection models to account for further features present in the 6.4–7 keV region (see Fig. 4). A single reflector is clearly insufficient to fit the spectrum (|$\chi ^2_r$|/d.o.f. = 8.51/150 and 3.38/147 for an unblurred and a relativistically blurred reflector, respectively), and even with two unblurred plus two relativistically blurred reflection components the fit is unacceptable (|$\chi ^2_r$|/d.o.f. = 2.45/141), clearly requiring a further component to model the soft-X-ray emission. The inclusion of a blackbody emission component improves the fit significantly (|$\chi ^2_r$|/d.o.f. = 1.54/139), but the temperature found is quite large for an AGN (about 0.1 keV, while for a standard optically thick, geometrically thin disc, the maximum temperature appropriate for the black hole mass of Ark 120 is about 10–20 eV; Frank, King & Raine 2002). A multicolour blackbody model (diskbb model in xspec) results in a fit of similar quality (|$\chi ^2_r$|/d.o.f. = 1.52/139).
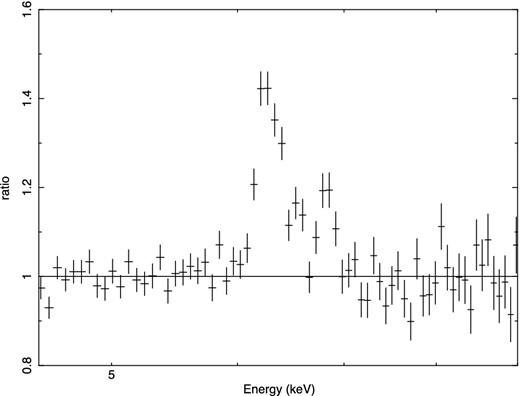
Data-to-model ratio for the XMM–Newton EPIC-pn spectrum in the iron line region when a power law in the 3–5 and 7.5–10 keV ranges is fitted.
A better fit is found substituting the blackbody component with a second, steep power law (ΓSoft ∼ 2.4, |$\chi ^2_r$|/d.o.f. = 1.43/139), even if at the expense of a very flat hard power law (ΓHard ∼ 1.2). A significantly better fit (|$\chi ^2_r$|/d.o.f. = 1.29/145) is found with a cutoff power for the soft excess plus the primary power law, two unblurred reflection components, and the two narrow lines; the addition of a blurred reflection component does not improve the fit quality. Even if the χ2 for these fits is not ideal, an inspection of the residuals shows that there are no obvious features left; most of the remaining problems are related to a still imperfect fitting of the iron line region. Because we are interested here mainly in the soft-X-ray emission, we decided to accept these fits. A detailed discussion of the reflection and line features is deferred to a future paper that we plan to write after the public release of an improved energy scale calibration affecting recent EPIC-pn observations (see discussion in Marinucci et al. 2014b). Here, we just remark that the use of a different reflection model, namely the reflionx model in xspec (Ross & Fabian 2005), gives similar parameters and does not significantly affect the results on the soft excess.
No ionized absorption is apparent, either in the EPIC or in the RGS data, confirming the ‘bare’ Seyfert 1 nature of Ark 120. The observed 0.5–2 and 2–10 keV fluxes are 1.4 × 10⁻¹¹ and 2.3 × 10⁻¹¹ erg cm−2 s−1, respectively, corresponding to absorption-corrected luminosities in the same bands of 3.4 × 1043 and 5.6 × 1043 erg s−1. The source is about 1.4 times fainter than in the 2007 Suzaku observation and 1.8 times fainter than in the 2003 XMM–Newton observation.
Even if Ark 120 is a radio-quiet source, it is not radio silent, so we also tried the srcut model in xspec, which describes the synchrotron spectrum from an exponentially cutoff power-law distribution of electrons in a homogeneous magnetic field. The spectrum is similar to a cutoff power law, but with a rollover slower than exponential. A good fit (|$\chi ^2_r$|/d.o.f. = 1.31/145) is found. One of the model's parameters is the 1 GHz flux, which is well below the observed 1.4 GHz value (e.g. Condon et al. 1998), but this is because the best-fitting power-law index is almost zero. If the radio index observed for this source, 0.6 (Barvainis, Lonsdale & Antonucci 1996), is adopted, the fit is significantly worse (|$\chi ^2_r$|/d.o.f. = 1.57/146) and the 1.4 GHz flux is almost three orders of magnitude larger than observed.
A decent fit (|$\chi ^2_r$|/d.o.f. = 1.46/146) is found with a thermal bremsstrahlung model instead of the cutoff power law. However, assuming that the emitting region is optically thin to Thomson scattering, a lower limit to the size of the emitting region of about 0.1 pc is found, inconsistent with the observed X-ray variability below 0.6 keV, where the soft excess component dominates.
To summarize, from the XMM–Newton data alone, we found that a cutoff power law for the soft-X-ray excess is preferred to, e.g., a power law, but the statistical difference is such that the latter model can not be entirely ruled out. However, the issue becomes immediately clear once we extrapolate (without refitting) the XMM–Newton best-fitting models to the NuSTAR band (see Fig. 5): the power-law model completely fails to fit the NuSTAR spectra.

Upper panel: the XMM–Newton 0.3–10 keV spectrum and best-fitting model extrapolated to the NuSTAR 3–79 keV spectra. Here, the model is composed of a power law, reflection components, Gaussian iron lines, and a second, steeper power law to reproduce the soft-X-ray excess. Lower panel: the same, but with a cutoff power law for the soft excess.
This result is confirmed by the joint XMM–Newton/NuSTAR analysis. The cutoff power-law modelling of the soft-X-ray emission (i.e. the refitting of the model presented in the lower panel of Fig. 5) provides by far the best fit (|$\chi ^2_r$|/d.o.f. = 1.14/494, see also Fig. 6) while the next best fit, that with a blackbody, has |$\chi ^2_r$|/d.o.f. = 1.36/488.
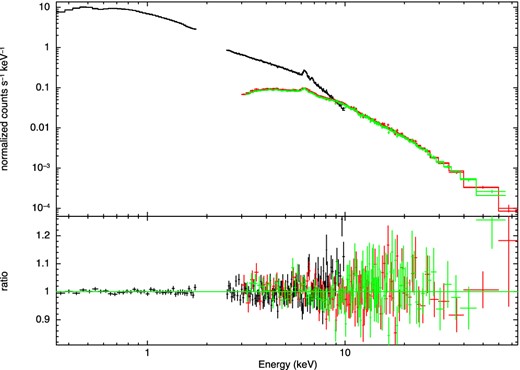
Combined XMM–Newton and NuSTAR spectra and best-fitting model, when a cutoff power law is adopted for the soft excess.
Very similar quality of fits are found using, for the soft excess, Comptonization models instead of a cutoff power law (e.g. compTT, nthcomp or optxagn in xspec). All these models give very similar values for the temperature and optical depth of the Comptonizing slab. We discuss here in some detail the optxagnf model (Done et al. 2012). In this model, the gravitational energy released in the disc at each radius is emitted as a (colour-temperature-corrected) blackbody only down to a given radius, the coronal radius Rc. Below this radius, it is assumed that the energy can no longer completely thermalize, and is distributed between a low-energy and a high-energy electron population, giving rise to a soft and a hard Comptonization component. Even if some of the model assumptions (e.g. the sharp edge between the thermalization and scattering regions, the geometrical coincidence of the two scattering zones, the maximum disc temperature fixed to that at the coronal radius) are certainly oversimplified, it has the merit of connecting the UV and soft-X-ray emission. Input parameters of the model are the black hole mass and the distance of the source (which we kept fixed to the values mentioned in the introduction), the black hole spin, the bolometric Eddington ratio L/LEdd, Rc, the electron temperature and optical depth of the low-energy electron population, the power-law index of the high-energy emission, and the fraction, f, of the power below the coronal radius which is emitted in the hard Comptonization component. Because in optxagn, the hard component is parametrized as a power law with a cutoff energy of 100 keV, we first estimated f ∼ 0.67 using XMM–Newton data alone and then switched off the hard component, substituting it with a cutoff power law. The spin could not be constrained, so we initially fixed it to zero. The reduced χ2 is 1.14 for 493 d.o.f.. The best-fitting parameters are listed in Table 1 while the best-fitting model (without Galactic absorption for clarity) is shown in Fig. 7. Besides optxagn and the cutoff power law, the model is composed of two reflection components and two Gaussian iron lines. Though a detailed discussion of the reflection and line emission is deferred to a future paper, we can say here that the best fit is obtained with two reflection components with ionization parameters of ∼50 (the brightest) and ∼1000 erg cm s−1, respectively. The iron abundance is ∼3.4. Two emission lines are also needed, one at about 7 keV (possibly related to Fe xxvi; the iron Kβ line is already included in the xillver reflection model), with a significance of >99.99 per cent according to an F-test, the other at about 6.55 (corresponding to Fe xxi–xxii), with a significance of 99.98 per cent.
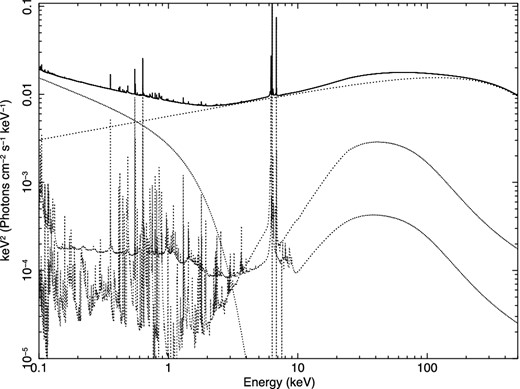
The best-fitting model, with all components also separately shown, for the combined XMM–Newton and NuSTAR spectra when the optxagnf model is adopted for the soft excess.
Best-fitting parameters for the joint XMM–Newton/NuSTAR fitted with the soft excess modelled by optxagnf (Done et al. 2012), for three different black hole spins.
| a | 0 | 0.50 | 0.99 |
|---|---|---|---|
| L/LEdd | 0.16|$^{+0.16}_{-0.08}$| | 0.05|$^{+0.01}_{-0.01}$| | 0.04|$^{+0.03}_{-0.01}$| |
| Rc (RG) | 11.5|$^{+0.1}_{-3.4}$| | 31.3|$^{+39.2}_{-16.6}$| | 24.9|$^{+16.0}_{-15.2}$| |
| kT (keV) | 0.33|$^{+0.02}_{-0.02}$| | 0.32|$^{+0.01}_{-0.01}$| | 0.32|$^{+0.02}_{-0.01}$| |
| τ | 12.9|$^{+1.1}_{-0.9}$| | 13.6|$^{+0.6}_{-0.2}$| | 13.6|$^{+0.4}_{-0.7}$| |
| Γ | 1.73|$^{+0.02}_{-0.02}$| | 1.73|$^{+0.02}_{-0.02}$| | 1.73|$^{+0.02}_{-0.02}$| |
| Ec (keV) | >190 | >190 | >190 |
We then fixed the spin to 0.5 and 0.99. The best-fitting parameters are listed in Table 1. It is worth noting that when we increase the spin, the larger emitting area due to the lower value of the innermost stable orbit is compensated by a lower L/LEdd ratio. The two parameters are therefore largely degenerate, and from the X-ray spectra alone it is not possible to measure the black hole spin.
To remove this degeneracy, we used the XMM–Newton Optical Monitor data, similarly to what was done by Done et al. (2013). Ark 120 was observed with filters UVW1, UVM2, and UVW2, whose effective wavelengths are 2910, 2310, and 2120 Å, respectively. The fluxes were 3.9 × 10⁻¹⁴, 5.3 × 10⁻¹⁴, and 5.6 × 10⁻¹⁴ erg cm−2 s−1 Å−1 (with statistical errors of about 1 per cent), respectively, after correction for Galactic extinction (Schlafly & Finkbeiner 2011) following Seaton (1979). Contributions from the host galaxy are estimated to be less than 10 per cent. Given the uncertainties in any extinction correction and the simplifying assumptions in the model (including the fact that it is angle averaged, so corresponding to an inclination angle of 60°; for lesser inclination angles, the flux would be higher, up to twice as much for a face-on disc), we did not attempt to fit the UV–X-rays spectral energy distribution (SED) but limited ourselves to extrapolating the best-fitting model and comparing it to the UV fluxes. The results are shown in Fig. 8. The a = 0.99 model falls short of the UV fluxes by a factor ∼2–3, while the a = 0 is larger by a factor ∼2. The extrapolation of the a = 0.50 model, instead, is roughly consistent with the UV fluxes. While the range of L/LEdd values are rather common for bright Seyfert galaxies (e.g. Steinhardt & Elvis 2010), it is interesting to note that the low spin solution gives a L/LEdd ratio larger than the typical values for this source (e.g. Woo & Urry 2002; Peterson et al. 2004), an unlikely situation given that in our observation the source was in a rather low-flux state. We conclude that an intermediate value for the spin is preferred. Interestingly, Nardini et al. (2011) reached the same conclusion based on a relativistic reflection fit (see also Patrick et al. 2011).
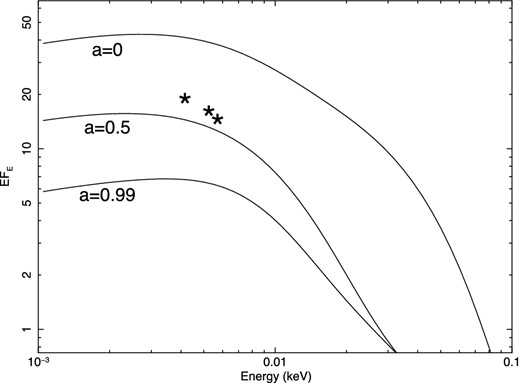
Extrapolation of the combined XMM–Newton (EPIC-pn) and NuSTAR best-fitting models for a = 0, 0.5, and 1 to the XMM–Newton OM UV fluxes.
Because the hard-X-ray emission is thought to originate from the Comptonization of UV/soft-X-ray photons by a population of hot electrons, we substituted the hard cutoff power law with a Comptonization model. We used the compPS model in xspec, assuming a spherical geometry, a Maxwellian electron distribution, and a blackbody input temperature of 20 eV. The fit is as good as the one with the cutoff power law, and the parameters are not very well determined, not surprising given that the cutoff power-law model gives only a lower limit to the high-energy cutoff. For a = 0, the electron temperature is between 110 and 210 keV, while the optical depth is between 0.6 and 1.5. Similar values are found for the other values of the spin. Therefore, the electron distribution is consistent with being optically thick, which may explain the lack of evidence for relativistic reflection: if the corona is extended (as assumed in the optxagnf model), reflection from the inner disc may be scattered and then unrecognizable (e.g. Petrucci et al. 2001).
4 DISCUSSION AND CONCLUSIONS
The 0.3–80 keV spectral energy range provided by the quasi-simultaneous XMM–Newton/NuSTAR observations of the ‘bare’ Seyfert 1 galaxy Ark 120 has allowed us to study the soft-X-ray excess in this source with unprecedented accuracy and robustness. Differently from many other broad-line Seyfert 1s, where ionized reflection is sufficient to explain the soft-X-ray emission, a further component is required. While Ark 120 may well be a peculiar source, it should also be noted that it is one of the best sources where to search for such a component given the lack of intrinsic absorption. A cutoff power law is the best phenomenological model for the excess. If interpreted as a signature of Comptonization, a temperature of ∼0.3 keV and an optical depth of ∼13 are required. A word of caution is needed here, as such large optical depths can work efficiently in Comptonizing photons only if the absorption opacity is much lower than the scattering opacity (see discussion in Done et al. 2012), and it is likely that the presently available Comptonization model are still too simplistic, especially in this regime. Even with these limitations in mind, adopting the recently developed optxagnf model (Done et al. 2012), and using the X-ray data alone, we find that some of the parameters, and in particular the black hole spin and the L/LEdd ratio, are highly degenerate, and we find no strong constraint on the black hole spin from the X-ray data alone. The extrapolation of the best-fitting models to the UV fluxes, however, suggests that an intermediate black hole spin solution is preferred.
X-ray variability is very similar at all energies (Fig. 1). In the Done et al. (2012) scenario, this means that what is driving variability is a change in the total power (possibly related to changes in the accretion rate) rather than a change in the relative fraction of power in the hard and soft components.
Unlike other AGN observed by NuSTAR (e.g. IC4329A, Brenneman et al. 2014; MCG–5-23-16, Harrison et al, in preparation; Swift J2127.4+5654, Marinucci et al. 2014a), no-high energy cutoff is detected, with a lower limit to the e-folding energy of 190 keV. Applying Comptonization models, a temperature of the Comptonizing region much higher than observed in the above-mentioned sources is found.
No clear evidence for relativistic reflection is found. It is interesting to note that in other sources observed simultaneously by XMM–Newton and NuSTAR, where the relativistic reflection is clearly present, this component entirely accounts for the soft-X-ray emission (MCG–6-30-15, Marinucci et al. 2014b; Swift J2127.4+5654, Marinucci et al. 2014a, NGC 1365, Walton et al. 2014). One possible explanation is that in Ark 120 the hot corona, responsible for the hard-X-ray emission, is both optically thick and extended (a possibility which is indeed consistent with the best-fitting value of the radius of the Comptonizing region found with the optxagnf model). The presence of a relativistic iron line, as well as a larger reflection component in the Suzaku observation, may then be explained in terms of a less thick and/or more compact corona during that observation. While a detailed comparison of the present observations with previous ones is beyond the scope of this paper, we note that the spectrum in the Suzaku observation was significantly steeper, suggesting an optically thin corona. In future, it would be interesting to search for correlations between the coronal parameters and the presence and strength of the relativistic reflection in a large sample of objects, a task requiring sensitive, broad-band observations like the one described in this paper.
We thank the anonymous referee for useful comments which helped us to improve the clarity of the paper, and Chris Done for comments and advices on the optxagnf model. This work has made use of data from the NuSTAR mission, a project led by the California Institute of Technology, managed by the Jet Propulsion Laboratory, and funded by the National Aeronautics and Space Administration. We thank the NuSTAR Operations, Software and Calibration teams for support with the execution and analysis of these observations. This research has made use of the nustardas jointly developed by the ASI Science Data Center (ASDC, Italy) and the California Institute of Technology (USA). The work is also based on observations obtained with XMM–Newton, an ESA science mission with instruments and contributions directly funded by ESA Member States and the USA (NASA). GM and AM acknowledge financial support from Italian Space Agency under grant ASI/INAF I/037/12/0-011/13 and from the European Union Seventh Framework Programme (FP7/2007-2013) under grant agreement n.312789.
