


Abstract
The dust cloud TGU H645 P2 and embedded in it the young open cluster NGC 7129 are investigated using the results of medium-band photometry of 159 stars in the Vilnius seven-colour system down to V = 18.8 mag. The photometric data were used to classify about 50 per cent of the measured stars in spectral and luminosity classes. The extinction AV versus distance diagram for the 20 arcmin × 20 arcmin area is plotted for 155 stars with two-dimensional classification from the present and the previous catalogues. The extinction values are found in the range between 0.6 and 3.4 mag. However, some red giants, located in the direction of the dense parts of the cloud, exhibit the infrared extinction equivalent up to AV = 13 mag. The distance to the cloud (and the cluster) is found to be 1.15 kpc (the true distance modulus 10.30 mag). For determining the age of NGC 7129, a luminosity versus temperature diagram for six cluster members of spectral classes B3–A1 was compared with the Pisa pre-main-sequence evolution tracks and the Palla birthlines. The cluster can be as old as about 3 Myr, but star formation continues till now as witnessed by the presence in the cloud of many younger pre-main-sequence objects identified with photometry from 2MASS, Spitzer and WISE infrared surveys.
INTRODUCTION
A small group of early-type stars surrounded by the reflection nebula NGC 7129 was described by Herbig (1960) in his pioneering paper on the search of emission-line B and A stars associated with nebulosities. Later on, more fainter stars in the nebula and around it were identified (Strom, Vrba & Strom 1976; Hartigan & Lada 1985; Hodapp 1994). The cluster was included in the catalogue of infrared star clusters and stellar groups by Bica, Dutra & Barbuy (2003a). The dust cloud, now known as TGU H645 P2 (Dobashi et al. 2005), is illuminated mainly by three hot stars: BD+65 1637 (B2e, V = 10.15), BD+65 1638 (B3, V = 10.18) and LkHα 234 (B6e, V = 11.90); the first and the third of them are the Herbig Ae/Be stars (Herbig 1960). Most fainter stars of the cluster are also young stellar objects (hereafter YSOs) identified by Magakian, Movsesian & Nikogossian (2004) using spectral observations and VRI photometry, and by Gutermuth et al. (2004, 2009), Muzerolle et al. (2004) and Stelzer & Scholz (2009) using 2MASS and Spitzer infrared photometry and Chandra X-ray survey. Kato et al. (2011) identified some possible YSOs in the close vicinity of LkHα 234 with high-resolution near-IR images. For a few YSOs in the cluster and in the dark cloud LDN 1181 located about 0| $_{.}^{\circ}$|5 north of NGC 7129, masses, spectral types, emission-line intensities, BVRI photometry, spectral energy distributions and physical parameters were obtained by Kun et al. (2009). A review of the investigations of NGC 7129 and its individual objects was published by Kun, Kiss & Balog (2008).
The distance determinations to NGC 7129 are scarce and of low accuracy. The first distance estimation was done by Racine (1968), who used one-dimensional spectral classes of the stars BD+65 1637 and BD+65 1638 (B2nne and B3) and their UBV photometry. The distance moduli 12.2 (2.75 kpc) and 10.0 (1 kpc) were estimated, but they are very uncertain, since the luminosity classes of these stars were unknown. The last of these two distance values has been used in most subsequent investigations, including the recent papers in the Spitzer era. The next estimate of the distance to the NGC 7129 complex, 1.26 kpc, was published by Shevchenko & Yakubov (1989) using BV photometry and spectral classification of a few reddened stars. However, their result is also of low accuracy since the authors have used one-dimensional spectral classes estimated visually from low-dispersion objective prism spectra. Thus, NGC 7129 remains one of the rare NGC objects to which the distance and age lines in the WEBDA data base are empty.
The stars in the direction of NGC 7129 exhibit very different reddenings and extinctions making the traditional method for determining the cluster parameters by fitting ZAMS to the reddened main sequence (MS) not applicable. Thus, we need to make individual search of its members, their classification, and to determine colour excesses and extinctions. And what is more, because of young age, only a few cluster members of spectral class B in the colour–magnitude diagram are located close to the MS. The majority of stars are on the pre-main-sequence (hereafter PMS) evolutionary tracks; thus, their spectral classification and reddening determination are of low quality.
With the aim to determine the distance to the dust cloud TGU H645 P2 and the embedded cluster NGC 7129, we decided to apply the Vilnius seven-colour system.1 This system makes possible to classify normal stars of various temperatures in spectral and luminosity classes in the presence of variable interstellar reddening. In this area, the first paper on Vilnius photometry was published by Maskoliūnas et al. (2012, hereafter Paper I). It contains the results of CCD photometry of 2140 stars down to V = 17 mag in the 1.5 square degree area, which covers the clusters NGC 7129 and NGC 7142, and a surrounding area. The results of photometric classification in spectral and luminosity classes were given for about 70 per cent of the measured stars. The cluster NGC 7142 has been investigated in our previous paper (Straižys et al. 2014, hereafter Paper II).
To increase the limiting magnitude, we have obtained CCD exposures with a larger telescope and a better resolving power. This paper describes the new results of photometry and classification of stars in the direction of NGC 7129 and their application to determine more reliable distance and age of the cluster.
OBSERVATIONS, THEIR PROCESSING AND RESULTS
Fig. 1 shows the 13 arcmin × 13 arcmin area with the NGC 7129 cluster in the centre (21h43m00s, +66°06′). In 2009 October, this area was observed with the 1.8 m Vatican Advanced Technology Telescope (VATT) on Mt Graham in Arizona with a CCD camera and seven filters of the Vilnius photometric system. The exposure lengths were from 800 to 20 s in the two ultraviolet filters and from 100 to 4 s in the remaining filters. The number of exposures used was 86. The magnitudes determined from multiple exposures in the same filter were averaged. More details about the observations, their processing and the classification of stars are given in Paper II.
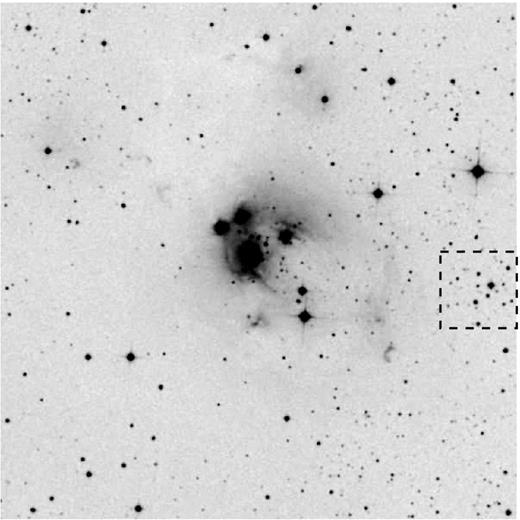
Area of the cluster NGC 7129 observed in the Vilnius photometric system with VATT (13 arcmin × 13 arcmin). The 2 arcmin × 2 arcmin square surrounds a group of stars which was suspected by Bica et al. (2003b) as an infrared cluster. For more about this group see Section 7. The DSS2 Red map from SkyView.
In this area, 159 stars down to V = 18.8 mag were measured. The distribution of the observed stars in apparent magnitudes is shown in Fig. 2. Magnitudes and colours for the stars are listed in Table 1. The columns list the following information: star number, equatorial coordinates J2000.0, magnitude V, colour indices U–V, P–V, X–V, Y–V, Z–V and V–S, photometric spectral types in the MK system and flags to the notes placed at the end of the table. The rounded coordinates of stars were taken from the PPMXL catalogue (Roeser, Demleitner & Schilbach 2010). The finding chart for the measured stars in the NGC 7129 area is given in Fig. 3.
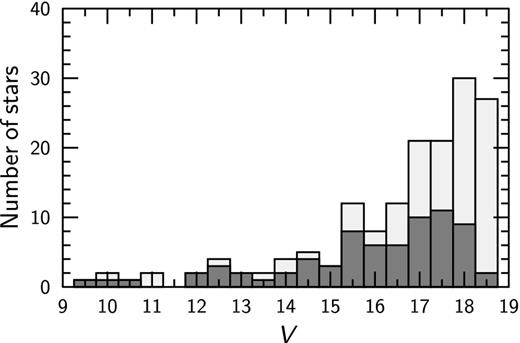
Distribution of the measured stars in the NGC 7129 area in apparent magnitudes. The shadowed parts of the columns correspond to stars for which two-dimensional spectral types were determined.
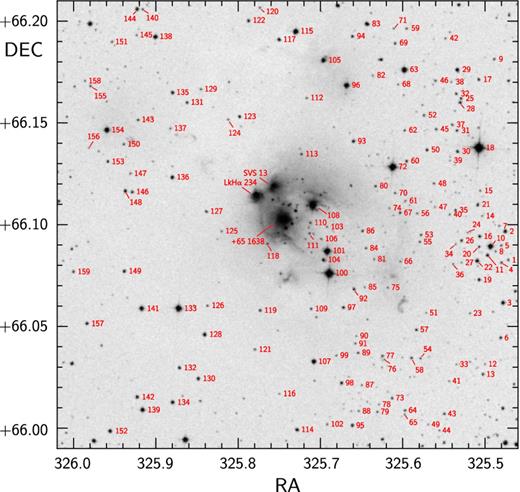
Finding chart for the measured stars in the NGC 7129 area. The star numbers are written on a DSS2 Red image from SkyView.
The extracted sample of the star data catalogue in the NGC 7129 area measured in the Vilnius seven-colour system. The star numbers from 125 to 134 are taken to represent better all the columns. The running numbers, coordinates, V magnitudes, six colour indices, photometric spectral types and notes are given. The coordinates are from the PPMXL catalogue (Roeser et al. 2010) rounded to two decimals of time second and to one decimal of arcsecond. The full catalogue of 159 stars is available online.
| No. | RA (J2000) | Dec. (J2000) | V | U–V | P–V | X–V | Y–V | Z–V | V–S | Phot. | Notes |
|---|---|---|---|---|---|---|---|---|---|---|---|
| (h m s) | (○ ′ ′′) | (mag) | (mag) | (mag) | (mag) | (mag) | (mag) | (mag) | sp. type | ||
| 125 | 21 43 16.83 | +66 05 48.7 | 18.400 | 3.552: | 1.132 | 0.564: | 1.527 | YSO | * | ||
| 126 | 21 43 20.87 | +66 03 37.0 | 17.487 | 2.702 | 1.078 | 0.605 | 1.249 | m1 V | |||
| 127 | 21 43 21.24 | +66 06 23.8 | 17.456 | 3.944: | 2.984: | 1.203 | 0.531 | 1.426 | ** | ||
| 128 | 21 43 21.70 | +66 02 46.1 | 14.240 | 2.592 | 2.067 | 1.442 | 0.624 | 0.232 | 0.602 | f8 V | |
| 129 | 21 43 22.90 | +66 10 00.1 | 18.327 | 3.079: | 1.346 | 0.509: | 1.469 | k0, YSO | * | ||
| 130 | 21 43 23.54 | +66 01 27.9 | 15.542 | 4.392 | 3.817 | 2.692 | 1.014 | 0.615 | 1.108 | m0 V | |
| 131 | 21 43 26.95 | +66 09 36.6 | 16.542 | 4.114 | 3.636 | 2.537 | 1.024 | 0.519 | 1.069 | k3:, YSO | * |
| 132 | 21 43 29.01 | +66 01 47.0 | 16.094 | 3.802 | 3.311 | 2.250 | 0.839 | 0.444 | 0.894 | k3 V | |
| 133 | 21 43 29.34 | +66 03 31.9 | 11.124 | 2.339 | 1.782 | 1.184 | 0.516 | 0.181 | 0.497 | f5 V, YSO: | * |
| 134 | 21 43 31.01 | +66 00 45.9 | 14.474 | 2.679 | 2.170 | 1.494 | 0.638 | 0.238 | 0.623 | g0 V |
The rms errors of the magnitudes V and colour indices X–V, Y–V, Z–V and V–S to V = 16 mag usually are lower than 0.02 mag, the errors of U–V and P–V are about 1.5–2.0 times larger. At V > 17.5 mag, the accuracy of photometry in the ultraviolet, especially for heavily reddened stars, is too low for a reliable classification of stars. For most of these stars, the U–V and P–V colour indices are not given. Colour indices with σ = 0.05–0.10 mag are marked with colons. Most of these stars are either fainter than 18 mag or are known as YSOs.
Single asterisks in the last column signify YSOs for which the notes are given at the end of the table. Most YSOs have been discovered by Hα emission, by infrared excesses or by X-ray emission in the papers described in Section 1. Some YSOs were identified in the present investigation using the Ks–[3.4] versus [3.4]–[4.6] diagram which combines the 2MASS and WISE magnitudes. The calibration of this diagram in YSO classes was taken from Koenig et al. (2012). Variable stars in the area were identified using the catalogue of variable stars in open cluster fields by Zejda et al. (2012). The stars found to be binaries or having asymmetric images were not classified in luminosity classes – in the last column they are designated by double asterisks.
INTERSTELLAR REDDENING LAW AND PHOTOMETRIC CLASSIFICATION
From the Vilnius photometric data, spectral and luminosity classes in the MK system were determined for 72 stars (Table 1 and Fig. 2). The classification method was based on the interstellar reddening-free Q-parameters and intrinsic colour indices, more information is given in Papers I and II. In Table 1, spectral classes are designated in the lowercase letters to indicate that they are determined from photometric data. In calculating interstellar reddening-free Q-parameters and in dereddening colour indices, the normal interstellar reddening law was applied. Its normality was verified with the J–H versus H–Ks diagram (Fig. 4) plotted for the NGC 7129 area which contains stars with very different reddenings.
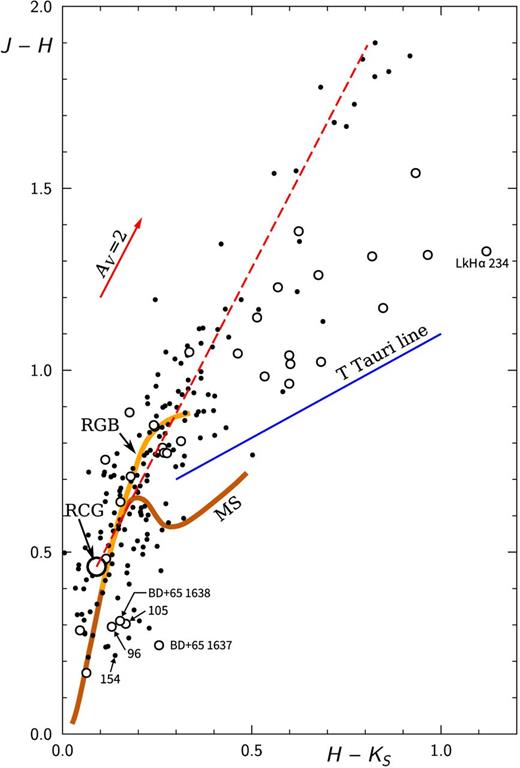
The J–H versus H–Ks diagram for 2MASS stars with errors of magnitudes ≤ 0.05 mag in the 15 arcmin × 15 arcmin box centred on NGC 7129. Above J–H = 1.5, the lower accuracy limit of magnitudes, < 0.1, is accepted. The MS (brown belt), red giant branch (RGB, orange belt), the intrinsic locus of RCG with its reddening line and the intrinsic T Tauri line are shown. The open circles designate the YSOs from Table 1 and from the literature. The six B3–A1 stars, used in Section 6 for the age determination, are identified.
The area, from which the stars are plotted in Fig. 4, is of the 15 arcmin × 15 arcmin size, with the centre on NGC 7129. Lower than J–H = 1.5, only the stars with magnitude errors ≤0.05 mag are plotted. The location of intrinsic sequences of luminosity V and III stars and the intrinsic position of the red clump giants (RCGs) are shown according to Straižys & Lazauskaitė (2009). Trying to plot more heavily reddened giants, the magnitude errors above the mentioned value of J–H were increased up to 0.1 mag. Most of the heavily reddened giants should be core helium-burning RCGs since their space density outnumbers the density of normal hydrogen-burning giants of spectral classes K–M by a factor of 10 (Perryman et al. 1995, 1997; Alves 2000).
The reddening line with the slope |$E_{J-H} / E_{H-K_s}$| = 2.0, drawn through the intrinsic position of RCGs at J–H = 0.46, H–Ks = 0.09 (Straižys & Lazauskaitė 2009), represents well the reddened giants up to J–H = 1.9. This slope of the reddening line is typical of most dark clouds and correspond to the normal interstellar reddening law (Straižys & Laugalys 2008; Straižys, Corbally & Laugalys 2008).
Probable RCGs behind the TGU H645 P2 cloud identified in the J–H versus H–Ks diagram.
| 2MASS | K | J–H | H–Ks | |$A_{K_s}$| | AV | d (kpc) |
|---|---|---|---|---|---|---|
| J21424991+6602358 | 13.508 | 1.900 | 0.826 | 1.47 | 12.90 | 5.34 |
| J21431052+6601456 | 13.317 | 1.855 | 0.793 | 1.41 | 11.70 | 5.03 |
| J21425832+6607262 | 11.906 | 1.681 | 0.718 | 1.26 | 10.46 | 2.81 |
| J21430784+6607185 | 13.936 | 1.864 | 0.918 | 1.66 | 13.74 | 5.96 |
| J21431867+6604129 | 13.248 | 1.541 | 0.559 | 0.94 | 7.78 | 6.05 |
| J21432088+6606519 | 13.022 | 1.731 | 0.771 | 1.36 | 11.30 | 4.49 |
| J21425343+6611054 | 13.066 | 1.807 | 0.825 | 1.47 | 12.20 | 4.36 |
| J21425210+6607396 | 14.564 | 1.821 | 0.862 | 1.54 | 12.82 | 8.41 |
| J21425982+6607315 | 13.239 | 1.548 | 0.617 | 1.05 | 8.75 | 5.72 |
| J21431528+6607571 | 12.588 | 1.670 | 0.750 | 1.32 | 10.96 | 3.45 |
| J21431694+6612092 | 13.588 | 1.778 | 0.682 | 1.18 | 9.83 | 6.33 |
INTERSTELLAR EXTINCTION
Since the cluster NGC 7129 is embedded in the dust cloud, for the determination of the cluster distance, we have applied the method which uses the rise of extinction of the field stars located at a distance of the dust cloud.
For the determination of the extinction run with distance in the direction of NGC 7129, 72 stars from Table 1 with the most accurate spectral types were used. This sample was supplemented with 83 stars classified with good accuracy in Paper I and located outside the 13 arcmin × 13 arcmin area but inside the 20 arcmin × 20 arcmin area centred on the cluster. This area covers the whole molecular cloud around NGC 7129 shown in the CO map by Ridge et al. (2003). The known YSOs and other stars with low classification accuracy were excluded.
Fig. 5 shows the extinctions AV plotted as a function of the distance d. The crosses designate the six cluster members of the highest luminosity. These stars will be discussed in Section 6. The error bar in distance corresponds to ΔMV = ± 0.5 mag, a typical 3σ error of absolute magnitudes estimated from photometric spectral types. The errors of AV, originating from the observational errors and intrinsic ‘cosmic dispersion’ of the relation between Y–V and spectral classes, are of the order of ±0.2 mag.
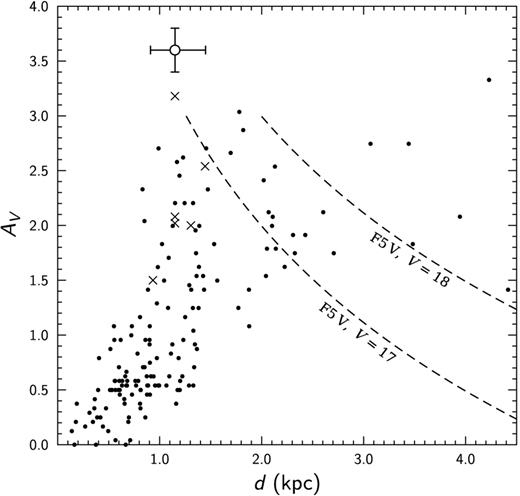
Extinction versus distance diagram for 155 stars in the 20 arcmin × 20 arcmin area around NGC 7129 classified in the Vilnius system. The crosses designate six cluster stars of the highest luminosity. The open circle with 3σ error bars is plotted at the cluster distance. The two curves show the limiting magnitude effect for F5 V stars with V = 17 and 18 mag.
CLOUD DISTANCE
The distribution of stars in Fig. 5 shows that the extinction increases steeply close to d ≈ 1 kpc where the TGU H645 P2 cloud can be located. The scatter of AV at greater distances is quite large – from about 1 to 3.4 mag. Another, much lower rise of extinction up to 1 mag might be present at a distance of ∼500 pc.
For determining the cloud distance, we must take into account that a portion of stars are scattered towards lower distances because of negative distance errors. The main source of distance errors is in their absolute magnitudes – in the photometric classification, we take ±0.5 as the 3σ error of MV. In this case, the stars with the maximum negative distance errors will appear closer to the Sun by a factor of 1.26. Thus, if we find stars with large extinctions at a distance d1 pc, the true distance of the cloud should be at d = 1.26 d1. In Fig. 5, the mean distance of five considerably reddened stars (AV > 1.4 mag) at d < 1.0 kpc is 0.91 kpc. If these stars are moved from the dust cloud shortwards because of absolute magnitude errors, the front edge of the cloud is expected to be located at d = 1.15 kpc, which corresponds to the true distance modulus V − MV = 10.30 ± 0.17 mag. This rms error of V − MV corresponds to the distance errors from −84 pc to +91 pc. At a distance of 1.15 kpc, the angular diameter of the cloud, 0| $_{.}^{\circ}$|3, is equal to 6 pc.
Also, for the shortward scattering of apparent distances, the unresolved binary stars can be responsible. If both components of a binary star are of the same luminosity, its real distance should be at 1.41 d1. In this case, the distance of the cloud should be at d = 1.28 kpc. Since we have no information that any of the five stars with apparent distances <1 kpc is a binary, we will accept that their shifts shortwards are due to the errors of MV only.
As shown in Fig. 2, most stars in the NGC 7129 area with two-dimensional spectral types fall in 17–18 mag. The majority of them are MS stars of spectral classes F and G. The two broken curves in Fig. 5 demonstrate the effect of limiting magnitude for F5 V stars with magnitudes V at 17 and 18. Above the upper curve only B- and A-type stars, as well as G–K–M giants can be found. These types of stars in this area are rare.
Fig. 5 shows that behind the dust cloud at 1.15 kpc, the extinction does not increase – it remains approximately between 1.5 and 3.4 mag up to 4.5 kpc. This is expected, since at the Galactic latitude 9° our line of sight at 2 kpc reaches 320 pc above the Galactic plane, where dust clouds are quite rare. However, the J − H versus H − Ks diagram of 2MASS shows (Fig. 4 and Table 2) that the background RCGs, located at distances from 3 to 8 kpc, are affected by reddening, which corresponds to AV up to ∼ 14 mag. The most reddened 11 RCGs with J − H > 1.5 all are seen mostly in the eastern (left) half of the cloud area with the largest dust density. The presence among them of a few ordinary K–M giants will not change the conclusion that the total extinction, created by the cloud in some directions, is as large as 10–14 mag.
HR DIAGRAM
Since the cluster NGC 7129 is embedded in the dust cloud TGU H645 P2, we accept the same distance both for the cloud and the cluster. We have identified only six stars close to the ZAMS for which the membership to the complex is evidenced by illumination of the surrounding dust and forming the reflection nebulae. Three of these stars, nos. 96, 105 and 154, are 4–6 arcmin away from the central concentration of visible and infrared objects. However, they all are located in the same dust and molecular cloud, and we will consider these three stars as the cluster members formed in the local condensations of gas and dust a few million years ago. The most active star formation continues up to now in the core of the cluster which, according to Gutermuth et al. (2004, 2005), has a diameter of 3 arcmin, while the whole area in which YSOs are observed is about four times larger. Our further study of the cluster will be based only on these six stars which are massive enough to be located in the temperature versus luminosity diagram close to the MS. We recognize them as cluster members only because they illuminate the surrounding dust cloud or are Herbig Ae/Be stars. Other cluster members are low-mass YSOs which have been easily recognized by their emission lines, infrared excesses and X-ray emission (see Section 1). However, within 6 arcmin from the cluster centre, we have not found more A or F stars whose distances would be close to 1.15 kpc. This means that during the last 1–3 Myr no more massive stars have been formed.
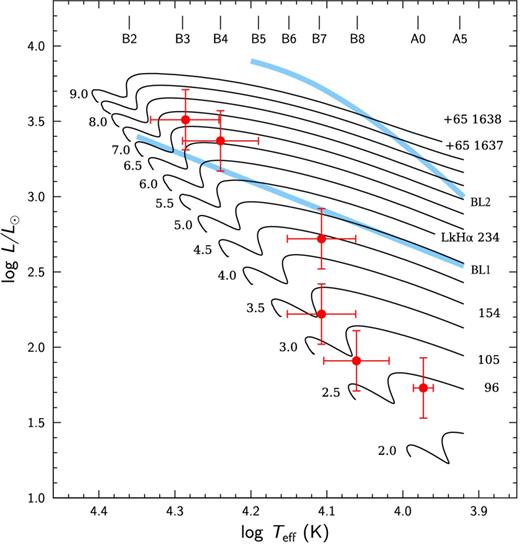
The effective temperature versus luminosity diagram with the PMS evolution tracks for the masses 2–9 M⊙ computed by the Pisa group. Six NGC 7129 members of spectral classes B3–A1 located close to the ZAMS line with their error bars are plotted in red. Numbers of these stars are shown at the right edge of the plot. Spectral classes, corresponding to the effective temperatures, are indicated at the top. The two birthlines for the 10−5 and 10−4 M⊙ yr−1 accretion rates from Palla (2005) are shown in blue. They are designated as BL1 and BL2, respectively.
Photometric and evolution parameters of the most luminous stars in the NGC 7129 area, located in the luminosity–temperature diagram close to the MS. The results for the first three stars are based on their MK types and B, V photometry from Racine (1968), Herbst & Shevchenko (1999) and Hernández et al. (2004), see the text. The results for the last three stars are based on Vilnius photometry.
| No. | Sp. type | V | MV | AV | log L/L⊙ | log Teff | BC | Mass | Age | Notes |
|---|---|---|---|---|---|---|---|---|---|---|
| (mag) | (mag) | (mag) | (M⊙) | (Myr) | ||||||
| BD+65 1637 | B4 (III–IV) | 10.18 v | −2.14 | 2.02 | 3.37 | 4.240 | −1.57 | 6.6 | 0.27 | 1 |
| BD+65 1638 | B3 (IV) | 10.18 | −2.20 | 2.08 | 3.51 | 4.286 | −1.85 | 7.2 | 0.20 | |
| LkHα 234 | B7 (III) | 12.21 v | −1.27 | 3.18 | 2.72 | 4.107 | −0.80 | 4.5 | 0.70 | 2 |
| 2MASS J21424031+6610069 | a1 IV–V | 12.35 | +0.80 | 1.50 | 1.73 | 3.973 | −0.16 | 2.4 | 3.10 | 3 |
| 2MASS J21424707+6610512 | b8 V | 13.34 | 0.00 | 2.54 | 1.91 | 4.061 | −0.55 | 3.0 | 2.38 | 4 |
| 2MASS J21435035+6608477 | b7 V | 12.28 | −0.30 | 2.00 | 2.22 | 4.107 | −0.80 | 3.5 | 1.59 | 5 |
The three brightest stars in the cluster are BD+65 1637 (Herbig Ae/Be star), BD+65 1638 (YSO of class III) and LkHα 234 (also Herbig Ae/Be star). To calculate the V0 = V − AV and (Y − V)0 values of these stars, the following spectral classes were used: B3 for BD+65 1638 from Racine (1968), B4 for BD+65 1637 and B7 for LkHα 234, both from Hernández et al. (2004). The last two stars are variables (V361 Cep and V373 Cep) with the V amplitudes 0.71 and 1.48 mag, respectively. Their positions in Fig. 6 were calculated using the average V magnitudes and B − V colours from Herbst & Shevchenko (1999). For BD+65 1638, the extinction was calculated from BV photometry given by Racine (1968). If we place these three stars at the accepted distance of the cloud (1.15 kpc), their absolute magnitudes and corresponding luminosity classes are the following: −2.20 (B3 IV) for BD+65 1638, −2.14 (B4 III–IV) for BD+65 1637 and −1.27 mag (B7 III) for LkHα 234. In Table 3, these luminosity classes are given in parentheses. In the AV versus d diagram (Fig. 5), these three stars are plotted as crosses at the cluster distance (1.15 kpc).
The three fainter stars, no. 96 (2MASS J21424031+6610069, A1 IV–V), no. 105 (2MASS J21424707+6610512, B8 V) and no. 154 (2MASS J21435035+6608477, B7 V), plotted in Fig. 6, are the sources illuminating the dust cloud in their vicinities and forming the three small reflection nebulae around them. The first two stars were observed in the JHKL system by Strom et al. (1976) (SVS 2 and SVS 10). The reflection nebulae around them are described by Magakian & Movsesian (1997). The star no. 96 was identified by Stelzer & Scholz (2009) as a YSO with X-ray emission. The stars nos. 96 and 105 show excess emission in the WISE 12 and 22 μm bands. However, both of them have approximately photospheric spectral energy distributions up to λ = 5–8 μm. A possibility exists that the flux measurements of these stars in the longest WISE bands are affected by a strong background of the surrounding nebula [see the WISE images of NGC 7129 in SkyView and the discussion in Koenig et al. (2012)].
The bolometric corrections and temperatures of stars were taken from Straižys (1992) according to their spectral classes. Our scale of Teff for B stars is close to those given by Flower (1996), Bessell, Castelli & Plez (1998) and Torres (2010).
We used PMS tracks in the mass range 2–9 M⊙ adopting an initial metallicity Z = 0.0129 and helium abundance Y = 0.274. These values correspond to the initial [Fe/H] = 0.0, if the recent photospheric (Z/X)⊙ = 0.0181 from Asplund et al. (2009), the helium-to-metal enrichment ratio ΔY/ΔZ = 2 (Casagrande et al. 2007) and the primordial helium abundance Yp = 0.2485 (Cyburt, Fields & Olive 2004) are adopted [see, e.g. equations 1 and 2 in Tognelli, Degl'Innocenti & Prada Moroni (2012) for details]. The models have been computed by the Pisa group with the franec stellar evolutionary code (see, e.g. Degl'Innocenti et al. 2008), with input physics similar to those discussed in detail in Tognelli, Prada Moroni & Degl'Innocenti (2011) and used to compute the PMS tracks currently available in the Pisa Stellar Models Database.2 The main differences with respect to those PMS tracks are the adoption of Asplund et al. (2009) solar heavy-element mixture instead of the Asplund, Grevesse & Sauval (2005) one and the consequent slightly higher solar-calibrated mixing-length parameter value α = 1.74. Another important difference is the adoption of a mild (i.e. βov = 0.2) convective core overshooting in stellar models with M ≥ 1.2 M⊙.
The positions of the six stars with respect to the evolution tracks allow us to estimate their masses and ages, the results are given in Table 3. The ages of stars were read out from the evolution track tables at the nearest positions. Among the six stars, BD+65 1638 has the largest mass (about 7.2 M⊙) and is the youngest (0.2 Myr). The star no. 96 has the smallest mass (2.4 M⊙) and it is the oldest one (3.1 Myr).
It is worth to emphasize that the current generation of PMS models is still quite uncertain for ages younger than about 1 Myr (see e.g. Baraffe et al. 2002; Tognelli et al. 2011 and the discussion in the next section). Thus, one should be cautious in assigning very young ages to PMS stars.
The error crosses for each star are shown. The errors of log L/L⊙ in Fig. 6 correspond to ±0.5 mag absolute errors of the accepted distance modulus of the cluster. The errors log Teff correspond to an error of ±1 decimal spectral subclass. Naturally, for the two Ae/Be stars, the real errors should be larger due to lower accuracy of spectral classification, variability, presence of circumstellar discs and envelopes, possibility of anomalous extinction law in the circumstellar dust, etc. The mass and age of a star would be wrong if it were a binary. However, we have not found in the literature any indication on a possible duplicity of the six stars plotted in Fig. 6. The vertical error bars of the distance modulus give various mass errors for different stars – from zero to one solar mass.
THE INFRARED GROUP [BDS2003]31
About a decade ago, Bica et al. (2003b) have published a list of star groups which in the atlas of the infrared 2MASS survey look like open clusters. One of these ‘infrared groups’, [BDS2003] 31, is located close to NGC 7129, with the centre coordinates RA = 21h42m00s, Dec. = +66°05′12′′. In Fig. 1, this group of stars is surrounded by a 2 arcmin × 2 arcmin square.
It is evident that this group is not an infrared object since its 12 stars, seen in the Ks filter, are all observable in optical wavelengths. Most of these stars were measured in the Vilnius system (Table 1) and classified in two dimensions. We plotted for the group the AV versus d and the V0 versus (Y − V)0 diagrams. Both these plots do not confirm that these stars form a real cluster: their AV are scattered within 0.3–1.8 mag, distances are within 0.4–5 kpc and in the colour–magnitude diagram no sequence is seen. One of these stars, no. 27 in Table 1, in the 2MASS + WISE diagram Ks–[3.4] versus [3.4]–[4.6] looks like a YSO. Consequently, the object [BDS2003] 31 is just an accidental asterism, i.e. a group of unrelated stars.
DISCUSSION
In the literature, there are a few estimates of the age of the NGC 7129 stars based on different methods. One of the methods is the estimation of the fraction of stars with the circumstellar discs (YSOs of class II) among the total cluster members. According to Gutermuth et al. (2004), this fraction is 54 per cent, while Stelzer & Scholz (2009) find 33 per cent. Comparing these fractions with the results for other young clusters, they estimate the age of NGC 7129 as 2–3 Myr and 3 Myr, respectively.
Hernández et al. (2004), among other Herbig Ae/Be stars, have obtained new estimates of spectral classes for BD+65 1637 and LkHα 234. Combining these spectral classes with photometry from the literature, they found the positions of these stars in the log L/L⊙ versus log Teff diagram and, comparing with the PMS evolution tracks, estimated their masses and ages. The masses of these stars are 7.0 and 4.8 M⊙, and the ages are 0.29 and 0.83 Myr, respectively, in close agreement with our results, see Table 3.
Kun et al. (2009), using their spectral classes and BVRI photometry in NGC 7129, have plotted in the log L/L⊙ versus log Teff diagram four NGC 7129 K–M stars of low masses. Three of them are found to be younger than 1 Myr. Increasing the distance from their 0.8 kpc to our 1.15 kpc leads to increase of the age but insignificantly. However, the observed magnitudes, colour indices and bolometric corrections of YSOs are usually affected by emission lines and infrared excesses; therefore, the calculation of their positions in the theoretical HR plane can be inaccurate. This was one of the reasons why in this paper we analysed only the massive stars close to the MS: four B–A stars with normal spectra and two Herbig Ae/Be stars.
According to the concept of Stahler (1983) (see also Stahler & Palla (2005, 2013) and Palla (2005)), all PMS tracks in the HR diagram should begin from a ‘birthline’ where the new-born stars first appear as visible objects. In the region of masses larger than 1 M⊙, this line runs approximately along the 0.5–1.0 Myr isochrones approaching the ZAMS. The birthline intersects ZAMS at about 7 M⊙ for the accretion rate 10−5 M⊙ yr−1 and at about 15 M⊙ for the accretion rate 10−4 M⊙ yr−1. Both these birthlines, BL1 and BL2, are plotted in Fig. 6 in blue. The positions of BD+65 1637 and BD+65 1638 are close to the birthline BL1 but are slightly above it. This difference can be related to the errors in their luminosities and the distance modulus of the cluster. However, as recently shown by Baraffe, Vorobyov & Chabrier (2012), the location of stars after the accretion phase is still an open issue, being strongly affected by several not yet well-constrained parameters (i.e. initial mass, accretion type and accretion energy; see also Hosokawa, Offner & Krumholz 2011). This might translate in a quite large luminosity and effective temperature spread in the HR diagram caused by the introduction of an early accretion phase, thus making the comparison between data and models even harder.
RESULTS AND CONCLUSIONS
Medium-band seven-colour photometry of 159 stars in the 13 arcmin × 13 arcmin area in the direction of the cluster and reflection nebula NGC 7129 in Cepheus is accomplished.
For 72 stars, using the interstellar reddening-free Q-parameters, photometric spectral and luminosity classes in the MK system are determined.
For these stars, supplemented with 83 stars from Paper I, the interstellar extinction versus distance diagram in the 20 arcmin × 20 arcmin area centred on the cluster is plotted.
The distance to the interstellar dust cloud TGU H645 P2, which contains the embedded cluster, is found to be 1.15 ±0.08 kpc. The extinction AV in the cluster area exhibits the values between 0.6 and 2.8 mag. The extinction in the densest parts of the cloud, estimated from the J − H versus H − Ks diagram, has the values up to ∼13 mag.
For determining the age of NGC 7129, six cluster members of spectral classes B3–A1 were plotted in the log L/L⊙ versus log Teff diagram, together with the Pisa evolution tracks. Masses of the six stars are found between 7.2 and 2.4 M⊙ and the ages between 3.10 and 0.20 Myr.
We also conclude that the ‘infrared group’ [BDS2003] 31, located about 6 arcmin from the core of NGC 7129, is not a physical cluster.
The use of the SIMBAD, WEBDA, ADS and SkyView data bases is acknowledged. We are grateful to Francesco Palla for consultations. The project is partly supported by the Research Council of Lithuania, grant no. MIP-061/2013.
The mean wavelengths of the passbands are 345 (U), 374 (P), 405 (X), 466 (Y), 516 (Z), 544 (V) and 656 (S) nm. For more details about the system see in the monograph Straižys (1992), available in the pdf format from http://www.itpa.lt/MulticolorStellarPhotometry/.
REFERENCES
SUPPORTING INFORMATION
Additional Supporting Information may be found in the online version of this article:
Table 1. Results of photometry and classification of stars in the NGC 7129 area.
Please note: Oxford University Press are not responsible for the content or functionality of any supporting materials supplied by the authors. Any queries (other than missing material) should be directed to the corresponding author for the article.
