


Abstract
We present high-speed photometry (resolution 0.1 s) obtained during the commissioning of the Berkely Visible Imaging Tube system on the Southern African Large Telescope (SALT). The observations were an attempt to search for very rapid p-mode oscillations in white dwarf stars and included three DA stars known to be g-mode pulsators (ZZ Cet, HK Cet and AF Pic), one other DA star (WD 1056-384) not known to be variable and one AM Cvn star (HP Lib). No evidence was found for any variations greater than about 1 mmag in amplitude (∼0.1 per cent) at frequencies in excess of 60 mHz (periods <17 s) in any of the target stars, though several previously known g-mode frequencies were recovered.
1 INTRODUCTION
The first pulsating white dwarf star was detected over 40 yr ago (Landolt 1968) and around 200 examples are now known. They fall into well-defined temperature regions on the white dwarf cooling tracks and include the DAV (or ZZ Ceti stars), DBV (V777 Her) and DOV (GW Vir) variable types. (Discovery papers are Landolt 1968; Winget et al. 1982; McGraw et al. 1979, respectively). More recently, carbon-rich DQ stars have been found to pulsate (Montgomery et al. 2008) and, most recently, pulsations have been discovered in extremely low-mass white dwarf stars (Hermes et al. 2012, 2013). Additionally, Kurtz et al. (2013) have claimed a new category of pulsators, the ‘hot DA’ stars at around 30 000 K, much hotter than the classical DAV stars. The pulsation periods detected so far lie mostly in the range ∼100–1000 s and, with the possible exception of the low-mass white dwarf stars, are well-understood in terms of non-radial gravity mode (g-mode) oscillations. The existence of oscillations allows a great deal of information to be deduced on such apparently diverse issues as the age of the Galaxy; accurate fundamental parameters for white dwarf stars, including mass and rotation rates; and even whether or not crystallization can occur in the cores of these stars. (For more details see, for example, the comprehensive reviews by Fontaine & Brassard 2008; Winget & Kepler 2008.)
By analogy with the hot subdwarf stars – effectively white dwarf precursors – some of which exhibit pressure (or p-)mode oscillations (Kilkenny et al. 1997); g-mode oscillations (Green et al. 2003) and both types of pulsation simultaneously (Schuh et al. 2005, 2006), we might expect the white dwarf stars also to exhibit p-mode oscillations – which would be extremely useful for probing the deep interiors of the stars. In fact, pulsation theory predicts such p modes with periods of the order of a second (probably in the range ∼0.1–10 s). Even if the extremely low-mass white dwarfs recently shown to pulsate (Hermes et al. 2012, 2013) are demonstrated to be p-mode variables, it will still be important to find such variations in the more common white dwarf types. A brief summary of both the history of theoretical predictions and of actual searches for such oscillations is given in the first section of the paper by Silvotti et al. (2011), which also reports observational attempts to find p modes in DA and DB white dwarf stars. Most recently, Chang et al. (2013) report an attempt to find such modes in a GW Vir star.
An observational difficulty in finding p modes in such stars is that many CCD detectors have read-out times of a few seconds, making a search for ∼1 s variations impossible. Of course, the older technology photomultipliers could easily measure at much faster rates than 1 s but, with small- or medium-size telescopes, the signal-to-noise ratio would typically be far too small to detect what are likely to be quite low amplitude variations. The more widespread availability of large (∼10 m class) telescopes, as well as different instrumental capabilities, has meant that high-frequency searches are now much more feasible. In this context, we present results from the Southern African Large Telescope (SALT) using data obtained during the commissioning of the Berkeley Visible Imaging Tube (BVIT) detector – a microchannel-plate photon-counting system, capable of microsecond time resolution (Siegmund et al. 2008).
Below we describe the results of observing runs on the prototype pulsator ZZ Ceti (= Ross 548), and on two other members of the class – HK Ceti (= GD 1400 = MCT 0145-2211) and AF Pic (= HE 0532-5605). Lasker & Hesser (1971) discovered g-mode oscillations in ZZ Ceti, with periods of 213 and 273 s (frequencies 4.69 and 3.66 mHz). Amplitudes in V were 10 mmag (∼1 per cent) and 1–10 mmag (∼0.1–1 per cent) respectively. Pulsations in HK Ceti and AF Pic were first observed by Fontaine et al. (2003). At least three periods were visible in the discovery data of HK Ceti, namely 462, 728 and 823 s, corresponding to frequencies of 2.16, 1.37 and 1.22 mHz. In the case of AF Pic, periods of 688.8 and 586.4 s (frequencies 1.452 and 1.705 mHz) could be identified with confidence.
Our two remaining targets are WD 1056-384 and HP Lib (= EC 15330-1403). The former is a DA white dwarf with an effective temperature of 27 950 K (Koester et al. 2009), for which no variability has been reported. O'Donoghue et al. (1994) discovered that HP Lib is an AM CVn star – an ultrashort period cataclysmic binary, probably with a low-mass helium-rich secondary (see Solheim 2010 for a recent, comprehensive review of these stars).
2 OBSERVATIONS AND DATA EXTRACTION
Observations were carried out on the nights of 2012 November 9 (HK Ceti), 2012 November 10 (ZZ Ceti) and 2013 February 13 (AF Pic, WD 1056-384 and HP Lib) using the BVIT detector on the 10 m SALT at the Sutherland site of the South African Astronomical Observatory. The BVIT is a 25 mm-diameter photon-counting microchannel-plate sealed tube detector with associated broad-band and neutral density filter systems which, mounted on SALT, allow observations of stars of brightness between about 12th and 21st magnitude in V, in a field of view of 1.9 arcmin on the sky (Siegmund et al 2008; Welsh et al. 2012). Data for all stars were recorded through the V-band filter; in each case a total exposure time of less than an hour was used – due to the fact that the fixed-altitude configuration of SALT does not allow very much longer runs at most declinations. This was not seen as a problem, as we were searching for very rapid variations. Table 1 gives a brief summary of observational details as well as some basic parameters for each target star.
Some basic information about the targets and observations. The alternative names and V magnitudes were extracted from the SIMBAD data base. References for the detected periodicities are 1 – Fontaine et al. (2003) ; 2 – O'Donoghue et al. (1994); 3 – Patterson et al. (2002); 4 – Lasker & Hesser (1971). Column 5 gives the order of the polynomial used to detrend the raw measurements (see Fig. 1). Photon counts were collected in 0.1 s bins and there are ‘N’ such bins in each data set. The final two columns give the mean noise level and the highest peak (Maximum) in each of the amplitude spectra shown in Fig. 2.
| Star name | Other name | V | Known periods (Refs.) | Detrending | Run | N | Mean noise | Maximum |
|---|---|---|---|---|---|---|---|---|
| (s) | order | (min) | (mmag) | (mmag) | ||||
| ZZ Cet | Ross 548 | 14.2 | 213, 273 (4) | 9 | 49 | 29 342 | 0.20 | 1.38 |
| HK Cet | GD 1400 | 14.9 | 462, 728, 823 (1) | 12 | 50 | 29 741 | 0.31 | 1.25 |
| AF Pic | HE 0532-5605 | 16.0 | 689, 586 (1) | 2 | 50 | 29 954 | 0.30 | 1.07 |
| HP Lib | EC 15330-1403 | 13.7 | 1119+harmonics (2); 1103 (3) | 9 | 47 | 27 999 | 0.27 | 1.47 |
| WD 1056-384 | RE 1058-384 | 14.1 | – | 4 | 30 | 17 719 | 0.30 | 1.12 |
The resultant BVIT data stream for each observation consists of a series of files that list the detected time-tagged and (x,y) positioned photon events, each file containing ∼107 photon events. Each photon event is time-tagged with a precision of nanoseconds. Using proprietary software routines, these events are positionally re-mapped into detector x–y space and all events (star + background) contained within a user-selected radius around the star are extracted into an output file that lists photon flux as a function of time. (In the case of the current data, an effective aperture of about 5 arcsec was used which should eliminate any small image ‘wobble’ effects). A similar processing procedure can be carried out on events contained within various areas of sky background on the detector or on photon events from other (comparison) stars that might lie in the detector field of view. Since the BVIT instrument has no internal fine-tracking capability a stellar image is subject to a drift of about one arc minute per hour across the detector field of view. The photon re-mapping software program accounts for this drift.
3 DATA ANALYSIS
The five data sets are displayed in Fig. 1, in the form m = −2.5log10F, where F is the raw count rate, uncorrected for any artefacts. At least four effects can potentially contribute to slow drifts in F: changes in background illumination, changes in the effective telescope aperture, telescope focus changes and shifts in the position of the star image on the detector. Since autoguiding was not available, the latter amounted to about an arcminute per hour and, as the variation of sensitivity of the detector across the field of view is as yet uncalibrated, this effect cannot at present be fully accounted for.
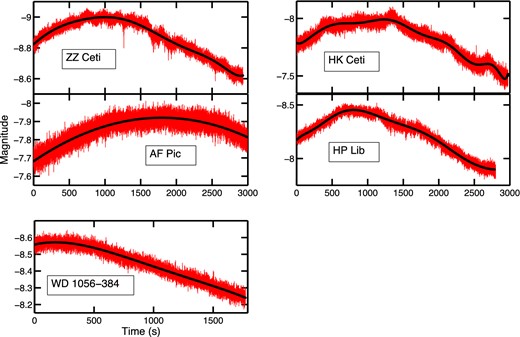
The uncorrected BVIT magnitudes, binned at 0.1 s, with the detrending polynomial fits superimposed.
Fortunately, changes on time-scales of minutes are not important in the present context where we are interested in very rapid variability, since time-scales are easily separated in the frequency domain. To avoid excessive power leakage in periodograms, it is nonetheless prudent first to remove large-amplitude low-frequency changes from the data. Fig. 1 shows models of these – 2nd- to 12th-order polynomial fits compared to the observations – and Table 1 gives a listing of the polynomial (detrending) order used for each star. Following detrending (or ‘pre-whitening’), there is clearly considerable variability left in some of the data sets, on time-scales of a few minutes, so that amplitude spectra are presented separately for frequencies above 40 mHz (Fig. 2) and below 40 mHz (Fig. 3). Inspection of Fig. 2 shows that, generally, a conservative upper limit of about 1 mmag can be placed on variability at frequencies above 60 mHz (periods shorter than 17 s). The final two columns of Table 1 list the mean noise level and the highest peak in each of the amplitude spectra shown in Fig. 2. Together, Figs 2 and 3 indicate that there is no significant signal between about 5 Hz and 10 mHz; that is between 0.2 s (the Nyquist period of our observations which are binned at 0.1 s intervals) and about 100 s.
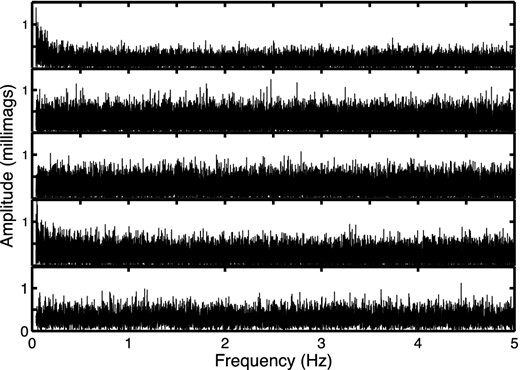
High-frequency amplitude spectra of the detrended data. From top to bottom: ZZ Ceti, HK Ceti, AF Pic, HP Lib and WD 1056-384.
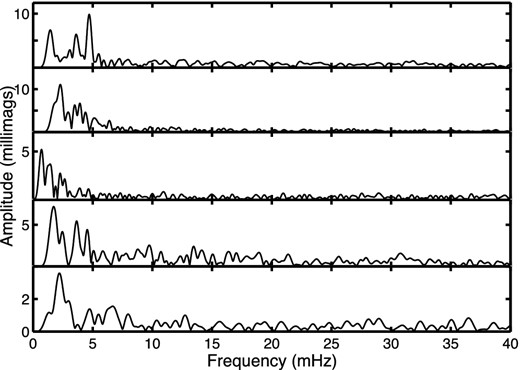
Low-frequency amplitude spectra of the detrended data. From top to bottom: ZZ Ceti, HK Ceti, AF Pic, HP Lib and WD 1056-384.
The low-frequency spectra in Fig. 3 are more interesting. For ZZ Cet, the two higher frequency peaks at 4.71 and 3.65 mHz evidently correspond to the frequencies of 4.69 and 3.66 mHz discovered some decades ago by Lasker & Hesser (1971). Interestingly, the 9.8 mmag amplitude of the 4.70 mHz component agrees remarkably with the 10 mmag found by those authors. The lowest frequency peak in our data, at 1.46 mHz, is not unambiguously present in the two halves of the data set.
In the case of HK Cet, the high order of the detrending polynomial effectively removed all power below about 1.6 mHz. The highest peak in the spectrum in Fig. 3 is at 2.29 mHz (P = 437 s). Detrending by a cubic polynomial leads to dominant frequencies of 1.37 and 2.22 mHz (periods of 730 and 454 s), in reasonable agreement with two of the three periods found by Fontaine et al. (2003) – see Table 1.
The leading frequencies in the AF Pic data are 0.72, 1.41 and 2.28 mHz (periods of 438, 707 and about 1380 s). The peak at 1.41 mHz is quite broad, so that this frequency is probably consistent with the lower frequency (1.45 mHz) in Fontaine et al. (2003). The width of the peak suggests that the periodicity might not be a stable feature.
Extensive photometry by O'Donoghue et al. (1994) showed periods of 1119, 559 and 373 s in the brightness of HP Lib. The principal peaks in our amplitude spectrum are at 582 and 275 s (1.72 and 3.63 mHz). If the raw data are pre-whitened by a cubic, rather than a ninth-order polynomial, the main peaks are at 1031, 564 and 275 s (0.97, 1.77 and 3.64 mHz). Given the short run length, the first two periods are in reasonable agreement with the O'Donoghue et al. (1994) results. It is also noteworthy that 1119/275=4.07, i.e. the 275 s periodicity in our observations might be the third harmonic of the 1119 s superhump period.
WD 1056-384 is not known to be variable but there is a peak in the low-frequency amplitude spectrum at 2.21 mHz (P = 452 s; see Fig. 3). This feature is not strong (3.6 mmag), but re-binning the observations at 10 s shows weak evidence for cyclic variation on a time-scale of about 500 s (see Fig. 4). If real, this would be an important result, as the star would be one of the newly discovered hot DAV stars (Kurtz et al. 2013). Unfortunately, Kurtz et al. (2013) have already used the ESO 3.5 m New Technology Telescope to obtain an ∼2 h data sequence for this star which shows no coherent variation above about 0.3 mmag. We have to concede, therefore, that what we are seeing may be an observational artefact of the BVIT–SALT configuration. But at V = 14.1, this star would certainly merit re-observation in a more conventional way with even a moderate-sized telescope and longer data baseline.
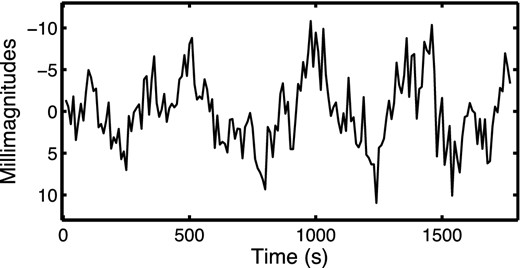
WD 1056-384 observations binned at 10 s.
4 CONCLUSIONS
We find no evidence for rapid (p-mode) oscillations in any of our five target stars, though we do recover many of the known g-mode frequencies in the four known variables, even though our baselines in time are necessarily very short due to the fixed-altitude operation of SALT. The apparent absence of p modes might be real, might be a result of very low amplitudes for such pulsations, or might simply result from the fact that we (and others – for example, Silvotti et al. 2011) have, so far, investigated too small a sample of stars.
The potential of the unusual BVIT detector for high-speed photometry, in particular on a large telescope such as SALT which can deliver high S/N, is demonstrated.
The authors are grateful for telescope time made available at the SALT and for the support given by SALT staff. The authors also thank the referee, Dr Roy Østensen for useful corrections to the original manuscript and for bringing the recent work on hot DAV stars to our attention. DK and CK received research funding from the University of the Western Cape and the South African National Research Foundation. During completion of this work CK enjoyed the hospitality of the Experimental Astrophysics Group at the Space Sciences Laboratory, University of California (Berkeley). The use of the SIMBAD data base is acknowledged with thanks.
