


Abstract
We present 12CO J = 3→2 maps of NGC 2976 and NGC 3351 obtained with the James Clerk Maxwell Telescope (JCMT), both early targets of the JCMT Nearby Galaxy Legacy Survey (NGLS). We combine the present observations with 12CO J = 1→0 data and find that the computed 12CO J = 3→2 to 12CO J = 1→0 line ratio (R31) agrees with values measured in other NGLS field galaxies. We compute the MH2 value and find that it is robust against the value of R31 used. Using H i data from The H i Nearby Galaxy Survey, we find a tight correlation between the surface density of H2 and star formation rate density for NGC 3351 when 12CO J = 3→2 data are used. Finally, we compare the 12CO J = 3→2 intensity with the polycyclic aromatic hydrocarbon (PAH) 8 μm surface brightness and find a good correlation in the high surface brightness regions. We extend this study to include all 25 Spitzer Infrared Nearby Galaxies Survey galaxies within the NGLS sample and find a tight correlation at large spatial scales. We suggest that both PAH 8 μm and 12CO J = 3→2 are likely to originate in regions of active star formation.
INTRODUCTION
Observations of molecular gas are essential for understanding the role of star formation in the evolution of galaxies. Because direct detection of molecular hydrogen (H2) is difficult, carbon monoxide (CO) is used as its proxy. Many extragalactic surveys of low-J rotational transitions of CO have been conducted so far (e.g. Braine et al. 1993; Sage 1993; Young et al. 1995; Elfhag et al. 1996; Meier et al. 2001; Albrecht et al. 2004; Israel 2005), the majority being single pointing observations that do not provide any information on the spatial distribution of the emission. High angular resolution interferometric surveys have also been conducted (e.g. Sakamoto et al. 1999; Regan et al. 2001; Helfer et al. 2003), but most of them have targeted the central regions of the galaxies due to the limited field size. High-sensitivity multipixel array receivers (on single-dish telescopes) are now providing much faster speeds for mapping interesting structures in the interstellar medium (ISM) across entire galactic discs. Two surveys using this type of focal plane array receivers were recently carried out, one by Leroy et al. (2009) using Heterodyne Receiver Array (HERA) on the Institut de Radio Astronomie Millimétrique 30 m telescope to map 12CO J = 2→1 and another by Kuno et al. (2007) using the Beam Array Receiver System on Nobeyama Radio Observatory (NRO) to map 12CO J = 1→0, in nearby galaxies.
The Nearby Galaxy Legacy Survey (NGLS; Wilson et al. 2009, 2012) uses the James Clerk Maxwell Telescope (JCMT) to map 12CO J = 3→2 emission from nearby galaxies. The 12CO J = 3→2 transition traces the warmer and denser regions of the molecular gas that are more directly related to star-forming regions (Wilson et al. 2009, and references therein). The entire JCMT NGLS sample consists of 155 nearby galaxies, each with spectral line observations at 345 GHz, made with the Heterodyne Array Receiver Program for B-band (HARP-B) receiver (Smith et al. 2003). The details of the NGLS can be found in Wilson et al. (2012).
NGC 2976 and NGC 3351 were observed during the early stages of the NGLS. NGC 2976 is a dwarf galaxy on the outskirts of the M81 group, in weak tidal interaction with the group (Appleton, Davies & Stephenson 1981; Yun 1999). Although the galaxy contains primarily an older stellar population, there are indications (Williams et al. 2010) that there are sites of intense star formation at the two bright regions near the north and south ends of the galaxy's major axis (Dale et al. 2009). NGC 3351 is a starburst galaxy with ring structures (Colina et al. 1997; Elmegreen et al. 1997; Knapen, Pérez-Ramírez & Laine 2002; Swartz et al. 2006; Hägele et al. 2007; Comerón et al. 2013) that displays a very young starburst population. It is thus interesting to understand the effect of such different environments on the physical conditions of the molecular component of the ISM within these two galaxies. Using the improved spatial resolution of the NGLS 12CO J = 3→2 survey, we can resolve the sites of warmer, denser molecular hydrogen, and investigate the correlation of this observable with other components of the ISM observed in different wavebands.
Another important motivation for the NGLS is to probe the interplay between dust and gas in nearby galaxies. Polycyclic aromatic hydrocarbons (PAHs) have often been used as an indicator of star formation activity in external galaxies (Zhu et al. 2008; Kennicutt et al. 2009). An alternative theory that PAH emission is not related to star formation but instead is associated with continuum emission from cold dust has also been proposed by Haas, Klaas & Bianchi (2002). However, results from the Spitzer Infrared Nearby Galaxies Survey (SINGS), a comprehensive infrared imaging and spectroscopic survey of 75 nearby galaxies using the SpitzerSpace Telescope (hereafter Spitzer), indicated that the relation between PAHs and star formation extends to spatial scales beyond 1 kpc, although the relation breaks down on smaller spatial scales (Calzetti et al. 2005, 2007; Bendo et al. 2006, 2008; Prescott et al. 2007; Zhu et al. 2008; Kennicutt et al. 2009; Calzetti 2012).
In this paper, we report the 12CO J = 3→2 measurements of NGC 2976 and NGC 3351. We describe the basic properties of the two galaxies in Section 2. The details of the observations and data reduction are presented in Section 3. We present our results and discussion in Section 4 where we calculate 12CO J = 3→2 to 12CO J = 1→0 line ratios, derive the molecular gas masses and study the correlation between the 12CO J = 3→2 line emission and emission from PAHs. Finally, we summarize our conclusions in Section 5.
TARGET GALAXIES
NGC 2976 is an SAB(s:)d peculiar dwarf disc galaxy (Buta, in preparation) in the M81 group. Single-beam 12CO J = 3→2 and 12CO J = 2→1 observations have been presented by Israel (2005), while 12CO J = 1→0 emission has been mapped at high resolution by Simon et al. (2003) using the Berkeley–Illinois–Maryland Association (BIMA) interferometer. These observations, however, only partially covered the two bright end regions. The present NGLS 12CO J = 3→2 map covers a rectangular area corresponding to D25/2, and is therefore wide enough to include both bright complexes.
NGC 3351 is an (R’)SB(r,nr)a spiral galaxy (Buta, in preparation) displaying high-mass star formation in a |$15.3\,\text{arcsec}\times 11.2\,\text{arcsec}$| circumnuclear ring (hereafter the |$15\,\text{arcsec}$| ring; Alloin & Nieto 1982; Buta & Crocker 1993; Colina et al. 1997; Elmegreen et al. 1997; Comerón et al. 2010, 2013), fuelled by gas accreted through a stellar bar (Swartz et al. 2006). Most of the NGC 3351 studies have so far focused on this bright central region of the galaxy. However, the optical image (Frei et al. 1996; Abazajian et al. 2009) shown in Fig. 2(a) shows a faint ring of |$\sim 2\,\text{arcmin}$| diameter (hereafter the |$2\,\text{arcmin}$| ring) encircling the bar, with signs of spiral arms extending from this ring towards the outermost pseudo-ring feature (major axis diameter |$\sim 5.5\,\text{arcmin}$|, minor axis |$\sim 3.6\,\text{arcmin}$|; Buta & Crocker 1993). These features are within the area covered by our 12CO J = 3→2 map of NGC 3351 presented in this paper.
The general properties of NGC 2976 and NGC 3351 taken from de Vaucouleurs et al. (1995) (unless otherwise stated) are summarized in Table 1.
General properties of NGC 2976 and NGC 3351 taken from the literature.
| General properties | NGC 2976 | NGC 3351 |
|---|---|---|
| Type | SAB(s:)d pec | (R’)SB(r,nr)a |
| RA (J2000) | 09:47:15.6 | 10:43:58.0 |
| Dec. (J2000) | +67:54:50 | +11:42:15 |
| Distance (Mpc)a | 3.56 | 9.33 |
| Incl. angleb | 54° | 39° |
| D25/2 (arcmin)c | 2.9 × 1.5 | 3.8 × 2.2 |
| General properties | NGC 2976 | NGC 3351 |
|---|---|---|
| Type | SAB(s:)d pec | (R’)SB(r,nr)a |
| RA (J2000) | 09:47:15.6 | 10:43:58.0 |
| Dec. (J2000) | +67:54:50 | +11:42:15 |
| Distance (Mpc)a | 3.56 | 9.33 |
| Incl. angleb | 54° | 39° |
| D25/2 (arcmin)c | 2.9 × 1.5 | 3.8 × 2.2 |
Archival data
Both NGC 2976 and NGC 3351 are part of the SINGS (Kennicutt et al. 2003) and have rich multiwavelength ancillary data available. Although a number of 12CO data sets at various transitions are available, most of these are single-beam data and thus the comparison with our 12CO J = 3→2 maps is challenging. Furthermore, the spatial distribution information in our high-resolution 12CO J = 3→2 map will also be under-utilized if used together with these single-beam data. Hence, in this paper, we shall discard the use of single-beam data from the literature, but focus only on the available 12CO J = 1→0 maps. For NGC 3351, 12CO J = 1→0 maps are available from the single-dish NRO (Kuno et al. 2007)1 and the BIMA Survey of Nearby Galaxies (SONG; Helfer et al. 2003). We used 12CO J = 1→0 maps from NRO as their beam size (|$15\,\text{arcsec}$|) closely matches the 12CO J=3→2 beam size of HARP-B on the JCMT. Unfortunately, NGC 2976 was not included in the NRO survey. Hence, the 12CO J = 1→0 map for NGC 2976 was retrieved from the BIMA SONG survey.2 However, we have not used this map for any further analysis, but have only displayed the 12CO J = 1→0 distribution within the galaxy in Fig. 1, as the BIMA 12CO J = 1→0 map for NGC 2976 has poor uv-plane sampling.
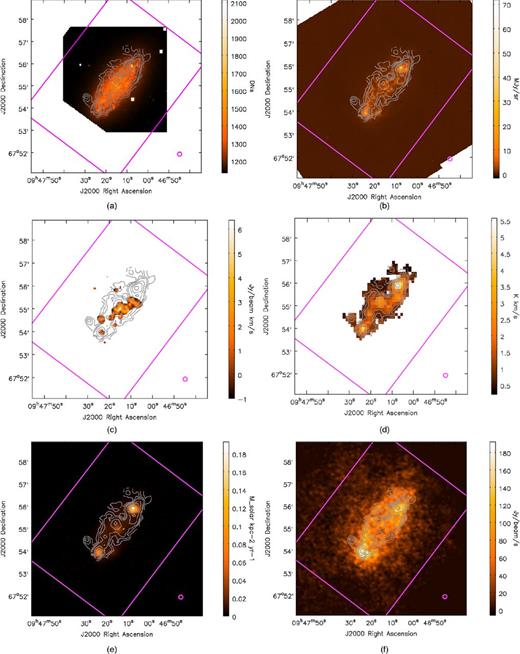
Contours of the 12CO J = 3→2 data of NGC 2976 overlaid on the corresponding ancillary images from the archives. The contour levels are 0.36 (3σ), 0.72, 1.08, 2.0, 3.0 and 5.0 K km s−1 (temperature in Tmb). In all panels, a magenta box is drawn to show the region mapped by HARP-B, and a magenta circle to indicate the 14.5 arcsec angular resolution of the 12CO J = 3→2 data. All images are oriented north up and east to the left. The image representing ΣSFR has been convolved to the HARP-B beam size. The native resolution of each map is listed along with the title of each individual panels. (a) Optical (SDSS, 1.35 arcsec). (b) 8 μm (Spitzer IRAC, 0.75 arcsec). (c) 12CO J = 1→0 (BIMA, 1 arcsec). (d) 12CO J = 3→2 (JCMT NGLS, 7.27 arcsec). (e) ΣSFR (Spitzer MIPS 24 μm and GALEX FUV, 1.5 arcsec). (f) H i (THINGS, 1.5 arcsec).
The Spitzer Infrared Array Camera (IRAC) 3.6 and 8 μm data and Multiband Imaging Photometer for Spitzer (MIPS) 24 μm data used in this study were downloaded from the SINGS website.3 The optical images for both galaxies were retrieved from the seventh data release of the Sloan Digital Sky Survey (SDSS).4 The H i images were downloaded from the The H i Nearby Galaxy Survey (THINGS)5 and the far-ultraviolet (FUV) images used to produce the star formation rate (SFR) surface density images, in conjunction with the 24 μm data, were retrieved from the Galaxy Evolution Explorer (GALEX) data release.6
OBSERVATIONS AND DATA REDUCTION
The 12CO J = 3→2 (rest frequency 345.796 GHz) observations for NGC 2976 were carried out over two nights between 2007 November and 2008 January, while observations for NGC 3351 took place over two runs in 2008 January. The instrument used was HARP-B which has 16 superconductor–insulator–superconductor heterodyne mixers arranged in a 4 × 4 array with |$30\,\text{arcsec}$| row and column separation. This corresponds to a |$2\,\text{arcmin}$| square footprint on the sky. HARP-B operates over a frequency range of 325–375 GHz and the average full width at half-maximum (FWHM) beam width is |$14.5\,\text{arcsec}$|. The receiver operates with the Auto-Correlation Spectrometer and Imaging System (ACSIS; Buckle et al. 2009) as the back-end data processing unit. The observations for both galaxies in this paper were made using a 1 GHz ACSIS bandwidth with a spectral resolution of 0.488 MHz. The main-beam efficiencies (ηMB) used to convert the corrected antenna temperature (|$T_{\rm A}^*$|) to the main-beam brightness temperature (Tmb) were determined from observations of bright planets. All data presented in this paper were calibrated to the Tmb scale using ηMB = 0.6.
Both NGC 2976 and NGC 3351 were raster scanned using a basket-weave technique with half-array steps [|$58.2\,\text{arcsec}$|, the reader is referred to the appendix in Warren et al. (2010) for a more detailed description of the steps used in the data reduction process]. This ensured that all of the area within the target scan region, defined to include all of the optical galactic emission, was fully sampled. These fully sampled maps were made repeatedly until the target root-mean-square noise of the combined scans (less than 19 mK in |$T_{\rm A}^*$| scale) was achieved within a frequency bin of 20 km s−1 resolution. The observational details for each galaxy are summarized in Table 2.
Observation dates and set-up used in the observing runs for NGC 2976 and NGC 3351.
| Parameters | NGC 2976 | NGC 3351 |
|---|---|---|
| Observing dates | 2007 November 25 | 2008 January 07 |
| 2008 January 06 | 2008 January 12 | |
| Pos. angle (major axis) | 143° | 13° |
| Height of map | 294 arcsec | 348 arcsec |
| Width of map | 210 arcsec | 252 arcsec |
| Tsys | 341 K | 409 K |
| |$\Delta T^*_{\rm A}$| | 13.3 mK | 16.2 mK |
| Pixel size | 7.2761 arcsec | 7.2761 arcsec |
Data reduction
The spectral data reduction and analysis was done mainly using the Starlink7 software packages (Jenness et al. 2009). We used Kernel Application Package (kappa)8 and Sub-Millimetre User Reduction Facility applications within Starlink as the main reduction tools. Graphical Astronomy and Image Analysis Tool and Spectrum Analysis Tool were used for analysis and visualization purposes. Data collected under the NGLS were processed primarily following the steps outlined in Warren et al. (2010), with some modifications depending on the characteristics of the individual galaxy and the quality of the observed data (Wilson et al. 2012).
R31 line ratio
To derive the R31 map for NGC 3351 using the NRO's 12CO J = 1→0 map, we re-gridded the 12CO J = 1→0 map to match our pixel size (|$7.28\,\text{arcsec}$|) and calculated the R31 ratio map by performing a pixel-by-pixel division of the resulting 12CO J = 3→2 and 12CO J = 1→0 maps. We did not convolve and match the beam of both maps because the beam sizes of NRO (15|$\,\text{arcsec}$|) and HARP-B (14.5|$\,\text{arcsec}$|) are very similar. As explained in Section 2.1, the BIMA 12CO J = 1→0 map for NGC 2976 has poor uv-plane sampling; hence, we have not produced the R31 map for NGC 2976.
8 μm data and radial profile
The point spread function (PSF) of Spitzer images is highly non-Gaussian. We thus created convolution kernels, following recipes from Gordon et al. (2008) and Bendo et al. (2010), to match the PSFs to those of HARP-B. These kernels were created, for each waveband, using stinytim9 (Krist 2002), and convolved with the Spitzer images to match the HARP-B beam. We used the kappa routine convolve for this task. Further details of the PSF matching for HARP-B and Spitzer images can be found in Bendo et al. (2010).
To create a radial profile, we binned the corresponding maps into a number of elliptical annuli. The ellipticity of the annulus was defined by the ratio of the galaxy's major and minor axis lengths. The width of the annulus was about |$14.5\,\text{arcsec}$| for 12CO J = 3→2 data and |$5.25\,\text{arcsec}$| for PAH 8 μm data, defined along the major axis of the galaxy. The radial surface brightness was then the average of the brightness within each ellipse.
SFR surface density
RESULTS AND DISCUSSION
In Figs 1 and 2, we show the reduced 12CO J = 3→2 maps of NGC 2976 and NGC 3351, respectively, together with the ancillary maps of 12CO J = 1→0, IRAC 8 μm, optical image from SDSS, H i image from THINGS and SFR surface density map. All maps shown are in their native resolution (except the ΣSFR map that was convolved to the HARP-B beam size), overlaid with the contours of our NGLS 12CO J = 3→2 data.
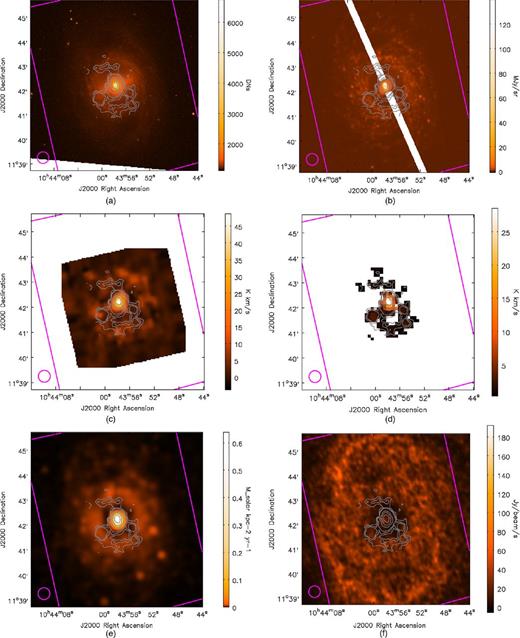
Contours of the 12CO J = 3→2 data of NGC 3351 overlaid on the corresponding ancillary images from the archives. The contour levels are 0.43 (3σ), 0.86, 1.29, 5.0, 10.0, 20.0 and 30.0 K km s−1 (temperature in Tmb). In all panels, a magenta box is drawn to show the region mapped by HARP-B, and a magenta circle to indicate the 14.5 arcsec angular resolution of the 12CO J = 3→2 data. All images are oriented north up and east to the left. The 8 μm image is affected by muxbleed (Laine 2011); hence, the affected area is blanked out. The image representing ΣSFR has been convolved to the HARP-B beam size. The native resolution of each map is listed along with the title of each individual panels. (a) Optical (SDSS, 1.35 arcsec). (b) 8 μm (Spitzer IRAC, 0.75 arcsec). (c) 12CO J = 1→0 (NRO, 1 arcsec). (d) 12CO J = 3→2 (JCMT NGLS, 7.27 arcsec). (e) ΣSFR (Spitzer MIPS 24 μm and GALEX FUV, 1.5 arcsec). (f) H i (THINGS, 1.5 arcsec).
The NGC 2976 12CO J = 3→2 map traces an inverse-S-like feature along the major axis. The structure is not seen in the other wavebands discussed here but does exist in the 12CO J = 2→1 image from the HERA CO-Line Extragalactic Survey (HERACLES; Leroy et al. 2009). This is possibly caused by the lower resolution of the CO maps compared to images at other wavebands. This results in small-scale structures being smoothed out in the CO map, hence, making the large structure easier to identify. In both the 12CO J = 2→1 and our 12CO J = 3→2 maps, the emission near the two ends of the major axis is stronger in comparison to the central region. The same strong emission is detected in the IRAC 8 μm, MIPS 24 μm and THINGS H i observations but not in the optical images.
A weak detection near the central region of our 12CO J = 3→2 map is only evident in the SFR surface density image, indicating the existence of hot dust in this region. We note the presence of a faint blob near the centre of this map although it appears to be slightly shifted compared to the 12CO J = 3→2 detection. This central region of emission is detected in 12CO J = 1→0 from the BIMA SONG observations, and the position is closer to the MIPS 24 μm central detection location. Due to the small area covered by of the BIMA footprint, the north-west bright end region was partly missed, and only the south-east bright end was detected.
The 12CO J = 3→2 line width of the south-east bright end in NGC 2976 is narrower, with half-power line width of around 15 km s−1, compared to the north-west bright end of around 30 km s−1. The spectra of these two bright end regions are shown in Figs 3(a) and (b). The peak intensity in TMB is 0.14 K. The emission line can be traced along the inverse-S-like structure from the south-east end towards the north-west end, with the central velocity of the line shifting from −53 towards 68 km s−1. The reader is referred to Wilson et al. (2012) for the velocity field (moment 1) and the velocity dispersion (moment 2) maps of the galaxy.
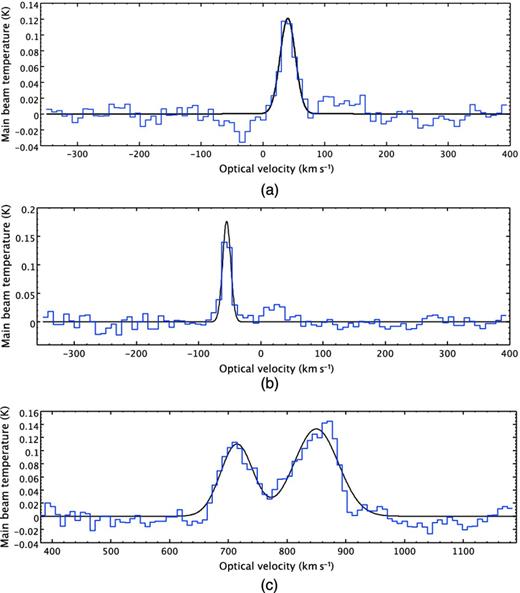
12CO J = 3→2 spectra, on the main-beam antenna temperature (Tmb) scale, of the brightest pixels in NGC 2976 and NGC 3351, smoothed to 10 km s−1. All spectra are overlaid with Gaussian fits. The central velocity of spectrum (a) is fitted at 40.3 km s−1, with a peak temperature of 0.12 K and FWHM of 30.0 km s−1. Spectrum (b) has a central velocity of −51.8 km s−1, with a peak temperature of 0.14 K and FWHM of 15.0 km s−1. Spectrum (c) has peak temperatures of 0.12 and 0.14 K, with the lower peak velocity at 715 km s−1 and higher peak velocity at 850 km s−1. The FWHM is 72.4 km s−1 for the lower peak and 94.6 km s−1 for the higher peak. (a) North-west bright end region of NGC 2976 at RA 9:47:08.1 Dec +67:55:50.2 with σ = 0.012 K. (b) South-east bright end of NGC 2976 at RA 9:47:23.6 Dec +67:54:01.2 with σ = 0.013 K. (c) Central bright region of NGC 3351 at RA 10:43:57.6 Dec +11:42:13.9 with σ = 0.012 K.
NGC 3351 has a dominant circumnuclear region detected in all wavebands. The distribution of the 12CO J = 3→2 integrated intensity across the galactic region displays a huge contrast between the dominant centre and the surrounding area. Only a fraction of the area around the southern part of the |$2\,\text{arcmin}$| ring is detected in our 12CO J = 3→2 map. The signal from the northern part of the ring is weak and therefore we do not trace the entire ring structure. The bar that is visible in the optical image is not traced in our 12CO J = 3→2 map either.
The complex structure to the south-west of the nucleus, between the centre of the galaxy and the |$2\,\text{arcmin}$| ring, only shows up in our 12CO J = 3→2 map. The structure extending from the nucleus towards the southern ring on the east also seems to be offset from the detection region in the NRO 12CO J = 1→0 map. However, this south-east complex and the branch extending slightly towards the north-west are in fact tracing the dust lane (Swartz et al. 2006) surrounding the nuclear region. These dust lanes are visible in the single-filter optical image,10 and they extend along the leading edge of a bar that is oriented at an angle of 110° east of north. From the IRAC 3.6 μm and the optical image, this bar terminates at the |$2\,\text{arcmin}$| ring, with faint spiral arms extending beyond the ring. As well as the double ring structure (see Section 2), NGC 3351 has an interesting double bar feature, too. An inner bar terminating at the |$15\,\text{arcsec}$| ring is detected in the BIMA 12CO J = 1→0 observation (Helfer et al. 2003). This |$15\,\text{arcsec}$| bar is almost perpendicular to the outer |$2\,\text{arcmin}$| bar, but is too small to be resolved at the resolution of HARP-B.
The 12CO J = 3→2 emission line near the central region of NGC 3351 exhibits a prominent twin peak feature, as depicted in Fig. 3(c). This feature points to the rotation of the |$15\,\text{arcsec}$| ring and the inflow/outflow of gas within the inner bar. Each peak has a rather broad, ∼70–90 km s−1 half-power line width, with a peak intensity of 0.13 K.
R31 line ratio and molecular gas mass
To estimate the H2 molecular gas mass using the CO-to-H2 conversion factor (XCO), one often uses the 12CO J = 1→0 transition. However, as Greve et al. (2005) point out, the 12CO J = 1→0 line, which includes emission from the more diffuse molecular gas, does not trace star formation on a one-to-one basis. The 12CO J = 3→2 emission instead correlates almost linearly with the global SFR over five orders of magnitude (e.g. Iono et al. 2009). Hence, to derive M|$_{{\rm H_2}}$| from the warmer and denser gas region, where 12CO J= 3→2 is thermalized, the ratio between 12CO J = 3→2 and 12CO J = 1→0 is important. For this purpose, we use the R31 map produced using the steps outlined in Section 3.1.1.
In Fig. 4(a), we plot the distribution of R31 across the disc of NGC 3351. Averaging R31 across the entire galaxy disc, we obtain a global mean ratio of 0.49 ± 0.03. This value agrees within ∼20 per cent with the R31 value obtained by comparing our map with the single-beam 12CO J = 1→0 observations, which are obtained from a central pointing on the galaxy. For example, using the 12CO J = 1→0 data from Sage (1993), we compute a ratio of 0.48 ± 0.03 for NGC 3351. The higher R31 observed near the complex that extends towards the south-west of the centre of NGC 3351 is the direct consequence of the offset in the detection of 12CO J = 3→2 and 12CO J = 1→0, as explained in Section 4.
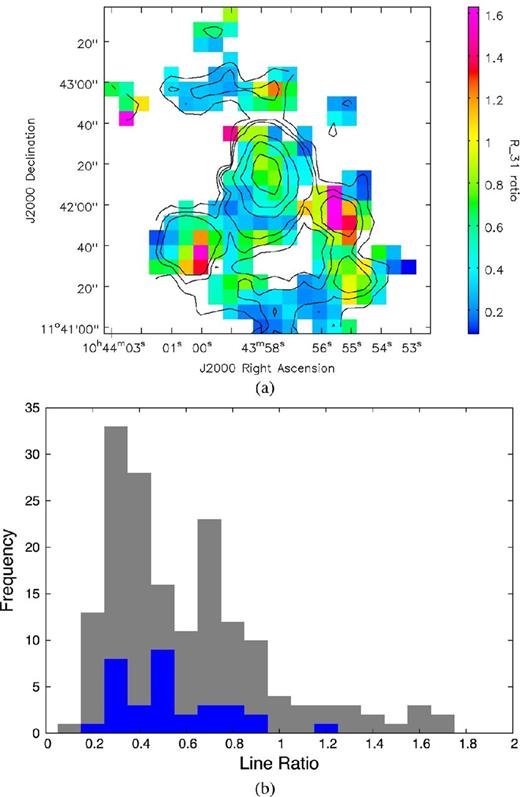
Panel (a) shows the R31 ratio map for NGC 3351 constructed using the 12CO J = 1→0 map from the NRO Atlas. The grey contour line represents the 12CO J = 3→2 contour map to show the position of the ratio map relative to the galaxy. Panel (b) shows the distribution of the value of R31 across the galaxy. The grey histogram shows the pixel count when including all the pixels within the ratio map, whereas in the blue histogram we discard pixels within the ratio map with signal-to-noise ratio (SNR) less than 2. (a) Ratio map. (b) R31 distribution.
Fig. 4(b) shows the variation of the R31 ratio within NGC 3351. The observed range of R31 values, mostly between 0.3 and 0.8, is similar to the range of global values obtained for the 28 nearby galaxies studied by Mauersberger et al. (1999) (0.2–0.7), and also similar to the range (0.4–0.8) observed in individual giant molecular clouds (GMCs) in M33 (Thornley & Wilson 1994; Wilson, Walker & Thornley 1997). We note that similar variations in R31 have been seen in other galaxies reported so far from the NGLS (Wilson et al. 2009; Bendo et al. 2010; Warren et al. 2010; Irwin et al. 2011; Sánchez-Gallego et al. 2011).
In Fig. 5, we plot R31 as a function of |$I_{{\rm CO(1\text{--}0)}}$|, |$I_{{\rm CO(3\text{--}2)}}$| and the SFR surface density. We see only very weak correlation between the |$I_{{\rm CO(1\text{--}0)}}$| line brightness and R31, indicating a very weak correlation in the spatial distribution of the total molecular gas mass, as traced by |$I_{{\rm CO(1\text{--}0)}}$|. We do, however, note a correlation between R31 and |$I_{{\rm CO(3\text{--}2)}}$|, indicating that the |$I_{{\rm CO(3\text{--}2)}}$| line is bright where the line ratio is largest. This might also explain the very weak correlation between the R31 and the total molecular gas mass traced by |$I_{{\rm CO(1\text{--}0)}}$|. The area with the bright 12CO J = 3→2 line indicates an area with denser gas, hence inevitably increasing the total molecular gas mass traced by |$I_{{\rm CO(1\text{--}0)}}$|, as the less dense molecular gas is gravitationally attracted to the dense region. Plotting R31 against the SFR surface density maps in the rightmost panel of Fig. 5 reveals a weak correlation (ρ = 0.44 ± 0.14). It appears that for NGC 3351, the warmer denser gas traced by high R31 ratios is reasonably well correlated with the star formation activity, on the spatial scales set by the pixel size of the map (108.9 × 10³ pc2).
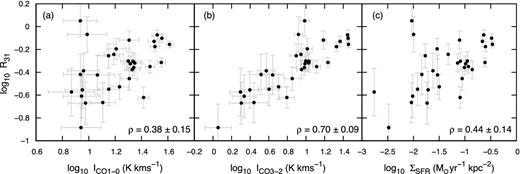
Correlation of R31 (with SNR > 2) with 12CO J = 1→0, 12CO J = 3→2 and SFR surface density, respectively, for NGC 3351. The Pearson correlation coefficient (ρ) is listed at the bottom left of each panel.
We now investigate the effect of various R31 values on |$M_{{\rm H_2}}$|. First, we assume a generic line ratio of 0.6, which is a typical ratio appropriate for the molecular gas in Galactic and extragalactic GMCs (Wilson et al. 2009). Israel (2008) also found similar line ratios (0.6 ± 0.13) from observations of 15 nearby galaxies with modest starbursts. Secondly, we use the global mean ratio of 0.49 for NGC 3351, calculated directly from the present observations. The M|$_{\rm H_{2}}$| derived using the global mean R31 value (0.49 ± 0.03) averaged across the disc of NGC 3351 is (3.3 ± 0.4) × 108 M⊙ and agrees well (within the errors) with the value estimated using R31 = 0.6 from Wilson et al. (2009), which results in |$M_{{\rm H_2}}=$| (2.7 ± 0.3) × 108 M⊙. Likewise for NGC 2976, using the Wilson et al. (2009) value, we compute |$M_{\rm H_{2}}$| to be (0.27 ± 0.04) × 108 M⊙ (we have not derived the R31 value for NGC 2976 due to the lack of calibrated 12CO J = 1→0 data from BIMA as explained previously). These estimates for the warmer gas (based on 12CO J = 3→2 data) are typically lower by a factor of 2–3 than the |$M_{{\rm H_2}}$| based on lower-J12CO data [e.g. |$M_{{\rm H_2}}=8.14 \times 10^8$| M⊙ for NGC 3351 and |$M_{{\rm H_2}}=0.61 \times 10^8$| M⊙ as reported by Leroy et al. (2009) using their 12CO J = 2→1 HERACLES data] which traces more diffuse and cooler gas. We thus conclude that our estimates of the warm and denser gas (based on 12CO J = 3→2 data) are fairly insensitive against various R31 values.
Molecular gas mass and ΣSFR
In this section, we investigate how the ratio H2/H i (which we denote as Rmol) varies as a function of the ΣSFR in two different environments, an H i-rich dwarf (NGC 2976) and an H2-dominated galaxy (NGC 3351). We use the |$M_{{\rm H_2}}$| values computed in Section 4.1 based on the generic R31 = 0.6 line ratio.
In Fig. 6, we plot the ΣSFR as a function of the surface density of H2 [|$\Sigma _{\rm H_2}$| in panel 6(a)], surface density of total gas mass [|$\Sigma _{\rm H\,{\small I}+{\rm H_2}}$| in panel 6(b)] and the ratio of H2 to H i [Rmol in panel 6(c)]. In the case where 12CO J = 3→2 has been used to derive |$M_{{\rm H_2}}$|, the data are shown as red circles and blue squares for NGC 3351 and NGC 2976, respectively. For comparison, we also show the distribution of |$M_{{\rm H_2}}$| based on 12CO J = 1→0 which is applicable only in the case of NGC 3351 (yellow circles). Each point in these diagrams represents the corresponding quantity calculated within an area of 15.6 × 10³ pc2 for NGC 2976 and 108.9 × 10³ pc2 for NGC 3351 (which is the pixel size of our 12CO J = 3→2 maps). The surface densities of both molecular and atomic gas are calculated directly by dividing the gas mass estimated within that single pixel by the corresponding pixel area, taking into account the inclination of the galaxy. We find no correlation between the H i surface density (|$\Sigma _{\rm H\,{\small I}}$|) and ΣSFR; hence, we have not plotted it here, although we note that most pixels have |$\Sigma _{\rm H\,{\small I}}$| surface densities below 10 m⊙ pc−2, as seen in Schruba et al. (2011) and Leroy et al. (2008).
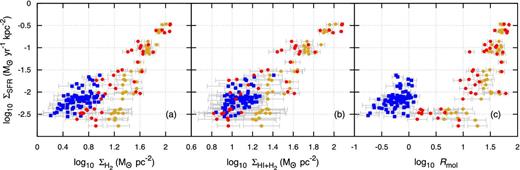
SFR density as a function of different gas phases: (left) H2 only, (centre) H i+H2 and (right) H2-to-H i ratio. Each point in these diagrams represents a single pixel corresponding to the pixel size of our 12CO J = 3→2 map. Pixels from NGC 2976 are plotted as blue squares, while regions from NGC 3351 are represented by red circles. The H2 gas mass for both of these data sets was derived from our 12CO J = 3→2 data, whereas the yellow diamond points represent the pixels from NGC 3351 in which the H2 gas mass was derived from the NRO 12CO J = 1→0 data.
Fig. 6(a) shows that a tight correlation exists between ΣSFR and H2 surface density based on 12CO J = 3→2 data for NGC 3351 (power-law index n = 1.53). A similar trend is seen in Fig. 6(b) where ΣSFR is plotted as a function of |$\Sigma _{\rm H\,{\small I}+{\rm H_2}}$| (n = 1.65). However, when 12CO J = 1→0 data are used (yellow circles), then the slope of the correlation becomes steeper (n = 2.46 for |$\Sigma _{\rm H_2}$| and n = 2.75 for |$\Sigma _{\rm H\,{\small I}+{\rm H_2}}$|, respectively). We suggest that the difference in slopes might be due to the fact that the diffuse areas where 12CO J = 1→0 originates may not be directly related to active star formation.
In Fig. 6(c), we plot ΣSFR as a function of Rmol. This plot clearly shows that NGC 2976 is mainly H i dominated, whereas NGC 3351 is H2 dominated. The pixel distribution for NGC 3351 shows a trend where higher Rmol values correspond to higher values of ΣSFR. We suggest that this indicates that active star formation takes place in these areas (since there is more available H2 to fuel star formation). No such trend is seen in NGC 2976. The power-law relation between Rmol and ΣSFR is not surprising given the Schmidt–Kennicutt relation (Kennicutt 1989) that links areas of high H2 concentration with higher rates of star formation (this relation is also reflected in Fig. 6a). Nevertheless, one would expect that the higher the H2-to-H i ratio, the higher is the rate of star formation (i.e. a tight power-law relation) if H i does not contribute to star formation activity. But we do not see very distinctive evidence here. This might be due to the narrow dynamic range to fully sample the Rmol parameter space, or it could potentially show that the role of H i in star formation cannot be completely ignored (Fumagalli & Gavazzi 2008; Leroy et al. 2008; Fumagalli et al. 2009; Glover & Clark 2012). In fact, as shown in Fig. 7(a), higher values of Rmol do indeed correlate with higher star formation efficiency SFE(H i) (SFR surface density per unit H i gas surface density), especially for NGC 3351.
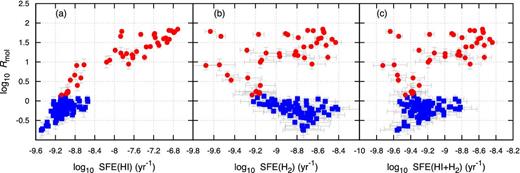
Rmol as a function of different star formation efficiencies: (left) SFE(H i), (centre) SFE(H2) and (right) SFE(H i+H2). Each point in these diagrams represents a single pixel corresponding to the pixel size of our 12CO J=3→2 map. Pixels from NGC 2976 are plotted as blue squares, while regions from NGC 3351 are represented by red circles.
However, this linear relationship between SFE(H i) and Rmol is not seen with the SFE(H2) (which is defined as the SFR surface density per unit H2 gas surface density), nor with SFE(H i+H2) (defined as the SFR surface density per unit neutral gas surface density), as shown in Figs 7(b) and (c). A further investigation collecting all the SINGS galaxies in the NGLS would be very instructive in this case.
Correlation with PAH emission
In both Figs 1 and 2, the large structures traced by 12CO J = 3→2 appear to match those seen in the PAH 8 μm image. The two bright end regions of NGC 2976 can be seen in both wavebands. The ratio between the surface brightness of these bright end regions and that at the centre of the galaxy is larger in the PAH 8 μm image, and the weak inverse-S-shape structure that was visible in the 12CO J = 3→2 map appears to show regions of stronger emission in the PAH 8 μm map as well. There is, however, a difference in the small-scale structures among these images. One example is the small structure directly to the south of the northern bright end region in the 12CO J = 3→2 map (see contour at RA 09:47:10 and Dec. +67:55:30 of Fig. 1) which does not have a comparable counterpart in the PAH 8 μm image.
The emission from the central circumnuclear ring region of NGC 3351 dominates the brightness map in all three wavebands. The |$2\,\text{arcmin}$| ring structure is clearly seen in the PAH 8 μm image. This ring structure is only partially detected in the 12CO J = 3→2 map. We note that the areas that were detected here do not seem any brighter in the PAH 8 μm image.
One might expect that 12CO J = 3→2, which is excited in the warm and dense molecular gas regions nearer to the star formation sites, would have a high spatial correlation with PAH emission, if the PAH emission is connected to star formation activity. Regan et al. (2006) studied the radial distribution of the 8 μm emission and the 12CO J = 1→0 emission for 11 disc galaxies and found a high spatial correlation between them. Bendo et al. (2010) compared the radial profiles of PAH 8 μm surface brightness to the 12CO J = 3→2 in NGC 2403 and found that the scalelengths in both cases are statistically identical. But their examination in sub-kpc-scale regions within the galaxy revealed that 12CO J = 3→2 and PAH 8 μm surface brightness seem to be uncorrelated. Here we further investigate this correlation for NGC 2976 and NGC 3351 by comparing the radial profiles of the 12CO J = 3→2 emission to the PAH 8 μm surface brightness.
Fig. 8 shows the radial profile of PAH 8 μm and the 12CO J = 3→2 surface brightness for both NGC 2976 and NGC 3351. The general shapes appear to match in both galaxies; however, on smaller spatial scales the agreement is less apparent.
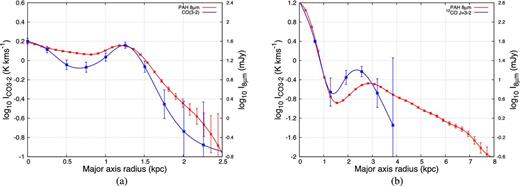
Comparison of the 12CO J = 3→2 radial profile with that of Spitzer IRAC 8 μm for both NGC 2976 and NGC 3351. 12CO J = 3→2 intensity is in K km s−1 (blue, left axis) and PAH 8 μm is in mJy (red, right axis). All data were convolved with kernels that match the PSF of 12CO J = 3→2 data. (a) NGC 2976. (b) NGC 3351.
The scalelengths, defined as the radial distances where the intensity drops by 1/e from the peak intensity, for NGC 2976 are 1.65 and 1.85 kpc for the 12CO J = 3→2 and PAH 8 μm emission, respectively. These scalelengths are larger than the two bright end regions which correspond to the local maxima at ∼1.3 kpc away from the centre of the galaxy. Beyond ∼1.3 kpc, both emissions decay rapidly with almost the same rate. The ratio between the peak brightness of the two bright end regions and that at the galaxy centre, and the position of these bright end regions, is similar in both radial profiles. This might suggest that within high surface brightness regions, both components correlate better compared to lower brightness regions. Bendo et al. (2010) examined this relation in NGC 2403 at the sub-kpc scale and found a similar trend. In their plot,11 it appears that both indicators only overlapped in the area where the 12CO J = 3→2 intensity is higher than 1.0 K km s−1 and PAH 8 μm surface brightness is higher than 2.0 MJy sr−1.
Within the central ∼1 kpc of NGC 3351, the two radial profiles follow each other closely; this is likely to be due to the resolution limit imposed by the HARP-B beam size (FWHM of ∼660 pc at a distance of 9.33 mpc). The PSFs for both data have been convolved to the same resolution and the galaxy centre contains a bright source that is unresolved at the resolution of 14.5|$\,\text{arcsec}$|. Away from the central region, the two profiles do not trace each other well anymore. Note that the ratio of the |$2\,\text{arcmin}$| ring-to-nucleus intensity of the 12CO J = 3→2 is higher than the PAH 8 μm profile. Outside the |$2\,\text{arcmin}$| ring, the 12CO J = 3→2 emission decays much faster than the PAH 8 μm emission, the latter extending almost twice as far as the 12CO J = 3→2 profile. As we saw in NGC 2976, this might indicate that the correlation of the two components is better in a higher brightness region in the galaxy. But again, the detection of 12CO J = 3→2 in this region is too faint to reach a definite conclusion.
To further examine this relation, we compare both detections pixel by pixel and plot their correlation in Fig. 9, using only the pixels detected within our 12CO J = 3→2 map. Again, the PAH 8 μm map is convolved and re-gridded to match the resolution of our 12CO J = 3→2 map. Note that due to the difference in distance, each point within this plot corresponds to an area of 15.6 × 10³ pc2 for NGC 2976 and 108.9 × 10³ pc2 for NGC 3351. As with the radial profile comparison, this pixel-by-pixel approach seems to show that both kinds of emission are quite well correlated globally. However, there seems to be a larger scatter at the higher surface brightness end of the plot, and the correlation seems to break down at log LCO3 → 2 < 4.5. This seems to agree with the argument from Bendo et al. (2010) that this correlation would break down at lower intensity or smaller spatial scales. It would be interesting to further examine this relation with a larger sample of galaxies to determine where this correlation begins to fail.
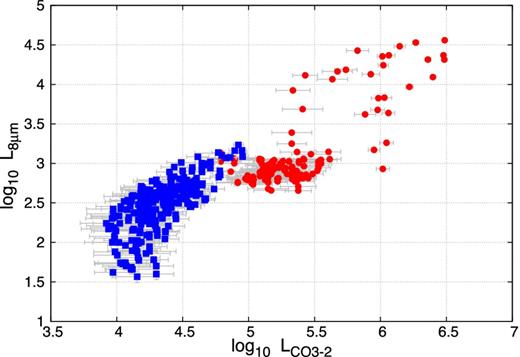
Pixel-by-pixel comparison of the 12CO J = 3→2 luminosity with the PAH 8 μm luminosity. Each red circle represents a pixel from NGC 3351, while each blue square corresponds to a single pixel in the NGC 2976 map.
In order to determine whether this relationship only holds for these two galaxies, we examined all the SINGS galaxies within the NGLS to see if NGC 2976 and NGC 3351 are typical of the entire sample. The other field and Virgo galaxies within the NGLS samples were not included here, as they lack the corresponding PAH 8 μm data from the SINGS. In Fig. 10, we plot the total12CO J = 3→2 luminosity against the total PAH 8 μm luminosity for NGC 2976 and NGC 3351, together with 23 SINGS galaxies that have 12CO J = 3→2 detected. The luminosity values are tabulated in Table 3. The 12CO J = 3→2 maps of these 23 galaxies are obtained from the early release of the NGLS data set (Wilson et al. 2012). The PAH 8 μm maps are obtained from the same source as described in Section 2.1.
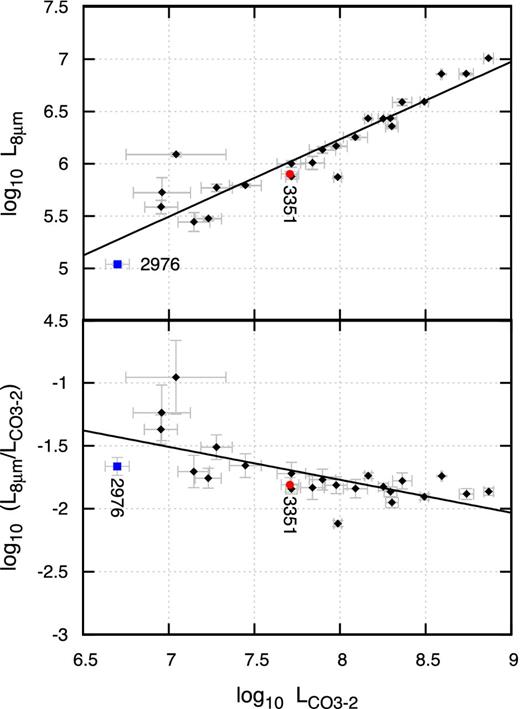
Correlation of the total integrated PAH 8 μm luminosity and the total integrated 12CO J = 3→2 luminosity of the 25 SINGS galaxies in the NGLS samples.
Total luminosity of PAH 8 μm and 12CO J = 3→2 of 25 SINGS galaxies within the NGLS samples.
| Galaxy | Distance | LPAH 8 μm | |$L_{\rm CO(3\text{--}2)}$| |
|---|---|---|---|
| (Mpc) | (MJy pc2) | (×107 K km s−1 pc2) | |
| NGC 0628 | 7.3 | 0.99 ± 0.07 | 5.2 ± 1.0 |
| NGC 0925 | 9.1 | 0.38 ± 0.15 | 0.9 ± 0.2 |
| NGC 2403 | 3.2 | 0.30 ± 0.04 | 1.7 ± 0.3 |
| NGC 2841 | 14.1 | 1.22 ± 0.04 | < 1.1 |
| NGC 2976 | 3.6 | 0.11 ± 0.03 | 0.50 ± 0.08 |
| NGC 3031 | 3.6 | 0.53 ± 0.33 | 0.91 ± 0.35 |
| NGC 3034 | 3.6 | 7.12 ± 0.01 | 39.2 ± 0.4 |
| NGC 3049 | 22.7 | 0.26 ± 0.21 | 1.4 ± 0.3 |
| NGC 3184 | 11.1 | 1.46 ± 0.04 | 9.5 ± 1.4 |
| NGC 3198 | 13.7 | 1.01 ± 0.14 | 6.9 ± 1.1 |
| NGC 3351 | 9.3 | 0.79 ± 0.06 | 5.1 ± 0.6 |
| NGC 3521 | 7.9 | 2.53 ± 0.01 | 17.9 ± 1.2 |
| NGC 3627 | 9.4 | 3.86 ± 0.01 | 31.1 ± 1.7 |
| NGC 3938 | 14.7 | 1.65 ± 0.05 | 12.3 ± 2.0 |
| NGC 4254 | 16.7 | 10.06 ± 0.02 | 73.8 ± 4.8 |
| NGC 4321 | 16.7 | 7.14 ± 0.02 | 54.7 ± 5.3 |
| NGC 4559 | 9.3 | 0.58 ± 0.08 | 1.9 ± 0.4 |
| NGC 4569 | 16.7 | 2.25 ± 0.04 | 20.1 ± 1.7 |
| NGC 4579 | 16.7 | 1.34 ± 0.07 | 7.9 ± 1.4 |
| NGC 4631 | 7.7 | 2.67 ± 0.02 | 14.6 ± 0.7 |
| NGC 4736 | 5.2 | 0.75 ± 0.05 | 5.2 ± 0.4 |
| NGC 4826 | 7.5 | 0.74 ± 0.02 | 9.7 ± 0.5 |
| NGC 5033 | 16.2 | 3.60 ± 0.07 | 23.1 ± 3.0 |
| NGC 5055 | 7.9 | 2.75 ± 0.02 | 19.7 ± 1.7 |
| UGC 05720 | 25.0 | 0.58 ± 0.04 | 2.8 ± 0.6 |
Clearly, the correlation of the two indicators is tight. There seems to be an approximately linear relation between the two, with |$\log L_{\rm 8\,\mu m} \approx (0.74\pm 0.06)\log I_{\rm CO(3\text{--}2)} - 0.32$|. The Pearson correlation coefficient is as high as 0.97, with both NGC 2976 and NGC 3351 lying close to the best-fitting line. To investigate whether this tight relation is not entirely dominated by the strong nuclear emission regions, we made a similar plot of the median luminosity instead of the total luminosity and found that the high correlation still holds.
Even though both 12CO J = 3→2 and PAH 8 μm are believed to be linked to star formation, their origins within the ISM and their fundamental excitation mechanisms are different (e.g. Young & Scoville 1991; Tielens 2008). The 8 μm emission originates from PAHs found near the stars, in particular in the photospheres of asymptotic giant branch stars (Tielens 2008), while molecular CO is formed on the surface of interstellar dust grains. The surface brightness of PAH 8 μm emission is mostly proportional to the number of FUV photons and the number density of PAH molecules. The 12CO J = 3→2 intensity, on the other hand, is controlled mainly by the collision rate with the molecular hydrogen, the temperature of the gas and the density of molecular hydrogen. It is thus important to understand why they correlate so well in a global environment.
One possible explanation is that there is a spatial coexistence of the PAH molecules and molecular CO in photodissociation regions (PDR), although not at specific sub-kpc locations within individual clouds. At the front of a PDR, the UV flux from hot stars or the interstellar radiation field excites the PAH molecules and heats the small grains in the ISM. This is responsible for the generation of intense radiation from PAHs and the continuum dust emission in the mid-infrared. CO rotational transitions are generally believed to be generated from regions that reside deeper in the PDR (Hollenbach & Tielens 1999). In this region, the UV source is still strongly photodissociating species like OH and H2O, but is weaker compared to the ionization front, and thus molecular hydrogen and CO start to form in this region. Given a certain amount of UV photons, a higher density of PAHs would absorb a larger portion of these stellar fluxes, and reduce the photodissociation of CO molecules, hence resulting in a positive correlation of the two constituents. Also, both PAHs and molecular CO would not exist in high UV radiation region, as both species would be dissociated.
The same scenario can be applied to the star-forming regions within the molecular clouds. If the 12CO J = 3→2 intensity indicates the amount of gas fuelling star formation in the core, it could be approximately proportional to the number of UV photons radiated by these newly born O and B stars. If a linear fraction of these photons is absorbed by the PAHs, their surface brightness will then be approximately proportional to the 12CO J = 3→2 intensity.
There are other alternative explanations in the literature, for example the association between the PAH emission and the cold dust (Haas et al. 2002; Bendo et al. 2008). If molecular gas is associated with cold dust, then the PAH and 12CO J = 3→2 would be expected to be associated with each other as well. In general, we find that the 12CO J = 3→2 luminosity does correlate well with PAH 8 μm luminosity at large scales, but this correlation might not hold for smaller sub-kpc scale.
SUMMARY AND CONCLUSIONS
We have presented the 12CO J = 3→2 maps of NGC 2976 and NGC 3351, obtained using HARP-B on the JCMT. We compared our observations to the optical, 12CO J = 1→0, PAH 8 μm, H i and ΣSFR maps constructed using a combination of 24 μm and FUV data. 12CO J = 3→2 emission from NGC 2976 was strong at both ends of the galaxy's major axis, whereas in NGC 3351 the emission peaks in the nuclear region. NGC 2976 showed a large-scale structure that was seen only in the 12CO J = 2→1 image, but not in other wavebands included in this paper, due to the coarse resolution of the 12CO J = 3→2 and 12CO J = 1→0 maps. In contrast, the dominant circumnuclear region in NGC 3351 was visible in all waveband maps presented here. However, the prominent |$2\,\text{arcmin}$| ring structure was only weakly detected in our 12CO J = 3→2 map.
We combined our 12CO J = 3→2 data with 12CO J = 1→0 data from various sources to derive the R31 line ratio (for NGC 3351). The ratio values we obtained were within the ranges derived from various nearby galaxy surveys. We then computed |$M_{{\rm H_2}}$| using the derived R31 as well as the generic value 0.6 from Wilson et al. (2009). We found that |$M_{{\rm H_2}}$| estimates are robust against the value of R31 used.
We further examined the correlation between ΣSFR and surface density of H2 mass and neutral hydrogen gas mass. We found that the ΣSFR correlates better with the 12CO J = 3→2 emission. We used the H i data from THINGS to derive the H2-to-H i ratio and compared it with the SFE(H i). We found that although NGC 2976 is H i dominated and NGC 3351 is an H2-dominated galaxy, they both show a correlation between Rmol and SFE(H i), which implies that the role of H i in star formation cannot be excluded.
We have also studied the correlation between the 12CO J = 3→2 and PAH 8 μm surface brightness as both are prominent indicators linked to star formation activity. We first investigated their relation within NGC 2976 and NGC 3351 using both the radial distribution of the surface brightness and a pixel-by-pixel comparison. We found that they correlate well in the higher surface brightness regions. We further studied the global correlation between the total luminosities of the two physical parameters using the data from all 25 SINGS galaxies within the NGLS and reached a similar conclusion. We suggest that this could be the result of the coexistence of both 12CO and PAH molecules in the PDR regions, provided that the lifetimes of both species are matched. In conclusion, we suggest that this correlation is high at large spatial scales, but at smaller sub-kpc scales, the correlation may break down.
The D.Phil. study of BKT at the University of Oxford was supported by the Royal Family of Malaysia through the King Scholarship Award. The work of JL was supported by a Post-Doctoral Research Assistantship from the UK Science & Technology Facilities Council (STFC). The research work of GJB was funded by the STFC, and CDW and BEW were supported by grants from NSERC (Canada). JHK acknowledges financial support to the DAGAL network from the People Programme (Marie Curie Actions) of the European Union's Seventh Framework Programme FP7/2007-2013/ under REA grant agreement number PITN-GA-2011-289313. This research has made use of the NASA/IPAC Extragalactic Database (NED) which is operated by the Jet Propulsion Laboratory, California Institute of Technology, under contract with the National Aeronautics and Space Administration. The travelling grants to the JCMT for observations are supported by STFC. We would like to thank Bruce Draine and Pauline Barmby for helpful discussions. We would also like to thank all of the staff at the JCMT for their support in carrying out our observations. We would like to thank the reviewer for all the constructive suggestions.
The James Clerk Maxwell Telescope is a 15 m single-dish submillimetre telescope operated by the Joint Astronomy Centre (JAC) on behalf of the Science and Technology Facilities Council (STFC) of the United Kingdom, the Netherlands Organisation for Scientific Research and the National Research Council of Canada. It is located at Mauna Kea, Hawai'i.
Starlink is maintained by the Joint Astronomy Centre (JAC) (http://www.starlink.ac.uk).
Fig. 14 in Bendo et al. (2010).
