


Abstract
We present a detailed analysis of absorption systems along the line of sight towards QSO PKS 0237−233 using a high-resolution spectrum of signal-to-noise ratio ∼60–80 obtained with the Ultraviolet and Visual Echelle Spectrograph mounted on the Very Large Telescope (VLT/UVES). This line of sight is known to show a remarkable overdensity of C iv systems that has been interpreted as revealing the presence of a supercluster of galaxies. A detailed analysis of each of these absorption systems is presented. In particular, for the zabs = 1.6359 (with two components of log NHI [cm−2] = 18.45, 19.05) and zabs = 1.6720 (log NHI = 19.78) sub-damped Lyα systems (sub-DLAs), we measure accurate abundances (resp. [O/H] = −1.63 ± 0.07 and [Zn/H] = −0.57 ± 0.05 relative to solar). While the depletion of refractory elements on to dust grains in both sub-DLAs is not noteworthy, photoionization models show that ionization effects are important in a part of the absorbing gas of the sub-DLA at zabs = 1.6359 (H i is 95 per cent ionized) and in a part of the gas of the sub-DLA at zabs = 1.6720. The C iv clustering properties along the line of sight is studied in order to investigate the nature of the observed overdensity. We conclude that despite the unusually high number of C iv systems detected along the line of sight, there is no compelling evidence for the presence of a single unusual overdensity and that the situation is consistent with chance coincidence.
1 INTRODUCTION
Metal absorption lines seen in the spectra of high-redshift quasars are thought to be produced by gas clouds associated in some way with galaxies or their progenitors. This hypothesis is supported in particular by the amplitude and scale of their clustering which are consistent with those expected from galaxies (e.g. Scannapieco et al. 2006). A few lines of sight have been known for long to contain an unusually large number of absorption systems and the reason for these puzzling observations has never been fully elucidated.
One instance of such superclustering is seen towards the two quasars Tol 1037−2703 and Tol 1038−2712 (Jakobsen et al. 1986) which have an angular separation of 17.9 arcmin in the plane of the sky, corresponding to a proper separation of 4.4 h−1 Mpc at z ∼ 2. The spectra of the quasars each exhibit at least five C iv absorption complexes over the narrow redshift range 1.88 ≤ z ≤ 2.15, representing a highly significant overdensity in the number of absorbers above that expected from Poisson statistics (Dinshaw & Impey 1996). One complex lies at the same redshift along both QSO lines of sight and the rest are coincident to within v ≤ 2000 km s−1. The fact that there are similar absorption features at the same redshift in the spectra of both these quasars signals that the two lines of sight may actually be probing the same absorbing structure. The preferred explanation for the overdensity of C iv absorption systems is that the two lines of sight are passing through material associated with an intervening supercluster (Jakobsen et al. 1986; Sargent & Steidel 1987; Lespine & Petitjean 1997; Srianand & Petitjean 2001) but this concentration of objects has never been confirmed directly. It is interesting to note that C iv clustering properties are very sensitive to the choice of the column density threshold (Scannapieco et al. 2006).
Another example of an overdensity of absorption systems is observed along the line of sight to the quasar PKS 0237−233. This quasar was first discovered and studied by Arp, Bolton & Kinman (1967). Its absorption spectrum has been the subject of many studies over the years (Burbidge 1967; Greenstein & Schmidt 1967; Bahcall, Greenstein & Sargent 1968; Burbidge, Lynds & Stockton 1968; Boksenberg & Sargent 1975) with three main complexes at zabs = 1.596, 1.657, 1.674. Foltz et al. (1993) searched the field for other QSOs to provide background sources against which the presence of absorption at the same redshifts could be investigated. They concluded that the complex can be interpreted as a real spatial overdensity of absorbing clouds with a transverse size comparable to its extent along the line of sight that is of the order of 30 Mpc.
Heisler, Hogan & White (1989) found significant clustering signal in the distribution of C iv systems out to velocities of Δv ≤ 10 000 km s−1 in a sample of 55 QSOs observed by Sargent, Boksenberg & Steidel (1988). They noted that the clustering signal is dominated by a single large supercluster along the line of sight to PKS 0237−233 spanning a redshift range from z = 1.5959 to 1.6752. More recently, Scannapieco et al. (2006) studied the line-of-sight correlation function of C iv systems using 19 lines of sight observed with the Ultraviolet and Visual Echelle Spectrograph on Very Large Telescope (VLT/UVES). Their sample may not be large enough to conclude about the clustering signal beyond 500 km s−1. Surprisingly, the redshift evolution of the C iv systems has not been studied from large samples provided by e.g. SDSS contrary to what has been done for Mg ii systems. This is probably related to the difficulties in robustly detecting C iv systems at intermediate resolution because the two lines of the doublet are partially blended. Only samples based on high-resolution observations are available (see D'Odorico et al. 2010).
Lines of sight with high overdensities of absorption systems are in any case rare incidences that are worth investigating in more details. In this paper, we study the line of sight towards PKS 0237−233 in great detail, using a high spectral resolution (R = 45 000) and high signal-to-noise ratio (SNR ∼ 60–80) spectrum taken with VLT/UVES and taken during the European Southern Observatory (ESO) Large Programme ‘Cosmic Evolution of the Intergalactic Medium (IGM)’ (Bergeron et al. 2004).
Observations are described in Section 2. Individual systems are discussed in Section 3 and the appendix. Results of fits are analysed in Section 4 using photoionization models. The clustering properties of C iv absorbers are presented in Section 5 and conclusions are drawn in Section 6.
2 OBSERVATIONS
The spectrum of PKS 0237−233 used for this study is of the highest SNR and spectral resolution. It was obtained using the UVES (Dekker et al. 2000) mounted on the ESO Kueyen 8.2 m telescope at the Paranal observatory in the course of the ESO-VLT Large Programme ‘The Cosmic Evolution of the IGM’ (Bergeron et al. 2004). PKS 0237−233 was observed through a 1.0 arcsec slit for ∼12 h with dichroic #1 with central wavelengths adjusted at 3460 and 5800 Å in the blue and red arms, respectively, and for another ∼14 h with dichroic #2 with central wavelengths at 4370 and 8600 Å in the blue and red arms, respectively. The raw data were reduced using the UVES pipeline.1 Individual exposures were air–vacuum corrected and placed in an heliocentric rest frame. Co-addition of the exposures was performed using a sliding window and weighting the signal by the errors in each pixel. Great care was taken in computing the error spectrum while combining the individual exposures. The final combined spectrum covers the wavelength range 3000–10 000 Å. A typical SNR ∼ 60–80 per pixel (of 0.035 Å) is achieved over the whole wavelength range of interest. The detailed quantitative description of data calibration is presented in Aracil et al. (2004) and Chand et al. (2004, 2006). We will use these superb data to make a detailed analysis of the line of sight.
In the following, we used the solar abundances (photospheric abundances), log (X/H)⊙, from Asplund et al. (2009) listed in Table 1 and the metallicity relative to solar of species X, [X/H] = log X/H − log (X/H)⊙.
Solar abundances taken from Asplund et al. (2009).
| Solar abundances in number relative to hydrogen | |||||||||||
|---|---|---|---|---|---|---|---|---|---|---|---|
| Species | O | Si | Mg | S | Fe | Cr | Zn | Mn | Ni | ||
| Log abundance | −3.31 | −4.49 | −4.40 | −4.88 | −4.50 | −6.36 | −7.44 | −6.57 | −5.78 | ||
| Solar abundances in number relative to hydrogen | |||||||||||
|---|---|---|---|---|---|---|---|---|---|---|---|
| Species | O | Si | Mg | S | Fe | Cr | Zn | Mn | Ni | ||
| Log abundance | −3.31 | −4.49 | −4.40 | −4.88 | −4.50 | −6.36 | −7.44 | −6.57 | −5.78 | ||
3 DISCUSSION OF INDIVIDUAL SYSTEMS
This section presents the analysis of absorption profiles for several systems we chose to study in greater detail. The description of the other systems detected in the spectrum of PKS 0237−233 can be found in Appendix A.
To identify the absorption systems, we searched first for Mg ii and C iv doublets. We then identified all metal absorption associated with these systems. Finally, we checked that there is no system left unidentified by this procedure. Overall, we identify 18 absorption systems along this line of sight, three of which are sub-damped Lyα (sub-DLA) systems at zabs ∼ 1.36, 1.63 and 1.67. Sub-DLAs are defined as absorption systems with N(H i) ranging from 1019 to 2 × 10²⁰ (Dessauges-Zavadsky et al. 2003; Péroux et al. 2003).
We use the vpfit2 package to decompose the absorption lines into multiple Voigt profile components. The vpfit package is a least-squares program which minimizes the χ2 when adjusting a multiple Voigt profile model to absorption features. The wavelengths and oscillator strengths are taken from Morton (2003). When fitting the low-ion species (O i, C ii, Si ii, Mg ii, Fe ii), we assumed that they all have the same kinematic structure which means that they arise from the same components having the same Doppler parameters. For the C iv and Si iv profiles, we kept Doppler parameters independent because we noticed that even though their absorption profiles correlate very well, C iv can have broader lines especially in complex profiles (see below and also Fox et al. 2007a,b).
If an absorption is not detected at the wavelength expected from the presence of other species in the same system, a 3σ upper limit is determined. The redshifts of the H i components are fixed to that of metals in the case of sub-DLA systems while in the case of other systems redshifts are considered free parameters.
3.1 zabs = 1.6359
This absorber is a sub-DLA system associated with a number of high- and low-ionization species spanning more than 200 km s−1 including C ii, O i, Mg ii, Mg i, Al ii, Al iii, Fe ii, Si ii, C iv and Si iv. The velocity profiles and vpfit solutions (where applicable) of the H i, low- and high-ion species are illustrated in Fig. 1. The measurements are given in Table 2.
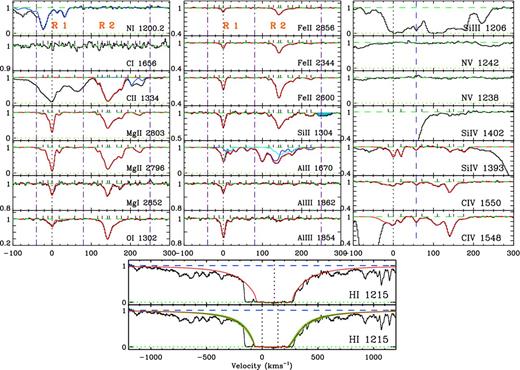
Velocity profiles and vpfit solutions of the species detected in the sub-DLA at zabs = 1.6359. The blue curves are vpfit solutions of absorption from other systems, and the blue shaded region indicates blends with some intervening absorption. Parameters of the fit can be found in Table 2. As illustrated in the lower panel, the single component fit to the damping wings was conducted with the redshift set at z = 1.636 58 while the two-component fit was performed with the redshifts fixed to those of the two metal sub-systems observed at z = 1.635 88 and z = 1.637 17. As can be seen in the figure, the latter solution fits the Lyα profile much better.
Elemental column densities in the zabs = 1.6359 system.
| Low-ion column densities | |||||||||||
|---|---|---|---|---|---|---|---|---|---|---|---|
| z | ΔV (km s−1) | b(km s−1) | log N(Mg ii) | log N(Mg i) | log N(O i) | log N(Fe ii) | log N(Si ii) | log N(Al ii) | log N(Al iii) | log N(C ii) | log N(H i) |
| Region – R1 | |||||||||||
| 1.635 68 | −22.7 | 10.7 ± 0.7 | 11.71 ± 0.01 | ≤10.21 | ≤12.86 | ≤11.22 | ≤12.22 | 10.95 ± 0.07 | ≤10.90 | –a | – |
| 1.635 79 | −10.2 | 2.3 ± 0.2 | 11.94 ± 0.00 | 9.66 ± 0.21 | 12.77 ± 0.04 | 11.26 ± 0.04 | 11.95 ± 0.13 | 11.25 ± 0.02 | 10.80 ± 0.06 | –a | – |
| 1.635 88 | 0.0 | 4.2 ± 0.0 | 12.86 ± 0.00 | 10.83 ± 0.02 | 13.23 ± 0.01 | 12.23 ± 0.00 | 13.01 ± 0.01 | 12.01 ± 0.01 | 11.74 ± 0.01 | –a | 18.45 ± 0.05 |
| 1.636 04 | +18.2 | 5.0 ± 0.2 | 11.76 ± 0.00 | ≤9.93 | 12.73 ± 0.05 | ≤10.43 | 11.67 ± 0.26 | 11.36 ± 0.02 | 10.96 ± 0.05 | –a | – |
| 1.636 39 | +58.0 | 4.3 ± 1.2 | 10.79 ± 0.05 | ≤9.68 | ≤11.98 | ≤10.73 | ≤11.79 | 10.52 ± 013 | 10.49 ± 0.14 | –a | – |
| Region – R2 | |||||||||||
| 1.636 91 | +117.1 | 2.3 ± 0.3 | 11.48 ± 0.01 | ≤9.82 | 12.33 ± 0.09 | 11.26 ± 0.04 | 12.20 ± 0.07 | 10.51 ± 0.14 | ≤10.30 | 12.73 ± 0.06 | – |
| 1.637 01 | +128.5 | 1.7 ± 0.8 | 11.52 ± 0.01 | 9.81 ± 0.14 | 12.25 ± 0.12 | 11.25 ± 0.04 | 12.05 ± 0.10 | 10.88 ± 0.09 | ≤10.15 | 12.83 ± 0.07 | – |
| 1.637 12 | +141.0 | 5.5 ± 0.4 | 12.36 ± 0.00 | 10.81 ± 0.03 | 13.65 ± 0.01 | 12.37 ± 0.01 | 12.72 ± 0.05 | 10.86 ± 0.34 | 10.63 ± 0.18 | 13.52 ± 0.05 | – |
| 1.637 17 | +146.7 | 15.0 ± 0.7 | 12.85 ± 0.00 | 10.71 ± 0.06 | 13.79 ± 0.01 | 12.65 ± 0.01 | 13.30 ± 0.02 | 12.05 ± 0.01 | 10.91 ± 0.14 | 14.01 ± 0.02 | 19.05 ± 0.05 |
| 1.637 33 | +164.9 | 4.8 ± 0.8 | 11.83 ± 0.01 | 10.04 ± 0.11 | 12.67 ± 0.06 | 11.40 ± 0.04 | 12.38 ± 0.06 | 11.24 ± 0.03 | ≤10.53 | 13.05 ± 0.04 | – |
| 1.637 44 | +177.4 | 6.0 ± 0.2 | 12.15 ± 0.00 | 10.46 ± 0.04 | 12.64 ± 0.06 | 11.78 ± 0.01 | 12.42 ± 0.05 | 11.45 ± 0.02 | 10.56 ± 0.13 | 13.25 ± 0.02 | – |
| 1.637 59 | +194.4 | 3.2 ± 1.5 | 10.76 ± 0.05 | ≤9.75 | 11.69 ± 0.43 | 10.45 ± 0.26 | ≤11.37 | 10.50 ± 0.13 | ≤10.26 | –a | – |
| 1.637 76 | +213.7 | 3.9 ± 0.6 | 11.28 ± 0.02 | ≤9.56 | ≤11.92 | 10.86 ± 0.11 | 12.01 ± 0.12 | 10.74 ± 0.08 | ≤10.02 | –a | – |
| 1.637 85 | +224.0 | 6.9 ± 0.4 | 11.85 ± 0.01 | ≤9.93 | 12.29 ± 0.10 | 11.49 ± 0.03 | 12.47 ± 0.05 | 11.19 ± 0.03 | ≤10.24 | –a | – |
| High-ion column densities | |||||||||||
| z | ΔV (km s−1) | Ion (X) | b (km s−1) | log N(X) | z | ΔV (km s−1) | Ion (X) | b (km s−1) | log N(X) | ||
| 1.635 77 | −12.5 | C iv | 22.9 ± 1.0 | 12.87 ± 0.02 | 1.635 77 | −12.5 | Si iv | 22.9 ± 1.0 | 12.00 ± 0.04 | ||
| 1.635 88 | 0.0 | C iv | 5.9 ± 0.4 | 12.17 ± 0.05 | 1.635 88 | 0.0 | Si iv | 5.9 ± 0.4 | 12.13 ± 0.02 | ||
| 1.636 05 | +19.3 | C iv | 4.5 ± 0.3 | 12.15 ± 0.03 | 1.636 05 | +19.3 | Si iv | 4.5 ± 0.3 | 12.07 ± 0.01 | ||
| 1.636 38 | +56.9 | C iv | 4.9 ± 0.5 | 12.22 ± 0.06 | 1.636 38 | +56.9 | Si iv | 4.9 ± 0.5 | 11.63 ± 0.03 | ||
| 1.636 51 | +71.6 | C iv | 11.8 ± 4.2 | 12.01 ± 0.13 | 1.636 51 | +71.6 | Si iv | 11.8 ± 4.2 | ≤11.31 | ||
| 1.636 85 | +110.3 | C iv | 16.0 ± 1.0 | 12.86 ± 0.02 | 1.636 85 | +110.3 | Si iv | 16.0 ± 1.0 | 10.79 ± 0.21 | ||
| 1.637 11 | +139,9 | C iv | 7.6 ± 1.3 | 12.91 ± 0.26 | 1.637 11 | +139.9 | Si iv | 7.6 ± 1.3 | 11.78 ± 0.36 | ||
| 1.637 20 | +150.1 | C iv | 10.6 ± 6.0 | 12.65 ± 0.47 | 1.637 20 | +150. | Si iv | 10.6 ± 6.0 | 11.74 ± 0.39 | ||
| 1.637 42 | +175.1 | C iv | 12.3 ± 1.1 | 12.19 ± 0.04 | 1.637 42 | +175.1 | Si iv | 12.3 ± 1.1 | 12.09 ± 0.02 | ||
aBlended with some features.
In the following, the origin of the velocities are set at z = 1.635 88. The metal absorption features in this sub-DLA are seen in two sub-systems, one within the range [−40, +80] km s−1 (region R1) and another within [+80, +250] km s−1 (region R2). The low-ion absorption lines clearly indicate that the bulk of the neutral gas is located at v ≈ 0 and +140 km s−1 (z = 1.637 17). A damping profile fitted to the Lyman α absorption line, with the redshift at z = 1.636 85 (one-component fit), yields a satisfactory fit to the damping wings for |$N_{\text{H}\,{\small I}} = 1.58 \times 10^{19}$| cm−2 and b = 46.0 km s−1. However, not only the Doppler parameter seems large for a damped system but also part of the absorption is not accounted for at v = −80 km s−1 (upper panel of the representation of H i λ1215 in Fig. 1). We therefore tried to conduct a two-component fit to the Lyα profile, fixing the redshifts of the two components to the redshifts of the two metal sub-systems observed at z = 1.635 88 and 1.637 17. As can be seen in Fig. 1 (lower panel of the representation of H i λ1215), the two-component solution fits the Lyα profile much better than the single-component one. The parameters of the two-component solution are listed in Table 2 (last column). The two components have column densities of log |$N_{\rm H\,{{\small I}}} = 18.45$| and 19.05, respectively.
The metal lines are weak and their fit yields robust column densities. Using the Mg ii and Fe ii absorption profiles, we identified 14 velocity components for the low-ion species. The fit to the Al ii absorption profile (cyan curve in Fig. 1) was performed using the template obtained on Fe ii because it is blended with Al iii (blue curve) at zabs = 1.3647. As can be seen from Fig. 1, the C ii absorption profile as well as the velocity region where N i λ1200.2 is expected are blended with some absorption features in region R1. The N i velocity region −100 ≤ v ≤ +80 km s−1 is contaminated by the Si ii λ1190 absorption of a system at zabs = 1.6574, and the vpfit solution of this Si ii transition is overplotted on the observed data as a blue curve. In region R2, the C ii profile also appears to be blended with the Ni ii λ1317 transition of a sub-DLA at zabs = 1.6720, and the blue curve is the vpfit solution of this Ni ii transition overplotted on the C ii profile. We could however perform a fit of these two profiles in the R2 region.
Absorption by highly ionized gas in this absorber is seen from the C iv and Si iv doublets. N v is not detected and O vi falls outside our wavelength range. The fit to the high-ion species were conducted simultaneously with nine absorption components (Fig. 1). The Si iv λ1402 absorption was excluded from the fit due to severe blending with the Lyα absorption profile of a system at zabs = 2.0422. Moreover, the C iv λ1548 profile also appears to be slightly blended in the blue with the Si ii λ1526 of a sub-DLA at zabs = 1.6720. However, the fit was reasonably successful, yielding |$\chi _{\nu }^2$| = 1.25. All C iv and Si iv measurements are summarized in Table 2.
3.2 zabs = 1.6720
This absorber is also a sub-DLA in which we detect over 40 metal lines from 20 different species. A striking feature of this sub-DLA is the detection of the C i multiplet. The velocity profiles of H i and some of the neutral and singly ionized species seen in this system together with a multicomponent Voigt profile fit are shown in Fig. 2. The low-ion species extend over ≃260 km s−1 in velocity space. Voigt profile fitting to the DLA absorption profile with redshift fixed to that of the strongest low-ion component gives log |$N_{\rm H\,{{\small I}}} = 19.78\pm 0.05$|. The orange and green curves overplotted on the data in the lower panel of Fig. 2 show the Voigt profile fits of this DLA profile. Note that, in this panel, the red curve also contains the contribution of another Lyα absorption profile evident at +300 ≤ v ≤ +420 km s−1 (cyan curve) with log |$N_{\rm H\,{{\small I}}} = 15.0\pm 0.10$|. The redshift of this extra Lyα component corresponds to that of a strong C iv absorption at z = 1.675 26.
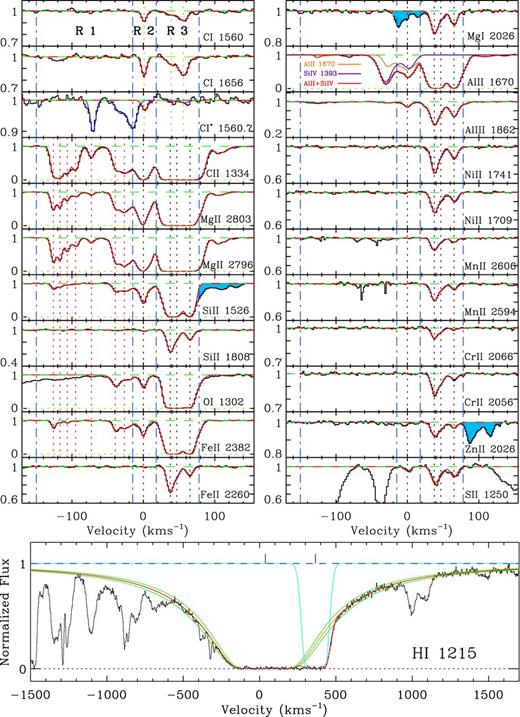
To facilitate the discussion of this sub-DLA, we divide the velocity profiles into three distinct velocity ranges marked as R1, R2 and R3. We identified four absorption components for the R2+R3 velocity ranges based on the fits to the Si ii and Fe ii profiles. In Fig. 2, the blue vertical dot–dashed lines show the boundary of the three velocity ranges whereas the black vertical dashed lines indicate the position of the four absorption components identified in the R2+R3 velocity range. In the R1 velocity range, only C ii, Mg ii, Si ii, O i, Fe ii and Si iii are detected. We found that a minimum of seven individual components were required to optimally fit the absorption features evident in R1. The red vertical dashed lines in Fig. 2 indicate the positions of the absorption components. The red wing of the Si ii λ1526 profile is blended with part of the C iv λ1548 profile of a system at zabs = 1.6359 (blue shaded area in Fig. 2). Note that the Si ii λ1526 and Fe ii λ2382 transitions were only used to fit the absorption visible in the R1 velocity range. The blue shaded area in the Mg i λ2026 (resp. Zn ii λ2026) velocity panel shows absorption from the Zn ii λ2026 (resp. Mg i λ2026) transition of this sub-DLA. As illustrated in Fig. 2, the Al ii λ1670 is also blended with the Si iv λ1393 profile of a system at zabs = 2.2028, so the fit to the Al ii profile was conducted by including the contribution of this Si iv absorption. The parameters of the vpfit solutions for the low- and high-ion species are listed in Table 3. The Mg ii, C ii, Al ii and O i profiles are clearly saturated in R2 and R3, especially in R3, so only lower limits to their column densities are given in Table 3. Note that our column density upper limits are 3σ values.
Elemental column densities for the zabs = 1.6720 sub-DLA.a
| Low-ion column densities | |||||||||||
|---|---|---|---|---|---|---|---|---|---|---|---|
| z | 1.670 88 | 1.670 96 | 1.671 05 | 1.671 15 | 1.671 36 | 1.671 65 | 1.671 76 | 1.672 00 | 1.672 34 | 1.672 42 | 1.672 58 |
| ΔV(km s−1) | −125.7 | −116.7 | −106.6 | −95.4 | −71.8 | −39.3 | −26.9 | 0.0 | +38.1 | +47.1 | +65.1 |
| b(km s−1) | 2.6 ± 0.1 | 2.6 ± 0.2 | 2.6 ± 0.4 | 5.2 ± 0.5 | 5.1 ± 0.5 | 3.1 ± 0.3 | 12.4 ± 0.3 | 5.4 ± 0.0 | 4.8 ± 0.1 | 5.1 ± 1.1 | 5.5 ± 0.2 |
| N(Mg ii) | 12.51 ± 0.01 | 12.39 ± 0.01 | 12.01 ± 0.01 | 11.88 ± 0.02 | 11.60 ± 0.02 | 12.16 ± 0.01 | 12.97 ± 0.00 | ≥13.35 | ≥13.55 | ≥13.55 | ≥13.45 |
| N(Mg i) | – | – | – | – | – | – | – | – b | 12.38 ± 0.01 | 11.94 ± 0.04 | 12.20 ± 0.02 |
| N(C ii) | 13.95 ± 0.03 | 14.56 ± 0.05 | 13.75 ± 0.03 | 13.55 ± 0.01 | 13.01 ± 0.02 | 13.08 ± 0.03 | 13.93 ± 0.01 | ≥14.55 | ≥14.55 | ≥14.55 | ≥14.45 |
| N(O i) | –c | –c | –c | –c | –c | 13.34 ± 0.03 | 13.47 ± 0.03 | 13.50 ± 0.02 | ≥14.85 | ≥14.85 | ≥14.80 |
| N(N i) | – | – | – | – | – | – | – | – | 13.35 ± 0.03 | 12.92 ± 0.03 | 12.80 ± 0.03 |
| N(Fe ii) | 12.00 ± 0.02 | 11.43 ± 0.06 | 11.46 ± 0.06 | 11.12 ± 0.15 | 10.82 ± 0.29 | 12.06 ± 0.02 | 12.49 ± 0.01 | 12.52 ± 0.05 | 14.38 ± 0.00 | 13.87 ± 0.02 | 13.89 ± 0.01 |
| N(Si ii) | 12.46 ± 0.05 | 12.28 ± 0.07 | 11.92 ± 0.14 | 11.78 ± 0.22 | 11.21 ± 0.83 | 12.46 ± 0.05 | 13.08 ± 0.02 | 13.33 ± 0.04 | 14.69 ± 0.00 | 14.23 ± 0.01 | 14.33 ± 0.01 |
| N(Ni ii) | – | – | – | – | – | – | – | ≤11.73 | 13.26 ± 0.01 | 12.77 ± 0.02 | 12.92 ± 0.01 |
| N(Mn ii) | – | – | – | – | – | – | – | ≤10.78 | 12.05 ± 0.01 | 11.54 ± 0.02 | 11.58 ± 0.02 |
| N(Cr ii) | – | – | – | – | – | – | – | ≤11.11 | 12.52 ± 0.01 | 12.15 ± 0.04 | 11.98 ± 0.07 |
| N(Zn ii) | – | – | – | – | – | – | – | ≤10.50 | 11.51 ± 0.02 | 11.22 ± 0.05 | 11.16 ± 0.05 |
| N(S ii) | – | – | – | – | – | – | – | 13.49 ± 0.08 | 14.07 ± 0.02 | 13.76 ± 0.05 | 13.91 ± 0.03 |
| N(Al ii) | – | – | – | – | – | – | – | 11.91 ± 0.03 | ≥13.20 | ≥13.00 | ≥13.10 |
| N(Al iii) | – | – | – | – | – | – | – | 12.05 ± 0.01 | 12.75 ± 0.00 | 12.31 ± 0.01 | 12.41 ± 0.01 |
| High-ion column densities | |||||||||||
| z | ΔV (km s−1) | Ion (X) | b (km s−1) | log N(X) | z | ΔV (km s−1) | Ion (X) | b (km s−1) | log N(X) | ||
| 1.670 72 | −143.6 | C iv | 7.0 ± 2.3 | 12.11 ± 0.14 | 1.675 26 | +365.5 | C iv | 11.2 ± 0.2 | 14.25 ± 0.01 | ||
| 1.670 94 | −119.0 | C iv | 10.1 ± 0.6 | 13.91 ± 0.07 | 1.675 41 | +382.3 | C iv | 5.2 ± 1.1 | 13.07 ± 0.13 | ||
| 1.671 08 | −103.2 | C iv | 9.1 ± 0.7 | 14.27 ± 0.05 | 1.675 52 | +394.7 | C iv | 13.8 ± 2.5 | 13.02 ± 0.11 | ||
| 1.671 14 | −96.5 | C iv | 3.6 ± 1.7 | 13.36 ± 0.27 | 1.675 91 | +438.4 | C iv | 11.8 ± 0.5 | 12.81 ± 0.01 | ||
| 1.671 28 | −80.8 | C iv | 8.4 ± 1.3 | 13.25 ± 0.07 | 1.670 93 | −120.1 | Si iv | 11.6 ± 0.5 | 12.82 ± 0.02 | ||
| 1.671 45 | −61.7 | C iv | 9.5 ± 1.7 | 12.71 ± 0.08 | 1.671 11 | −99.9 | Si iv | 7.1 ± 0.4 | 12.78 ± 0.02 | ||
| 1.671 80 | −22.4 | C iv | 17.2 ± 1.0 | 13.29 ± 0.03 | 1.671 39 | −68.4 | Si iv | 19.6 ± 1.9 | 12.46 ± 0.03 | ||
| 1.671 99 | −1.1 | C iv | 7.3 ± 0.3 | 14.06 ± 0.07 | 1.671 75 | −28.1 | Si iv | 10.3 ± 0.8 | 12.87 ± 0.07 | ||
| 1.672 04 | +4.5 | C iv | 5.3 ± 0.6 | 13.79 ± 0.13 | 1.671 99 | −1.1 | Si iv | 4.6 ± 2.8 | 12.54 ± 0.47 | ||
| 1.672 21 | +23.5 | C iv | 7.4 ± 5.4 | 12.65 ± 0.64 | 1.672 02 | +2.2 | Si iv | 15.2 ± 5.6 | 13.23 ± 0.02 | ||
| 1.672 38 | +42.6 | C iv | 4.3 ± 1.0 | 13.25 ± 0.12 | 1.672 22 | +24.7 | Si iv | 4.3 ± 3.4 | 12.67 ± 0.50 | ||
| 1.672 50 | +56.1 | C iv | 6.8 ± 0.4 | 13.73 ± 0.02 | 1.672 35 | +39.3 | Si iv | 10.1 ± 1.9 | 13.56 ± 0.06 | ||
| 1.672 51 | +57.2 | C iv | 30.5 ± 1.2 | 14.26 ± 0.03 | 1.672 51 | +57.2 | Si iv | 4.7 ± 1.9 | 12.93 ± 0.34 | ||
| 1.672 75 | +84.1 | C iv | 5.5 ± 0.6 | 12.91 ± 0.04 | 1.672 59 | +66.2 | Si iv | 6.4 ± 1.7 | 13.31 ± 0.12 | ||
| 1.673 02 | +114.4 | C iv | 5.8 ± 0.2 | 13.19 ± 0.02 | 1.672 71 | +79.6 | Si iv | 6.9 ± 1.0 | 12.96 ± 0.09 | ||
| 1.673 13 | +126.7 | C iv | 4.7 ± 0.3 | 13.00 ± 0.02 | 1.672 97 | +108.8 | Si iv | 12.9 ± 2.2 | 12.41 ± 0.05 | ||
| 1.673 76 | +197.4 | C iv | 39.4 ± 8.0 | 12.89 ± 0.24 | 1.673 14 | +127.9 | Si iv | 4.9 ± 2.2 | 11.75 ± 0.17 | ||
| 1.673 79 | +200.8 | C iv | 12.3 ± 0.5 | 13.65 ± 0.04 | 1.673 97 | +220.9 | Si iv | 9.9 ± 2.2 | 12.29 ± 0.11 | ||
| 1.673 95 | +218.7 | C iv | 9.6 ± 0.5 | 13.82 ± 0.02 | 1.674 10 | +235.5 | Si iv | 5.4 ± 0.6 | 12.60 ± 0.05 | ||
| 1.674 10 | +235.5 | C iv | 6.5 ± 0.3 | 13.45 ± 0.03 | 1.674 27 | +254.6 | Si iv | 6.3 ± 1.1 | 12.12 ± 0.04 | ||
| 1.674 26 | +253.4 | C iv | 7.3 ± 0.2 | 13.35 ± 0.02 | 1.675 00 | +336.4 | Si iv | 5.7 ± 1.3 | 11.92 ± 0.06 | ||
| 1.674 79 | +312.9 | C iv | 7.4 ± 0.9 | 12.28 ± 0.05 | 1.675 25 | +364.4 | Si iv | 7.0 ± 0.2 | 13.16 ± 0.01 | ||
| 1.675 01 | +337.5 | C iv | 11.5 ± 0.4 | 13.33 ± 0.01 | 1.675 38 | +379.0 | Si iv | 5.8 ± 1.7 | 12.12 ± 0.11 | ||
aColumn densities are given in logarithmic units and their upper limits are 3σ values.
bBlended with other lines.
cBlended with some unidentified forest absorption.
Fig. 3 shows the apparent column density profiles, Na(v), for the Ni ii, Mn ii, Cr ii and Al iii transitions of this sub-DLA. There is almost no indication of saturation in these profiles except may be at v = +37 km s−1 in the Ni ii transitions. Here, the Ni ii λ1751 optical depth is slightly higher than those of the other two stronger transitions. This is direct evidence of hidden saturation corresponding to the situation where the Doppler parameter of the lines is smaller than the spectral resolution. In that case, the hidden saturation in Ni ii could lead to underestimate the column density by only ≈0.03 dex. This is of the order of the error in the column densities and is therefore not important. Despite the strength of the Al iii absorption profiles there is no sign of hidden saturation. Moreover, with a few minor exceptions, the Na(v) curves for the two Mn ii transitions match quite well, suggesting no hidden saturation as well. However, the Na(v) profile of the Cr ii λ2062 transition does not coincide with that of the other two transitions. This is probably due to the blending with some unidentified absorption features hidden in the profile of Cr ii λ2062. Therefore, we will adopt the Cr ii column density determined from the λ2056 and λ2066 features only.
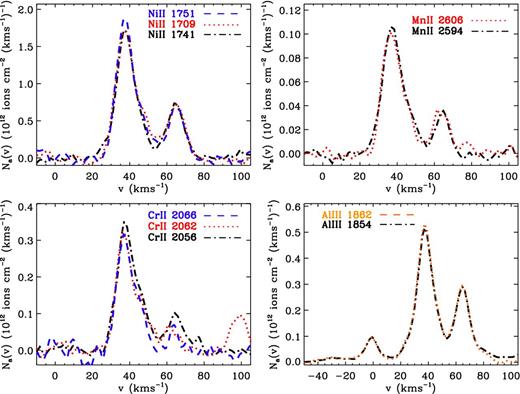
Apparent column density analyses of the Ni ii, Mn ii, Cr ii and Al iii absorption profiles in the zabs = 1.6720 sub-DLA.
The redshift alignment between the C i multiplet (i.e. C i and C i*) and low-ion species is not very good, so the fit to the C i multiplet was performed separately (see Fig. 2). The results of the fit are listed in Table 4. Since both C i and C i* are clearly detected for the component at z = 1.672 01, we calculate the excitation temperature between the J = 0 and J = 1 fine structure levels of C i to be Tex = 11.42 K. This is consistent with but larger than the predicted value of the cosmic microwave background (CMB) temperature TCMB = 7.28 K from the standard cosmology. Indeed, C i fine structure levels can be populated by other excitation processes such as collision and UV pumping (see e.g. Ge, Bechtold & Black 1997; Srianand, Petitjean & Ledoux 2000). Moreover, Kanekar et al. (2009) report a tentative detection of H i 21 cm absorption in this system. They determined an H i 21 cm integrated optical depth of 0.076 ± 0.016 and a covering factor of 0.9 which Ellison et al. (2012) later used to derive a spin temperature of Ts = 380 ± 127 K.
Column densities of the C i fine structure levels in the sub-DLA at zabs = 1.6720.
| z | ΔV (km s−1) | b (km s−1) | log N(C i) | log N(C i*) |
|---|---|---|---|---|
| 1.672 01 | +1.1 | 3.4 ± 0.3 | 12.43 ± 0.01 | 12.01 ± 0.02 |
| 1.672 35 | +39.3 | 7.3 ± 1.1 | 12.20 ± 0.06 | ≤11.84 |
| 1.672 50 | +56.1 | 7.8 ± 0.6 | 12.62 ± 0.02 | ≤11.97 |
| z | ΔV (km s−1) | b (km s−1) | log N(C i) | log N(C i*) |
|---|---|---|---|---|
| 1.672 01 | +1.1 | 3.4 ± 0.3 | 12.43 ± 0.01 | 12.01 ± 0.02 |
| 1.672 35 | +39.3 | 7.3 ± 1.1 | 12.20 ± 0.06 | ≤11.84 |
| 1.672 50 | +56.1 | 7.8 ± 0.6 | 12.62 ± 0.02 | ≤11.97 |
Finally, absorption by highly ionized gas in this sub-DLA is seen in C iv, Si iv, N v and Si iii. Fig. 4 gives the velocity profiles and vpfit solutions of these species. The parameters are listed in Table 3. We chose not to fit the N v doublet and Si iii profiles due to severe blending and saturation. Moreover, both transitions of the Si iv doublet are partly blended with some forest absorption. In the C iv λ1548 (resp. C iv λ1550) velocity panel of Fig. 4, the blue shaded areas indicate blends with the C iv λ1550 (resp. C iv λ1548) absorption of the same system.

3.3 Systems with z > 2
We will single out some of the systems with highest redshifts to determine whether they are intervening systems or systems associated with the quasar (see e.g. Petitjean, Bergeron & Puget 1992).
3.3.1 zabs = 2.0422
Fig. 5 shows the velocity profiles and vpfit solutions (wherever applicable) of the Lyα, Lyβ and high-ion transitions (C iv, N v and O vi doublets) regions associated with this system. The results of the fits are listed in Table 5. As illustrated in Fig. 5, it is apparent that the H i column density of the main complex around 0 km s−1 is very small. We derive an upper limit of log |$N_{\rm H\,{{\small I}}} < 12.90$| (blue curves in the H i velocity panels). It is interesting to note that the Si iv doublet is not detected in this system. As shown in Fig. 5, the O vi λ1037 absorption is completely lost in the strong Lyα absorption of the system at zabs = 1.5965. Moreover, the O vi λ1031 profile is also severely blended with Si ii λ1190 of the system at zabs = 1.6359. In Fig. 5, the blue curve in the O vi λ1031 velocity panel is the vpfit solution of this intervening Si ii absorption overplotted on the observed data.
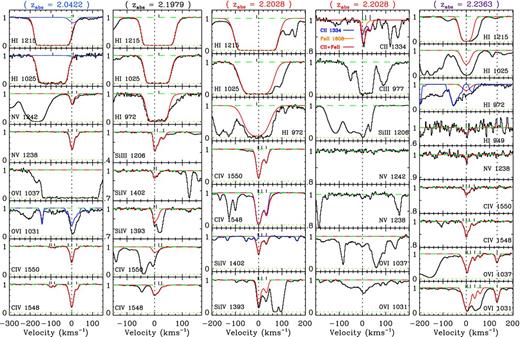
Observed velocity profiles and vpfit solutions of the species detected in the zabs = 2.0422, 2.1979, 2.2028 and 2.2363 absorbers. Parameters of the fit can be found in Table 5.
High-ion and H i column densities for the zabs = 2.0422, 2.1979, 2.2028 and 2.2363 absorbers.
| z | ΔV (km s−1) | Ion (X) | b (km s−1) | log N(X) |
|---|---|---|---|---|
| zabs = 2.0422 | ||||
| 2.042 24 | +7.1 | H i | 25.0 | ≤12.90 |
| 2.041 08 | −107.4 | C iv | 8.9 ± 5.8 | 12.08 ± 0.55 |
| 2.041 17 | −98.6 | C iv | 4.6 ± 3.4 | 12.08 ± 0.55 |
| 2.041 33 | −82.8 | C iv | 7.0 ± 1.1 | 12.26 ± 0.04 |
| 2.041 99 | −17.7 | C iv | 5.4 ± 0.6 | 12.38 ± 0.05 |
| 2.042 17 | 0.0 | C iv | 9.3 ± 0.1 | 13.58 ± 0.00 |
| 2.042 41 | +23.6 | C iv | 10.6 ± 0.7 | 12.72 ± 0.02 |
| 2.041 99 | −17.7 | N v | 5.4 ± 0.6 | 12.22 ± 0.08 |
| 2.042 18 | +1.0 | N v | 9.3 ± 0.1 | 13.55 ± 0.01 |
| 2.042 41 | +23.6 | N v | 10.6 ± 0.7 | 12.91 ± 0.02 |
| zabs = 2.1979 | ||||
| 2.198 02 | +13.1 | H i | 46.5−32.8 | 15.80−16.22 |
| 2.197 88 | 0.0 | C iv | 10.2 ± 0.2 | 13.06 ± 0.01 |
| 2.198 03 | +14.1 | C iv | 6.7 ± 0.7 | 12.50 ± 0.09 |
| 2.198 18 | +28.1 | C iv | 15.7 ± 2.5 | 12.40 ± 0.09 |
| 2.197 86 | −1.9 | Si iv | 2.1 ± 1.6 | 11.50 ± 0.13 |
| 2.197 94 | +5.6 | Si iv | 11.9 ± 0.8 | 12.14 ± 0.04 |
| 2.197 87 | −1.0 | Si iii | 4.6 ± 0.3 | 11.85 ± 0.06 |
| 2.197 98 | +9.4 | Si iii | 10.0 ± 1.0 | 12.02 ± 0.05 |
| 2.198 22 | +31.9 | Si iii | 8.5 ± 0.5 | 11.65 ± 0.02 |
| zabs = 2.2028 | ||||
| 2.202 68 | −9.3 | H i | 49.0−45.8 | 15.47−15.60 |
| 2.202 66 | −10.3 | C iv | 8.9 ± 2.3 | 13.12 ± 0.38 |
| 2.202 78 | 0.0 | C iv | 7.7 ± 0.7 | 13.93 ± 0.07 |
| 2.202 93 | +15.0 | C iv | 7.7 ± 1.4 | 13.22 ± 0.10 |
| 2.203 12 | +32.8 | C iv | 9.2 ± 0.3 | 13.39 ± 0.02 |
| 2.202 66 | −10.3 | C ii | 8.9 ± 2.3 | 11.45 ± 0.20 |
| 2.202 78 | 0.0 | C ii | 7.7 ± 0.7 | 12.45 ± 0.20 |
| 2.202 93 | +15.0 | C ii | 7.7 ± 1.4 | 12.09 ± 0.18 |
| 2.203 12 | +32.8 | C ii | 9.2 ± 0.3 | 12.41 ± 0.09 |
| 2.202 66 | −10.3 | Si iv | 8.9 ± 2.3 | 12.33 ± 0.36 |
| 2.202 78 | 0.0 | Si iv | 7.7 ± 0.7 | 13.09 ± 0.07 |
| 2.202 93 | +15.0 | Si iv | 7.7 ± 1.4 | 12.33 ± 0.12 |
| 2.203 12 | +32.8 | Si iv | 9.2 ± 0.3 | 12.68 ± 0.02 |
| 2.202 80 | +2.8 | N v | 11.4 ± 1.6 | 12.00 ± 0.05 |
| 2.203 12 | +32.8 | N v | 3.2 ± 1.3 | 11.70 ± 0.06 |
| zabs = 2.2363 | ||||
| 2.236 33 | 0.0 | H i | 21.9 | 14.18 ± 0.02 |
| 2.236 18 | −13.9 | C iv | 5.0 ± 1.5 | 11.58 ± 0.16 |
| 2.236 33 | 0.0 | C iv | 7.4 ± 1.2 | 12.38 ± 0.05 |
| 2.236 47 | +13.0 | C iv | 4.8 ± 1.2 | 11.91 ± 0.11 |
| 2.236 70 | +34.3 | C iv | 13.6 ± 1.4 | 11.98 ± 0.03 |
| 2.236 31 | −1.9 | O vi | 15.5 ± 5.5 | 13.98 ± 0.42 |
| 2.236 37 | +3.7 | O vi | 5.8 ± 2.3 | 13.78 ± 0.41 |
| 2.236 52 | +17.6 | O vi | 5.5 ± 4.1 | 13.25 ± 0.80 |
| 2.236 72 | +36.1 | O vi | 7.7 ± 1.7 | 13.37 ± 0.08 |
| 2.236 97 | +59.3 | O vi | 7.8 ± 1.9 | 13.07 ± 0.07 |
| 2.237 76 | +132.4 | O vi | 9.0 ± 0.3 | 13.58 ± 0.01 |
| 2.236 34 | +1.0 | N v | 6.1 ± 1.5 | 11.88 ± 0.06 |
A six-component fit was performed on the C iv doublet profiles. The three absorption components of the C iv doublet in the velocity range −120 ≤ v ≤ −70 km s−1 are not seen in the N v doublet. The N v λ1242 profile around zero velocity is also partially blended with some unidentified absorption features, and we chose not to include it in the fit. We found that a successful solution is achieved for N v by fixing the Doppler parameters and redshifts of the first and third components to the values of their corresponding components in the C iv complex.
3.3.2 zabs = 2.1979
We detect the C iv and Si iv doublets together with Si iii λ1206, Lyα, Lyβ and Lyγ absorption profiles in this system. Fig. 5 shows the velocity profiles and vpfit solutions for these transitions. Note that the Lyγ profile appears to be blended with some unidentified forest lines but can still be used to constrain the H i column density. From these three H i lines, we derive 15.80 < log |$N_{\rm H\,{{\small I}}}$| < 16.22. Due to blending, the C iv λ1550 and Si iv λ1393 profiles were excluded from the Voigt profile fitting. Moreover, because of the lack of alignment between individual profiles, we chose not to tie the high-ion species during the fitting process. The results of the fit are listed in Table 5.
3.3.3 zabs = 2.2028
The velocity profiles and vpfit solutions for this absorption system are shown in Fig. 5 and the results are presented in Table 5. We used Lyα and Lyβ absorption to derive a lower limit to the H i column density of log |$N_{\rm H\,{{\small I}}} \ge$| 15.47. The Lyγ absorption profile although contaminated brings additional information to derive an upper limit of log |$N_{\rm H\,{{\small I}}} \le$| 15.60. There are two C ii transitions in the observed wavelength range, one of which (C ii λ1036) is lost in the forest.
We fit the C ii λ1334 absorption feature including the contribution of the Fe ii λ1608 absorption of the system at zabs = 1.6574 with which it is blended (see Fig. 5). The C iv and Si iv absorption profiles were fitted simultaneously without including the C iv λ1548 and Si iv λ1393 transitions. Indeed, Si iv λ1393 is blended with Al ii λ1670 at zabs = 1.6720 and C iv λ1548 is blended with the C iv λ1550 at zabs = 2.1979. In Fig. 5, the vpfit solutions with (red curve) and without (blue curve) taking into account the contribution of the C iv λ1550 absorption at zabs = 2.1979 are overplotted on the C iv λ1548 velocity profile. The high quality of the fit further confirms the reality of the C iv doublet at zabs = 2.1979, which was identified solely by its unblended C iv λ1548 absorption profile. Furthermore, the Si iv λ1402 profile itself is also slightly blended with the C iv λ1548 profile at zabs = 1.8994, and the fit was performed including the contribution of this interloping C iv absorption. In Fig. 5, the vpfit solution of this interloping C iv absorption is overplotted as a blue curve on top of the Si iv λ1402 velocity profile. Fig. 5 also shows velocity profiles of three species we chose not to fit (i.e. C iii, Si iii and O vi). Since the C iii λ977 profile is highly saturated, we were unable to accurately fit it even starting from the C ii profile. The Si iii λ1206 is also suffering from blending with some unidentified forest absorption. The N v doublet is so weak that only a weak N v λ1238 absorption could be possibly present. We regard it as a possible detection. The parameters of the fit to this N v feature are also listed in Table 5. The O vi doublet is also weak and appears to be suffering from blends with forest absorption.
3.3.4 zabs = 2.2363
This absorption system is established by the presence of the C iv and O vi doublets. The vpfit solutions and velocity profiles are presented in Fig. 5. Table 5 lists the parameters. Although contaminated with some random forest absorption, the H i column density is very well constrained at log |$N_{\rm H\,{{\small I}}} = 14.18 \pm 0.05$| by the steepness of the blue wing of the Lyα absorption profile as well as the presence of the unsaturated Lyδ line. Note that the absorption complex visible at the position of the Lyγ absorption of this system is due to the absorption by Si ii λ1193 of the system at zabs = 1.6359 (blue curve). Furthermore, due to the blending with some forest absorption, the fit to the O vi doublet was done without including the O vi λ1031 absorption profile. The vpfit solutions for the C iv and O vi doublets required four and six components, respectively. The two O vi components at v ≈ +60 and v ≈ +130 km s−1 are not clearly seen in the C iv profiles. The two vertical dotted lines in Fig. 5 indicate the position of the two strongest components of the O vi doublet profiles.
4 PHYSICAL CONDITIONS
In this section, we present detailed analyses of the zabs = 1.6359 and zabs = 1.6720 sub-DLAs and we construct photoionization models using cloudy (Ferland et al. 1998) version C10.00 for some interesting systems.
4.1 Sub-DLA system at zabs = 1.6359
The best element to derive the overall abundance in the gas is oxygen, since neutral oxygen and neutral hydrogen have very similar ionization potentials and are coupled by charge-exchange reaction. The O i to H i column density ratio yields [O/H] = −1.69 ± 0.07 (corresponding to 1/49 solar) and [O/H] = −1.65 ± 0.07 (corresponding to 1/45 solar) for the R1 and R2 velocity ranges (see Fig. 1), respectively. This indicates that the whole complex is well mixed.
A 3σ upper limit on the N i column density implies an abundance relative to solar [N/H] ≤ −2.06 for R2 if we assume that the ionization fraction is same for nitrogen and hydrogen. The resulting nitrogen-to-oxygen ratio is [N/O] ≤ −0.41. The interpretation of the N i/H i ratio is not as straightforward as for O i/H i. Although the ionization potential of N i is only slightly higher than that of hydrogen, ionization effects can significantly affect the determination of [N/H] from N i and H i in absorbers with overall H i column densities ≤1020 cm−2. Thus, a non-negligible fraction of nitrogen may be in the form of N ii. While the redshift of this sub-DLA is too low to observe the corresponding N ii absorption lines (λobs = 2415, 2585 Å) from the ground, we can check upon possible ionization effects in R1 and R2 using other weakly ionized species, such as Al ii and Al iii. The ratio Al iii/Al ii is 0.47 and 0.08 in R1 and R2, respectively, suggesting that the ionization effect is probably negligible in the R2 region.
This absorber has an average ratio [Si ii/O i] ≈ +0.72. This ratio is not consistent with nucleosynthesis considerations, since both Si and O are believed to be produced by massive stars, and indeed, are observed to have solar abundance ratio in Galactic halo stars (Wheeler et al. 1989) and in metal-poor dwarf galaxies (Thuan, Izotov & Lipovetsky 1995). One can reconcile this inconsistency if some of the Si ii comes from partially ionized gas rather than from the neutral gas (recall that the ionization potentials of O i and Si ii are 13.61, 16.34 eV, respectively).
Since the ionization effects appear to be significant in R1 (judging from the Al iii/Al ii and [Si ii/O i] ratios), we try to model this velocity range using model calculations performed with the photoionization code cloudy. The R1 velocity range comprises five absorption components, and we construct a detailed model only for the dominant neutral component at z = 1.635 88. In this component, the low- and high-ion species are very well aligned and we will assume that they arise from the same gas. The H i column density for this component is estimated to be log |$N_{\rm H\,{{\small I}}} = 18.23$| and the calculations were stopped when this column density was reached. Relative metal abundances are considered solar and the metallicity is taken as Z = 0.02 Z⊙. This metallicity is actually the O i abundance for the component of interest. We use an ionizing spectrum that is a combination of the Haardt–Madau extragalactic spectrum (Haardt & Madau 1996, HM96) at z = 1.63, the CMB radiation at z = 1.63 and the average Galactic interstellar medium (ISM) spectrum of Black (1987) with H i ionizing photons extinguished. Note that we used the cloudy built-in HM96 spectrum which includes both contributions from quasars and galaxies.
The lower panel of Fig. 6 (left-hand side) gives the Si ii/Si iv and C ii/C iv ratios versus the ionization parameter log U. The observed ratios intercept the model curves at the ionization parameter log U = −3.42. The upper panel of Fig. 6 (left-hand side) gives the calculated column densities versus the ionization parameter for different species. In this figure, the horizontal lines indicate the observed values. The raw (before correction) and ionization-corrected abundances as well as the abundances relative to oxygen are reported in Table 6. We note that hydrogen is 96 per cent ionized in this component. The Fe and Si abundances relative to oxygen ([Fe/O] = −0.37 ± 0.09 and [Si/O] = −0.13 ± 0.09) are consistent with the mean dust-depletion pattern seen in DLAs and in the Galactic halo (e.g. Petitjean, Srianand & Ledoux 2002). The Si abundance relative to oxygen also suggests that the dust depletion in this component is not very significant and that the underabundance of iron relative to oxygen ([Fe/O] = −0.37 ± 0.09) could be attributed to nucleosynthetic considerations. We also note that the calculated N(Mg i)/N(Mg ii) ratio of −2.08 is in good agreement with the observed value (i.e. −2.11). We did not try to model the R2 velocity range because, not only its nine absorption components are heavily blended, but also none of the components is well aligned in the high- and low-ionization species. This lack of alignment prevents us from constraining the ionization parameter using their column density ratios. However, the observed abundances of Si, Fe and Mg for this velocity range are as follows: [Si/H] = −0.99 ± 0.06, [Fe/H] = −1.63 ± 0.06 and [Mg/H] = −1.54 ± 0.06.
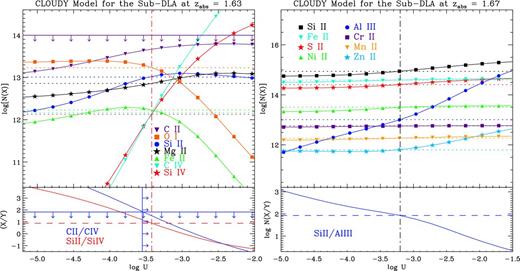
cloudy models of the two sub-DLAs at zabs = 1.63 and 1.67.
Elemental abundances before ([X/H]raw) and after ([X/H]corr) ionization correction (IC(X/H)) for the sub-DLA at |$z_{\text{abs}} = 1.6359$|. These are the results of the cloudy model constructed for the single component at zabs = 1.635 88.
| (X) | [X/H]raw | IC(X/H) | [X/H]corr | [X/O] |
|---|---|---|---|---|
| O | −1.69 ± 0.07 | −0.06 | −1.63 ± 0.07 | +0.00 |
| Si | −0.73 ± 0.06 | +1.03 | −1.76 ± 0.06 | −0.13 |
| Fe | −1.50 ± 0.06 | +0.50 | −2.00 ± 0.06 | −0.37 |
| Mg | −0.97 ± 0.06 | +0.34 | −1.31 ± 0.06 | +0.32 |
| (X) | [X/H]raw | IC(X/H) | [X/H]corr | [X/O] |
|---|---|---|---|---|
| O | −1.69 ± 0.07 | −0.06 | −1.63 ± 0.07 | +0.00 |
| Si | −0.73 ± 0.06 | +1.03 | −1.76 ± 0.06 | −0.13 |
| Fe | −1.50 ± 0.06 | +0.50 | −2.00 ± 0.06 | −0.37 |
| Mg | −0.97 ± 0.06 | +0.34 | −1.31 ± 0.06 | +0.32 |
4.2 Sub-DLA System at zabs = 1.6720
In this sub-DLA, the two velocity ranges R2 and R3 exhibit extremely different ionization properties. In region R2, the observed N(S ii)/N(O i) ratio is close to unity when the solar metallicity of oxygen is 1.56 dex larger than that of sulphur. Note that similar ratios are observed with Si ii. This probably means that oxygen, and thus hydrogen, are highly ionized. Assuming that the S/O abundance ratio is solar would imply hydrogen is ionized at 97 per cent in this velocity range. If true, this is in contradiction with the low-ionization conditions suggested by the presence of strong C i absorption. One possibility to escape this contradiction would be that C i originates in a narrow and weak component which is lost in wider and stronger O i and S ii profiles. However, it can be seen in Fig. 2 that this is not the case and the C i, O i, S ii and Si ii absorption profiles are similar. This is therefore an intriguing situation possibly calling for very special abundance ratios.
In contrast, the R3 velocity range appears to be moderately ionized. To investigate the ionization effects on the observed abundances, we constructed a series of cloudy photoionization models for the R3 velocity range. We adopted a neutral hydrogen column density of log |$N_{\rm H\,{{\small I}}} = 19.78$|, a metallicity of −0.54 (from the observed Zn ii and H i column densities) and solar relative abundances. As can be seen in the lower panel of Fig. 6 (right-hand side), the observed ratio log N(Si ii)/N(Al iii) = 1.93 indicates that the ionization parameter should be close to log U = −3.20. Note that due to the severe saturation of the Al ii absorption profile, Si ii is used instead of Al ii. The calculated column densities are given versus ionization parameter in the upper panel of Fig. 6 (right-hand side). In this figure, the horizontal dotted lines mark the observed quantities. Table 7 reports the abundances (before and after IC), the IC and the under/overabundances relative to Zinc. We note that, in this velocity range, hydrogen is 50 per cent ionized.
The same as Table 6 but for the sub-DLA at zabs = 1.6720.
| (X) | [X/H]raw | IC(X/H) | [X/H]corr | [X/Zn] |
|---|---|---|---|---|
| Zn | −0.54 ± 0.05 | +0.03 | −0.57 ± 0.05 | +0.00 |
| Si | −0.35 ± 0.05 | +0.20 | −0.55 ± 0.05 | +0.02 |
| Fe | −0.69 ± 0.05 | +0.10 | −0.79 ± 0.05 | −0.22 |
| Cr | −0.66 ± 0.05 | +0.06 | −0.72 ± 0.05 | −0.15 |
| Ni | −0.49 ± 0.05 | +0.19 | −0.68 ± 0.05 | −0.11 |
| Mn | −0.94 ± 0.05 | +0.09 | −1.03 ± 0.05 | −0.46 |
| S | −0.49 ± 0.05 | +0.15 | −0.64 ± 0.05 | −0.07 |
The α-elements we measure in this sub-DLA follow each other very well. We obtain [Si/Zn] = +0.02 ± 0.07 and [S/Zn] = −0.07 ± 0.07, as well as [Si/Fe] = +0.24 ± 0.07 and [S/Fe] = +0.15 ± 0.07 after correction of ionization effects. Fig. 7 shows the abundance ratios of Si and S relative to Fe for this sub-DLA (red stars), along with that of the Galactic and halo stars, DLAs and sub-DLAs compiled from the literature (see below for references). The value of [Si/Fe] in this absorber is in good agreement with measurements of metal-poor and Galactic disc stars, but is relatively low when compared with the sample of DLAs and sub-DLAs from literature (see the upper panel of Fig. 7). The same behaviour is seen in sulphur as [S/Fe] is also lower than the values in the DLA sample. The [S/Fe] abundance ratio at the corresponding [Fe/H] is even lower than that of the halo and Galactic disc stars (with the exception of the two α-deficient stars around [Fe/H] ≈ −0.8; see the lower panel of Fig. 7). In constructing the sample of stellar abundances, the following sources are used: Gratton & Sneden (1988, 1991) (Fe, Si); Edvardsson et al. (1993) (Fe, Si); Nissen et al. (2002) (Fe, S); Chen et al. (2002) (Fe, S). The sample of DLA abundances are from Lu et al. (1996) (Fe, Si, S); Ledoux, Petitjean & Srianand (2006) (Fe, S); Meiring et al. (2011) (Fe, S) while the sample of sub-DLAs is from Dessauges-Zavadsky et al. (2003).
![[Si/Fe] and [S/Fe] abundance ratios against [Fe/H] as observed in DLAs and stars in the Galaxy. The values observed in two sub-DLAs along the studied line of sight are indicated by stars. The error bars give an indication of the typical uncertainty (for more detail see Secttion 4.2).](https://oup.silverchair-cdn.com/oup/backfile/Content_public/Journal/mnras/435/2/10.1093/mnras/stt1411/2/m_stt1411fig7.jpeg?Expires=1750459622&Signature=ZbR-B952GxYxf-i9F-0SaFN0EL41C9tx5d6U~DGUT9wcaM06woIvr-22HV9bj38IFHIUvNqeuj0QeK6TILHaCeNjrKkpUx~WUls2oy3Mci4ItaRJzocL9P6FSu5hwezP1zJ2zk4T8fEj0CkV93fg4FHnb973PEjJq6nwfvUwxYJC077wVAn5jHQbjjDoeBs0fpoTA7UutxmP4mJuJy-U5gHsjGfWj3eRtb0WsgodV-iHk0HgEBmeXBhZtqb~QGGnDgrLjca-TgZCcxxQgeOBYVhoE6iER8r53Ya8EwH3C8LVs4NiiWv-e8s7J7G906oonG~LA6wmXw10vMZhOB1SDQ__&Key-Pair-Id=APKAIE5G5CRDK6RD3PGA)
[Si/Fe] and [S/Fe] abundance ratios against [Fe/H] as observed in DLAs and stars in the Galaxy. The values observed in two sub-DLAs along the studied line of sight are indicated by stars. The error bars give an indication of the typical uncertainty (for more detail see Secttion 4.2).
As discussed above, the observed O i column density is 1.56 dex lower than what is expected if [S/O] = 0. This enables us to roughly estimate the total oxygen column density to be log N(O) = 15.60. Moreover, for this velocity range, we have measurements for Si ii (log N(Si ii) = 13.33) and Si iv (log N(Si iv) = 13.31) as well as a lower limit for Si iii (log N(Si iii) ≥ 14.10). Therefore, [Si/O] ≡ [(Si ii + Si iii + Si iv)/O] for R2 is ≥ −0.20, which is consistent with the solar abundance of Si/O (i.e. [Si/O] = 0.0).
We also tentatively identified a narrow absorption feature in the red wing of the DLA profile of the system at zabs = 1.6359 as N i absorption associated with this sub-DLA. This feature is shown in Fig. 8 along with a three-component vpfit solution. The vpfit solution of the intervening DLA profile is also incorporated into the fit. As clearly depicted in the two magnified panels of Fig. 8, the final solution could very well match the observation. The redshifts of the components are fixed to those of the components seen in R3. If our identification of this N i feature is correct, then the estimated total column density of log N(N i) = 13.57 ± 0.03 would imply a mean abundance of [N/H] = −2.04 ± 0.06. For an oxygen abundance relative to solar of ∼−0.5, this nitrogen metallicity seems small, indeed, below the secondary relation expected between the metallicities of these two elements (e.g. Petitjean, Ledoux & Srianand 2008). This may indicate that we have underestimated the N i column density because of the difficulty of the measurement or that the ionization of nitrogen is higher than that of oxygen.
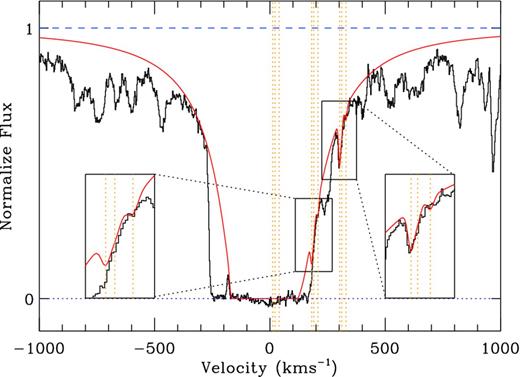
N i absorption of the system at zabs = 1.6720 in the wing of the Lyα profile of a system at zabs = 1.6359. The orange vertical lines indicate the position of the three components identified in the system for the N i triplet (i.e. λλλ1200.7,1200.2,1199.5).
We observe that Zn is slightly overabundant relative to Ni, Fe, Cr and Mn indicating depletion of these elements on to dust. This is consistent both with the presence of a small amount of ISM-like dust as well as the abundance pattern of halo stars which have been enriched by Type II supernovae (SNe). The odd–even effect, namely the underabundance of odd-Z elements relative to even-Z elements of the same nucleosynthetic origin, is an observationally established property of Halo stars. Since Fe is more susceptible to dust depletion than Mn in the ISM, this ratio can be exploited to distinguish between dust depletion and pure Type II SNe enrichment. The [Mn/Fe] = −0.24 ± 0.07 in this sub-DLA, possibly confirms the odd–even effect, and is consistent with the sample of Halo metal-poor stars in Ryan, Norris & Beers (1996). It is interesting to note that the relative abundance of Mn to Fe in this system, is in accordance with that of thick disc stars in Prochaska et al. (2000) and what has been observed in DLAs (Ledoux, Bergeron & Petitjean 2002).
The degree of depletion of refractory elements on to dust grains is in any case small in this sub-DLA. Fig. 9 shows the Zn/Fe abundance ratio against the Zn abundance for this sub-DLA (red square) and sub-DLAs from the literature (black dots; see below for references). Fig. 9 indicates that the amount of dust depletion in this sub-DLA is consistent with that seen in other sub-DLAs with the same metallicity. In constructing the sample of sub-DLA abundances, the following sources are used: Dessauges-Zavadsky et al. (2003), Péroux et al. (2008), Meiring et al. (2007) and Meiring et al. (2009). Furthermore, the relative abundance ratio of Cr and Fe in R3 is almost solar ([Fe/Cr] = −0.07 ± 0.07). In Fig. 10, we plot the abundance of Ni, Mn, Cr, Fe and Si relative to Zn as well as Si relative to Fe. Except for the abrupt change around 55 km s−1, the variation in the relative abundances is of the order of 0.2 dex.
![[Zn/Fe] abundance ratio versus [Zn/H] for the sub-DLA at zabs = 1.6720 (red square) as well as the sub-DLAs from the literature (black dots; see the text for the references).](https://oup.silverchair-cdn.com/oup/backfile/Content_public/Journal/mnras/435/2/10.1093/mnras/stt1411/2/m_stt1411fig9.jpeg?Expires=1750459622&Signature=oI0BJtEZobPlv3wi6hSeEZt-xQzUOZV-OzwT6jRby7m~iRHQ~Iu~ctgEuHdjL-Fd4vCoaXBPtRGR3yuaLm-J3WPEhL6cAu2yjuqSSiYuTWlGDNtLiTdopCkV7OjN5ZAyJTtjJnGPMmSMPepK2tcR2oJNoiR7Rh8xkmBikRLPGtaYc08TT3Es2~EEdb0vMaFUdlDhzRvcF9xUgoCgvuyvG1mcPvMCVuS72yslA91FDOvLNSSh2AsYV-7CKBhu9ytAi-cpgodycQHSkb3ygbDO7MUTiBRuLQxfJdx7BB9HNzri56Sp0fPehqTARXNfTtkb~AGac4ZVvDtxTqHPSahqKg__&Key-Pair-Id=APKAIE5G5CRDK6RD3PGA)
[Zn/Fe] abundance ratio versus [Zn/H] for the sub-DLA at zabs = 1.6720 (red square) as well as the sub-DLAs from the literature (black dots; see the text for the references).
![Abundances of Ni, Mn, Cr, Fe and Si relative to Zn and Si relative to Fe in the zabs = 1.6720 sub-DLA. The blue horizontal dot–dashed line represents zero depletion with respect to Zn (or with respect to Fe in the case of [Si/Fe]). It can be seen that the profiles are fairly homogeneous.](https://oup.silverchair-cdn.com/oup/backfile/Content_public/Journal/mnras/435/2/10.1093/mnras/stt1411/2/m_stt1411fig10.jpeg?Expires=1750459622&Signature=BSq8X9jX-98pbAw72asHnDZR2ZwUhwnnOteYy8BS0druucOoY6Qjz6UsH0FQ8GAYebTice~BKySpfIsidxYhHcx-j95SGLKamHkS~oX-Gro~JJMLgne0LI7-ExDzreI4v2WlWocgM99JnSI5x2LUSKo-V1u1wkrMWQ~ZSJaxmKfFTP49pjxXfSPp~fv8Nl7o1qKpIw-xduGmP-fvizxffBiv--85vq8ngHKUSSKDcUvbmG4iE4cCogtVMg1x0BY0lmjJvaKjlRz7qBteYEhHYYjN9itm5zUsxJ4X9CgIEvpuoO4xuJnM-yUBo94vx5uGA7BUjY~qHIQwkp~n3BQSVg__&Key-Pair-Id=APKAIE5G5CRDK6RD3PGA)
Abundances of Ni, Mn, Cr, Fe and Si relative to Zn and Si relative to Fe in the zabs = 1.6720 sub-DLA. The blue horizontal dot–dashed line represents zero depletion with respect to Zn (or with respect to Fe in the case of [Si/Fe]). It can be seen that the profiles are fairly homogeneous.
4.3 Modelling of some systems with zabs ≥ 2.0
In this sub-section, we construct photoionization models using cloudy for the zabs = 2.0422, 2.1979, 2.2028 and 2.2363 absorption systems. In the cloudy models of the first two systems, we assumed that the extragalactic UV background of H&M and the CMB radiation are the radiations striking the absorbing cloud. For the last two systems, we considered the radiation field of the active galactic nuclei (AGN) deduced by Mathews & Ferland (1987). The relative abundances of the elements were assumed to be solar (see Table 1).
The reason to model these systems is to test whether these systems are under the influence of the quasar or not. We will conclude that it is the case for systems at zabs = 2.0422, 2.2028 and 2.2363 so that these systems will not be considered in the investigation of the clustering properties of C iv systems along this line of sight.
4.3.1 zabs = 2.0422
As can be seen in Fig. 5, this system comprises two absorption complexes located at −110 ≤ v ≤ −70 km s−1 and −25 ≤ v ≤ +40 km s−1. We chose to model the latter complex for which we have detected a number of high-ion species (i.e. C iv, N v and O vi). The cloudy model was calculated for N(H i) = 1012.90 cm−2. The results of the photoionization model are illustrated in the upper left-hand panel of Fig. 11. Using the ionic ratio N(O vi)/N(C iv) = +0.39 to constrain the ionization parameter gives log U = −1.59. This ionization parameter along with a metallicity of Z = 6 Z⊙ could successfully reproduce the observed C iv and O vi column densities, but would fail to do so for the N v column density which appears to be about 0.21 dex larger. Raising by 0.21 dex the nitrogen metallicity, we could fit the observation very well. Note that in Fig. 11 the cloudy model of this system is calculated by incorporating the adjusted metallicities into the code. Given the high-metallicity and -ionization parameter, this system is probably within the sphere of influence of the quasar (Petitjean, Rauch & Carswell 1994). We note that the velocity separation between the quasar (zem = 2.233) and the absorber is 18 230 km s−1.
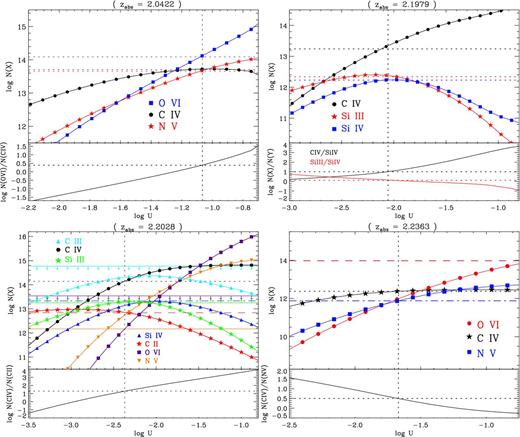
cloudy photoionization models for the zabs = 2.0422, 2.1979, 2.2028 and 2.2363 absorbers.
4.3.2 zabs = 2.1979
For this system, a series of cloudy models were run with a typical H i column density log |$N_{\rm H\,{{\small I}}} = 15.98$| (the range of column density derived in this system is 15.80 < log N(H i) < 16.22). The column density ratios of log N(C iv)/N(Si iv) = 1.01 and log N(Si iii)/N(Si iv) = +0.11 yield ionization parameters of log U = −2.12 and −1.99, respectively, thus in good agreement with each other (see the upper-right panel in Fig. 11). A value of log U = −2.05 is thus adopted, which along with Z = 0.14 Z⊙, could successfully reproduce the observed column densities of Si iii, Si iv and C iv.
4.3.3 zabs = 2.2028
The absorption from C ii, C iii, C iv, Si iii, Si iv and O vi are spread over about 80 km s−1 in velocity space with very weak associated N v absorption (see Fig. 5). The grid of cloudy models were constructed for log N(H i) = 15.54. The ionization parameter, log U = −2.37, was determined using the ionic ratio N(C iv)/N(C ii). Adopting this ionization parameter, the model could successfully reproduce the C ii and C iv column densities with Z = 5.4 Z⊙, but failed to do the same for the Si iii, Si iv and N v. To reproduce the observations, the relative abundance of silicon (resp. nitrogen) has to be raised (resp. lowered) by 0.19 dex (resp. 0.59 dex). The upper limits to the column densities of O vi and C iii are also consistent with the model. Note that in Fig. 11, we incorporated the adjusted metallicities into the cloudy model of this system.
4.3.4 zabs = 2.2363
This system has a redshift higher than the QSO by 306 km s−1 and the N v absorption feature is detected albeit very weak. So it is possible that this system is under the influence of the ionizing radiation coming from the central engine.
The H i column density is very well constrained, thanks to the presence of the less blended unsaturated Lyδ absorption profile (Fig. 5). As is depicted in Fig. 5, the O vi and C iv absorption profiles are not well aligned, indicating that these ions might not arise from exactly the same region and that the gas could be inhomogeneous.
cloudy models with log |$N_{\rm H\,{{\small I}}} = 14.18$| produce an ionic ratio log N(C iv)/N(N v) = +0.5 for an ionization parameter log U = −1.67 and metallicity of Z = 0.56 Z⊙ (see the lower-right panel in Fig. 11). As illustrated in Fig. 11, this model fails to reproduce the O vi column density by 2.0 dex. Either relative metallicities are far from solar which could be explained by the proximity of the gas to the AGN, or this system is multiphase and the ionization of the O vi phase is much larger than that of the C iv–N v phase. The truth may be somewhere in the middle.
5 CLUSTERING PROPERTIES
The resulting correlation functions are given in Fig. 12. In this figure, the blue dotted lines indicate ξ(vk) = 0, and the 1σ region denoted by the two red dotted lines on both sides of the ξ(vk) = 0 line is determined by the standard deviation of ξ(vk) derived from random simulations. As depicted in Fig. 12, the overall shapes of the C iv and Si iv correlation functions are almost similar but the amplitude of the Si iv TPCF is apparently stronger than that of C iv. In the case of Mg ii and Fe ii, both the amplitude and the shape of their TPCFs are similar to that of Si iv to within their corresponding measurement errors. This is due to the fact that systems detected only by C iv are spread over large-velocity ranges. In Fig. 12, the C iv TPCF without including the associated systems is overplotted on the C iv full sample TPCF as orange filled triangles. As is seen here, at all separations the TPCF remains practically unchanged.
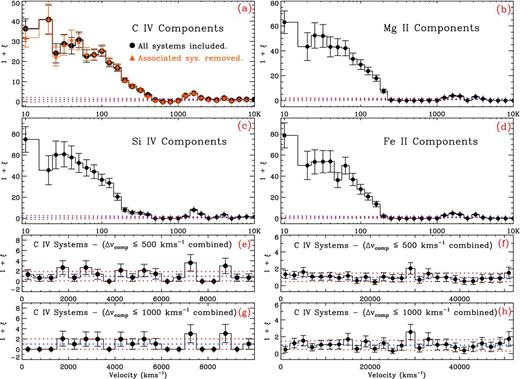
TPCF for the C iv, Si iv, Mg ii and Fe ii absorption components of all systems detected along this line of sight. The blue dotted lines indicate ξ(vk) = 0. Panel (a): the TPCF of the C iv full sample (note that the orange filled triangles indicate the C iv TPCF without including the associated systems). Panel (b): the TPCF of the Mg ii full sample. Panel (c): the TPCF of the Si iv full sample. Panel (d): the TPCF of the Fe ii full sample. Panels (e) and (f): the TPCF of the C iv full sample when systems with velocity separation less than 500 km s−1 are combined. Panels (g) and (h): the TPCF of the C iv full sample when systems with velocity separation less than 1000 km s−1 are combined.
The velocity correlation length or v0, defined as the pair separation for which ξ(v0) = 1, is v0 ≈ 500 km s−1 for C iv and Si iv and v0 ≈ 250 km s−1 for the Mg ii and Fe ii TPCFs. The signal appears to drop to zero immediately after v0 for all four species, contrary to what is seen in Boksenberg, Sargent & Rauch (2003, BSR03). The TPCF in Fig. 12 exhibit a steep decline at large velocities (≥200 km s−1) and a smoother decline at small separations, with an elbow occurring at ≈150 km s−1 for the C iv and Si iv profiles and ≈100 km s−1 for the Mg ii and Fe ii profiles. As is seen here and was also noted in Scannapieco et al. (2006), the elbow occurs at smaller velocity separations for the Mg ii and Fe ii TPCFs in comparison with that of C iv and Si iv. Sargent et al. (1988) and Heisler et al. (1989) found some excess in ξv between 1000 and 10 000 km s−1 and some deficit between 10 000 and 20 000 km s−1. In our analysis, we detect some excess for the same velocity range but no deficit is seen for any velocity separation. We tried to further investigate the clustering signals on large scales by combining all C iv absorption components spreading less than 500 km s−1 into a single system (panels e and f in Fig. 12). Here, we detect several peaks in the velocity ranges 1200–3200 km s−1, 4000–5600 km s−1 and 7000–9000 km s−1. There is also a strong peak in the velocity bin 29 000 km s−1.
We considered the possibility that these signals could be artefacts of the C iv complex decomposition. To this end, we collapsed complexes with component separations Δv ≤ 1000 km s−1 into single systems. The results are illustrated in panels (g) and (h) of Fig. 12. The first point to note is that the signals in the velocity range 1200–5600 km s−1 which were relatively strong in panel (e) of Fig. 12 are now more consistent with null clustering, suggesting that the signals might have been due to the sub-splitting of the extended systems. However, the two peaks at the velocities 7000–9000 km s−1 are still present (see panel g of Fig. 12). Careful examination of the data indicates that the presence of these two peaks is mainly due to the clustering of the systems at z = (1.59, 1.65) for the signal at v = 7300 km s−1 and z = (1.59, 1.67) for the v = 8700 km s−1 signal. The spacing between the two systems at redshifts 1.65 and 1.67 is 1660 km s−1, which is consistent with the separation between the two peaks. The amplitude of the correlation for the two peaks at v = 7300 and 8700 km s−1 is estimated to be 3.02 ± 1.74 and 3.06 ± 1.77, respectively. Since these values were calculated for the sample where velocity separations on scales less than 1000 km s−1 have been removed, it could be possible that these signals represent powers on supercluster scales. In Fig. 12, panels (f) and (h) appear to show some marginally significant signals at large velocities. The strongest signal is seen in the v = 29 000 km s−1 velocity bin. The correlation amplitude of this signal is estimated to be 2.56 ± 0.90. A careful look at the data shows that this signal is getting most of its power from the coupling of the two systems at redshifts 1.36 and 1.59.
This study of the clustering properties of C iv absorbers along the line of sight towards PKS 0237−233 has revealed that C iv components tend to cluster strongly on velocity scales up to 500 km s−1. This is consistent with what has been derived from studies of the clustering properties of C iv components from large samples of intervening C iv systems (Petitjean & Bergeron 1994; BSR03; Scannapieco et al. 2006; D'Odorico et al. 2010). This strong clustering signal results from the combination of relative motions of clouds within a typical galactic halo as well as clustering between galaxies. Some signal is also seen at higher velocity separations. However, this signal is below 2σ which means that there is no strong evidence to support the presence of a high concentration of objects along this line of sight.
6 CONCLUSION
We have presented a high SNR and high spectral resolution spectrum of QSO PKS 0237−233 and have identified most of the absorption features redward of the quasar Lyα emission. Three of the 18 identified absorption systems are sub-DLAs with zabs = 1.3647, 1.6359 and 1.6720. We have analysed the latter two systems in more detail, while the one at zabs = 1.3647, with metallicity [O/H] ≥ −0.33, was studied in depth by Srianand, Gupta & Petitjean (2007).
cloudy models indicate that ionization is higher for the region R1 of the system at zabs = 1.6359, in which hydrogen is more than 95 per cent ionized. In this system, we measured abundances relative to solar: [O/H] = −1.63 ± 0.07, [Si/H] = −1.76 ± 0.06, [Fe/H] = −2.00 ± 0.06 and [Mg/H] = −1.31 ± 0.06 for the R1 velocity range and [O/H] = −1.65 ± 0.07, [Si/H] = −0.99 ± 0.06, [Fe/H] = −1.63 ± 0.06 and [Mg/H] = −1.54 ± 0.06 for the R2 velocity range. The abundance of silicon relative to oxygen (i.e. [Si/O] = −0.13 ± 0.09) in R1 indicates that dust depletion in this velocity range is not very significant, and that [Fe/O] = −0.37 ± 0.09 indicates enrichment by Type II SNe.
The second sub-DLA we studied in detail is located at zabs = 1.6720. The velocity range of the low ions in this absorber extends over 260 km s−1, and is divided into three regions, R1, R2 and R3. We have presented a detailed analysis of the R3 velocity range for which we have detected most of the low-ion species. Ionization models indicate that hydrogen is 50 per cent ionized in R3, and we measured the following abundances of Zn, Si and S: [Zn/H] = −0.57 ± 0.05, [Si/H] = −0.55 ± 0.05 and [S/H] = −0.64 ± 0.05. We note that hidden component analyses of the Ni ii, Mn ii, Cr ii and Al iii transitions did not reveal any significant hidden saturation or hidden components, and we expect this to be the case for the other low-ion species. Dust depletion in this system is small ([Fe/Zn] = −0.22 ± 0.07). Finally, the region R2 seems to show special ionization and/or metallicity structure.
We have also studied the clustering properties of metal lines (C iv, Si iv, Fe ii and Mg ii) for this line of sight. We found that C iv and Si iv (resp. Fe ii and Mg ii) trace each other closely and their corresponding correlation functions ξv show a steep decline at large separations (≥200 km s−1) and a smoother profile below ≈150 km s−1 (resp. ≈100 km s−1). Some signals are also detected at larger velocities. These signals are getting most of their amplitude from the coupling of the systems at redshifts 1.36, 1.59 and 1.67. Despite detecting an unusually high number of absorption systems along this line of sight, no compelling evidence is found to convince us that there is a single strong overdensity of absorption systems here. However, it would be good to perform deep imaging in the field, to look for a large concentration of objects which could be responsible for the presence of the absorption features seen in the spectrum of the QSO PKS 0237−233.
RS and PPJ gratefully acknowledge support from the Indo-French Centre for the Promotion of Advanced Research (Centre Franco-Indien pour la Promotion de la Recherche avancée) under Project N.4304-2. HFV is greatly appreciative of the hospitality of IAP and IUCAA during his visits to these institutes.
Based on observations carried out at the European Southern Observatory with the Ultraviolet and Visible Echelle Spectrograph (UVES) in the course of the Large Programme ‘The Cosmic Evolution of the IGM’ 166.A-0106 on the 8.2-m Very Large Telescope (VLT) Kueyen operated at Paranal Observatory, Chile.
REFERENCES
APPENDIX A: DESCRIPTION OF THE REMAINING ABSORPTION SYSTEMS
A1 zabs = 1.1846
In addition to the C iv doublet, we identify the Mg ii and Al iii doublets, Si ivλ1402, Si ii λ1526, Al iiλ1670 and Fe ii lines associated with this system. Other strong absorption lines, including Si ii λ1393 are redshifted outside of our observed wavelength range. Fig. A1 shows the velocity profiles and vpfit solutions of the absorption profiles associated with this system, and Table A1 lists the parameters (redshift, Doppler parameter and column density) of the components used to fit the low- and high-ion species. The velocity centroids for the components are indicated by tickmarks above the profile of each transition line. We found that a minimum of four individual components are required to optimally fit the low-ion transitions as well as the high-ion species. Remarkably, there is an extension of the C iv and Si iv profiles in the red up to about +50 km s−1.
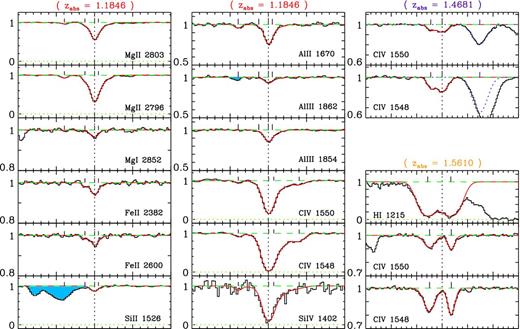
Velocity profiles and vpfit solutions of the absorption seen in the zabs = 1.1846, zabs = 1.4681 and zabs = 1.5610 systems. Blue shaded regions indicate blends with some unrelated features. Parameters of the fit can be found in Tables A1 and A2.
Elemental column densities in the zabs = 1.1846 system as well as solar abundances.
| Low-ion column densities | |||||||||||
|---|---|---|---|---|---|---|---|---|---|---|---|
| z | ΔV (km s−1) | b(km s−1) | log N(Mg ii) | log N(Mg i) | log N(O i) | log N(Fe ii) | log N(Si ii) | log N(Al ii) | log N(Al iii) | log N(C ii) | log N(H i) |
| 1.184 33 | −38.4 | 4.9 ± 0.4 | 11.27 ± 0.02 | 9.48 ± 0.36 | –a | ≤10.28 | –b | 10.80 ± 0.07 | ≤10.65 | –a | –a |
| 1.184 52 | −12.3 | 2.9 ± 0.7 | 11.35 ± 0.10 | 9.53 ± 0.28 | –a | 10.89 ± 0.08 | –b | 10.08 ± 0.36 | 10.54 ± 0.27 | –a | –a |
| 1.184 61 | 0.0 | 5.6 ± 0.2 | 12.39 ± 0.03 | 10.52 ± 0.03 | –a | 11.51 ± 0.04 | 12.48 ± 0.04 | 11.56 ± 0.03 | 11.71 ± 0.04 | –a | –a |
| 1.184 65 | +5.5 | 13.1 ± 0.8 | 12.16 ± 0.06 | ≤9.50 | –a | 10.98 ± 0.18 | 11.83 ± 0.26 | 11.28 ± 0.08 | 11.60 ± 0.08 | –a | –a |
| High-ion column densities | |||||||||||
| z | ΔV (km s−1) | Ion (X) | b (km s−1) | log N(X) | z | ΔV (km s−1) | Ion (X) | b (km s−1) | log N(X) | ||
| 1.184 33 | −38.4 | C iv | 5.5 ± 1.0 | 12.17 ± 0.05 | 1.184 33 | −38.4 | Si iv | 5.5 ± 1.0 | 12.16 ± 0.20 | ||
| 1.184 61 | 0.0 | C iv | 7.2 ± 0.5 | 13.79 ± 0.05 | 1.184 62 | 0.0 | Si iv | 7.2 ± 0.5 | 13.50 ± 0.08 | ||
| 1.184 66 | +6.9 | C iv | 19.5 ± 2.7 | 13.45 ± 0.07 | 1.184 66 | +6.9 | Si iv | 19.5 ± 2.7 | 13.16 ± 0.11 | ||
| 1.184 91 | +41.2 | C iv | 9.8 ± 2.8 | 12.68 ± 0.16 | 1.184 91 | +41.2 | Si iv | 9.8 ± 2.8 | 11.99 ± 0.21 | ||
aNot at the range of the data.
bBlended with some features.
A2 zabs = 1.3647
This absorber was studied in detail by Srianand et al. (2007) using the same data. This is a sub-DLA (log |$N_{\rm H\,{{\small I}}} = 19.30 \pm 0.30$| inferred from IUE data) with near-solar metallicity ([O/H] > −0.33). No 21-cm absorption is detected down to τ(3 σ) < 3 × 10⁻³ and the observed C i excitation indicates that the gas is warm.
A3 zabs = 1.4681, 1.5610
These two absorption systems are very weak and identified solely by the presence of the C iv and Lyα absorption (see Fig. A1; the Lyα absorption profile of the system at zabs = 1.4681 is redshifted outside the wavelength range of the data). Note that there is an absorption feature at v = +70 km s−1 in the zabs =1.4681 system which seems to mimic a C iv doublet. A single-component fit was conducted to the less blended C iv λ1550 absorption profile. As can be seen in Fig. A1 (blue dashed curves), the resulting fit does not coincide well with the blue wing of the C iv λ1548 profile, suggesting that the feature may not be a C iv doublet in the first place. Results of the fits are presented in Table A2.
High-ion and H i column densities in the zabs = 1.4681, 1.5610, 1.5965, 1.6109 absorption systems.
| z | ΔV (km s−1) | Ion (X) | b (km s−1) | log N(X) |
|---|---|---|---|---|
| zabs = 1.4681 | ||||
| 1.467 97 | −21.9 | C iv | 9.2 ± 0.5 | 12.37 ± 0.03 |
| 1.468 15 | 0.0 | C iv | 14.6 ± 0.6 | 12.73 ± 0.02 |
| zabs = 1.5610 | ||||
| 1.560 76 | −28.1 | H i | 20.6 ± 0.8 | 13.81 ± 0.02 |
| 1.561 14 | +16.4 | H i | 21.5 ± 1.0 | 13.85 ± 0.02 |
| 1.560 79 | −24.6 | C iv | 14.5 ± 0.3 | 12.81 ± 0.01 |
| 1.561 15 | +17.6 | C iv | 8.9 ± 0.2 | 12.68 ± 0.01 |
| zabs = 1.5965 | ||||
| 1.596 55 | +3.5 | H i | 46.0 | ≥17.85 |
| 1.595 36 | −134.0 | C iv | 8.3 ± 1.3 | 12.61 ± 0.05 |
| 1.595 60 | −106.2 | C iv | 8.0 ± 0.2 | 13.40 ± 0.01 |
| 1.595 90 | −71.6 | C iv | 9.2 ± 0.2 | 14.31 ± 0.02 |
| 1.596 05 | −54.3 | C iv | 8.3 ± 0.4 | 13.83 ± 0.03 |
| 1.596 52 | 0.0 | C iv | 10.6 ± 0.2 | 13.97 ± 0.01 |
| 1.596 69 | +19.6 | C iv | 5.7 ± 0.8 | 12.89 ± 0.05 |
| 1.597 04 | +60.0 | C iv | 13.0 ± 0.7 | 13.63 ± 0.03 |
| 1.597 19 | +77.3 | C iv | 5.3 ± 0.5 | 14.29 ± 0.10 |
| 1.597 39 | +100.4 | C iv | 12.2 ± 0.3 | 14.75 ± 0.03 |
| 1.595 85 | −77.4 | Si iv | 5.3 ± 1.3 | 12.05 ± 0.20 |
| 1.595 93 | −68.1 | Si iv | 4.7 ± 1.5 | 12.32 ± 0.13 |
| 1.596 04 | −55.4 | Si iv | 6.8 ± 1.5 | 12.01 ± 0.07 |
| 1.596 52 | 0.0 | Si iv | 7.2 ± 0.7 | 12.17 ± 0.07 |
| 1.596 67 | +17.3 | Si iv | 12.8 ± 3.1 | 12.08 ± 0.10 |
| 1.597 04 | +60.0 | Si iv | 12.4 ± 4.0 | 11.90 ± 0.16 |
| 1.597 20 | +78.5 | Si iv | 7.5 ± 0.6 | 12.63 ± 0.04 |
| 1.597 37 | +98.1 | Si iv | 12.2 ± 0.4 | 12.86 ± 0.01 |
| 1.595 38 | −131.6 | N v | 5.2 ± 1.4 | 12.44 ± 0.07 |
| 1.595 60 | −106.2 | N v | 13.1 ± 1.1 | 13.08 ± 0.02 |
| 1.595 88 | −73.9 | N v | 7.4 ± 1.0 | 13.17 ± 0.12 |
| 1.596 01 | −58.9 | N v | 15.5 ± 2.9 | 13.25 ± 0.11 |
| 1.596 52 | 0.0 | N v | 10.5 ± 0.4 | 13.20 ± 0.01 |
| 1.597 02 | +57.7 | N v | 17.7 ± 3.1 | 12.96 ± 0.07 |
| 1.597 21 | +79.7 | N v | 7.2 ± 0.5 | 13.35 ± 0.03 |
| 1.597 40 | +101.6 | N v | 10.3 ± 0.2 | 13.94 ± 0.01 |
| zabs = 1.6109 | ||||
| 1.610 86 | 0.0 | H i | 37.1 | ≥14.59 |
| 1.609 67 | −136.7 | C iv | 9.5 ± 1.6 | 12.28 ± 0.05 |
| 1.609 94 | −105.7 | C iv | 6.7 ± 2.9 | 11.87 ± 0.10 |
| 1.610 86 | 0.0 | C iv | 6.5 ± 0.1 | 13.89 ± 0.01 |
| 1.611 07 | +24.1 | C iv | 7.1 ± 0.1 | 13.54 ± 0.01 |
| 1.610 86 | 0.0 | N v | 6.5 ± 0.0 | 14.00 ± 0.03 |
A4 zabs = 1.5965
Fig. A2 shows the velocity profiles and vpfit solutions of the neutral hydrogen and metal line transitions associated with this system. Using the Lyα absorption profile, we could determine a lower limit to the H i column density of log N(H i) ≥ 17.85. We identify metal absorption from C iv, Si iv, N v as well as Si iii λ1206, with no trace of low-ion species. The velocity spread is ≈300 km s−1. Results of the fits are presented in Table A2. We chose not to fit the N v λ1242 because its profile appears to be contaminated by some forest absorption. Moreover, the C iv λ1550 profile is blended with the Si ii λ1526 absorption from the sub-DLA at zabs = 1.6359. The vpfit solution for this Si ii absorption derived from Si ii λ1304 alone is overplotted on top of the C iv λ1550 absorption profile as a blue curve in Fig. A2. As can be seen in the figure, the fit is not perfect at velocities of v ≈ −180, −50 ≤ v ≤ −20 and v ≈ +35 km s−1, but clearly within errors.
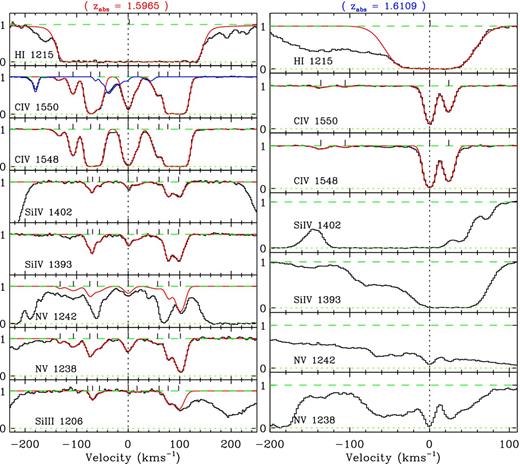
Velocity profiles and vpfit solutions of the absorption profiles of the systems at zabs = 1.5965 and 1.6109. Parameters of the fit can be found in Table A2.
A5 zabs = 1.6109
Fig. A2 shows the velocity profiles of the H i, C iv, Si iv and N v doublets associated with this system. The Lyα absorption profile of this system gives a lower limit to the H i column density of log N(H i) ≥ 14.59. We identify no low-ion transition for this system and based on the absence of any Si ii and C ii absorption we conclude that this is a high-ionization system. The N v and Si iv doublets are heavily blended in the forest; therefore, we only present in Fig. A2 the vpfit solution for the C iv doublet for which we found that a four-component fit was optimal. In addition, we have also conducted a single-component fit to the N v absorption profile at v = 0 km s−1. The parameters are listed in Table A2. The two C iv components at v = −135 km s−1 and v = −105 km s−1 are very weak but they are certainly real. Also the O vi doublet for this system is outside of our observed wavelength range.
A6 zabs = 1.6574
Fig. A3 presents the velocity profiles and the vpfit solutions for the low- and high-ion species detected in this system. The H i Lyα feature is strongly saturated over approximately 400 km s−1 (see Fig. A3) with no damping wings. We therefore did not attempt to derive highly uncertain H i column densities. For the low-ion species, we identified nine distinct components based on the fits to the Mg ii doublet, Si iiλ1526 and Al iiλ1670 transitions. A simultaneous fit was conducted on other low-ion species by fixing their redshifts and b parameters to the values obtained above. The results of this fit are presented in Table A3. The two components with the redshifts of z = 1.6574 and 1.6579 (component no. 5 and 8) are the strongest components in this system and it is only for these two components that the O i and Mg i absorption are detected. Of the five detected Si ii transitions, only Si ii λ1526 is not suffering from saturation or blending. Therefore, this is the only transition we use to derive Si ii column densities. The Fe ii λ2586 and λ2600 transitions are also contaminated by atmospheric absorption lines and were not included in the Fe ii fit. We could not identify Si iii λ1206 because it is redshifted at the exact position of the DLA absorption of the system at zabs = 1.6359. The Al iii doublet is also detected but the red wing of the Al iii λ1862 transition is blended with some unidentified absorption. It is interesting to note that the Al iii component at velocity v = +54 km s−1 is weak when this is the second strongest component in all the other low-ion species. Apart from this discrepancy, the Al iii profile does track the low-ion profiles closely enough to yield a successful simultaneous solution.
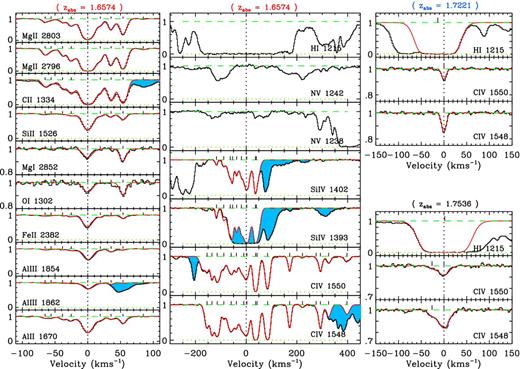
Velocity profiles and vpfit solutions of the low- and high-ion transitions in the systems at zabs = 1.6574, 1.7221 and 1.7536. Blue shaded regions show blends with unrelated absorption. Parameters of the fit can be found in Tables A3 and A4.
Elemental column densities in the zabs = 1.6574 system.
| Low-ion column densities | |||||||||||
|---|---|---|---|---|---|---|---|---|---|---|---|
| z | ΔV (km s−1) | b(km s−1) | log N(Mg ii) | log N(Mg i) | log N(O i) | log N(Fe ii) | log N(Si ii) | log N(Al iii) | log N(Al ii) | log N(C ii) | log N(H i) |
| 1.656 83 | −64.3 | 5.1 ± 0.9 | 11.87 ± 0.01 | ≤9.67 | ≤11.89 | 11.32 ± 0.12 | 11.96 ± 0.14 | 11.16 ± 0.10 | 10.86 ± 0.12 | 12.82 ± 0.04 | –a |
| 1.656 91 | −55.3 | 9.8 ± 5.7 | 11.68 ± 0.02 | ≤10.12 | ≤12.39 | 11.25 ± 0.18 | 11.58 ± 0.43 | 11.17 ± 0.12 | 11.20 ± 0.07 | 12.90 ± 0.04 | –a |
| 1.657 06 | −38.4 | 3.5 ± 0.4 | 11.88 ± 0.01 | ≤9.66 | ≤11.89 | 11.10 ± 0.15 | 11.79 ± 0.16 | 11.13 ± 0.08 | 11.21 ± 0.04 | 12.98 ± 0.03 | –a |
| 1.657 18 | −24.8 | 6.5 ± 0.2 | 12.38 ± 0.00 | ≤9.93 | ≤12.14 | 11.66 ± 0.05 | 12.40 ± 0.05 | 11.59 ± 0.03 | 11.56 ± 0.02 | 13.40 ± 0.01 | –a |
| 1.657 40 | 0.0 | 9.3 ± 0.1 | 13.45 ± 0.00 | 10.96 ± 0.04 | 12.92 ± 0.09 | 12.76 ± 0.01 | 13.55 ± 0.01 | 12.57 ± 0.00 | 12.40 ± 0.01 | 14.38 ± 0.01 | –a |
| 1.657 57 | +19.2 | 4.8 ± 0.3 | 12.20 ± 0.01 | ≤9.89 | ≤11.67 | 11.59 ± 0.05 | 12.28 ± 0.06 | 11.36 ± 0.05 | 11.45 ± 0.03 | 13.22 ± 0.02 | –a |
| 1.657 72 | +36.1 | 5.0 ± 0.1 | 12.55 ± 0.00 | ≤10.10 | ≤12.28 | 11.25 ± 0.11 | 12.50 ± 0.04 | 11.75 ± 0.02 | 11.30 ± 0.04 | 13.72 ± 0.01 | –a |
| 1.657 88 | +54.1 | 5.7 ± 0.0 | 12.85 ± 0.00 | 10.94 ± 0.03 | 12.87 ± 0.08 | 11.94 ± 0.03 | 12.81 ± 0.02 | 11.37 ± 0.05 | 11.73 ± 0.02 | 13.96 ± 0.01 | –a |
| 1.658 15 | +84.6 | 4.8 ± 1.3 | 11.08 ± 0.06 | ≤9.70 | ≤12.02 | ≤10.28 | ≤11.33 | 10.67 ± 0.24 | 10.26 ± 0.38 | –b | –a |
| High-ion column densities | |||||||||||
| z | ΔV (km s−1) | Ion (X) | b (km s−1) | log N(X) | z | ΔV (km s−1) | Ion (X) | b (km s−1) | log N(X) | ||
| 1.656 04 | −153.5 | C iv | 10.6 ± 0.5 | 13.45 ± 0.02 | 1.659 85 | +276.3 | C iv | 8.1 ± 3.9 | 12.26 ± 0.13 | ||
| 1.656 21 | −134.3 | C iv | 6.9 ± 0.5 | 13.54 ± 0.03 | 1.660 00 | +293.2 | C iv | 8.5 ± 0.2 | 13.36 ± 0.01 | ||
| 1.656 39 | −114.0 | C iv | 12.1 ± 0.4 | 13.83 ± 0.01 | 1.660 29 | +325.8 | C iv | 12.2 ± 0.3 | 13.11 ± 0.01 | ||
| 1.656 62 | −88.0 | C iv | 6.4 ± 0.3 | 12.84 ± 0.02 | 1.660 93 | +398.0 | C iv | 15.2 ± 0.4 | 13.06 ± 0.01 | ||
| 1.656 88 | −58.7 | C iv | 17.0 ± 0.4 | 13.75 ± 0.01 | 1.656 36 | −117.3 | Si iv | 5.4 ± 1.0 | 12.29 ± 0.04 | ||
| 1.657 06 | −38.4 | C iv | 5.2 ± 0.4 | 12.93 ± 0.04 | 1.656 62 | −88.0 | Si iv | 7.7 ± 0.9 | 12.52 ± 0.04 | ||
| 1.657 32 | −9.0 | C iv | 21.3 ± 1.7 | 13.87 ± 0.07 | 1.656 87 | −59.8 | Si iv | 12.0 ± 1.2 | 13.21 ± 0.06 | ||
| 1.657 43 | +3.4 | C iv | 9.3 ± 1.2 | 13.35 ± 0.16 | 1.656 93 | −53.0 | Si iv | 4.4 ± 0.8 | 12.84 ± 0.11 | ||
| 1.657 73 | +37.2 | C iv | 8.1 ± 0.2 | 14.26 ± 0.02 | 1.657 07 | −37.2 | Si iv | 7.2 ± 1.1 | 12.93 ± 0.06 | ||
| 1.657 78 | +42.9 | C iv | 15.9 ± 2.2 | 13.56 ± 0.13 | 1.657 24 | −18.0 | Si iv | 8.7 ± 1.4 | 13.04 ± 0.07 | ||
| 1.658 15 | +84.6 | C iv | 9.5 ± 0.1 | 14.04 ± 0.00 | 1.657 42 | +2.2 | Si iv | 11.7 ± 0.4 | 13.65 ± 0.01 | ||
| 1.658 92 | +171.4 | C iv | 7.1 ± 0.1 | 13.29 ± 0.00 | 1.657 73 | +37.2 | Si iv | 4.2 ± 0.4 | 13.45 ± 0.04 | ||
| 1.659 37 | +222.2 | C iv | 8.6 ± 0.9 | 12.26 ± 0.03 | 1.657 76 | +40.6 | Si iv | 13.8 ± 1.1 | 13.48 ± 0.02 | ||
aToo uncertain.
bBlended with some features.
The vpfit solutions and velocity profiles of the C iv and Si iv doublets are also given in Fig. A3. The two species were fitted individually. Due to the very large velocity spread of this system (≈650 km s−1), part of the C iv λ1548 profile is blended with the C iv λ1550 profile. In Fig. A3, the blue shaded area in the C iv λ1548 velocity panel (resp. C iv λ1550 velocity panel) indicates absorption from the C iv λ1550 (resp. C iv λ1548). The Si iv λ1393 absorption is heavily blended with the absorption lines of the forest and we chose not to include it in the fit. The fits to the C iv and Si iv doublets were successful with 17 and 9 individual components, respectively. It is worth noting that due to the severe blending of the Si iv profile, our attempt to tie the C iv and Si iv absorption profiles failed, implying that the derived Si iv column densities might not be so accurate. The velocity regions where the N v doublet is expected are also depicted in Fig. A3. We could not convince ourselves that any significant N v absorption is present although some faint feature can be seen around +50 km s−1. Table A3 lists the redshift, b value and column density along with 1σ error of every velocity component from the vpfit fit of the high-ion species.
A7 zabs = 1.7221, 1.7536
These two absorption systems are very weak and identified solely by the presence of the C iv and Lyα absorption (see Fig. A3). The expected Mg ii doublets of these absorbers are either not detected or lost in the atmospheric absorption lines. The parameters of the fits are listed in Table A4.
High-ion and H i column densities for the zabs = 1.7221, 1.7536, 1.8994, 1.9253 and 2.2298 absorbers.
| z | ΔV (km s−1) | Ion (X) | b (km s−1) | log N(X) |
|---|---|---|---|---|
| zabs = 1.7221 | ||||
| 1.721 98 | −14.3 | H i | 30.3 | ≥14.80 |
| 1.722 11 | 0.0 | C iv | 6.0 ± 0.2 | 12.43 ± 0.01 |
| zabs = 1.7536 | ||||
| 1.753 57 | +1.1 | H i | 36.1 | ≥14.81 |
| 1.753 32 | −26.1 | C iv | 11.3 ± 1.4 | 12.13 ± 0.06 |
| 1.753 56 | 0.0 | C iv | 15.5 ± 0.6 | 12.80 ± 0.01 |
| zabs = 1.8994 | ||||
| 1.898 38 | −110.6 | C iv | 6.3 ± 1.0 | 11.83 ± 0.04 |
| 1.898 69 | −78.6 | C iv | 7.1 ± 0.1 | 12.76 ± 0.01 |
| 1.899 01 | −45.5 | C iv | 6.8 ± 0.6 | 12.26 ± 0.03 |
| 1.899 21 | −24.8 | C iv | 8.7 ± 0.6 | 12.63 ± 0.04 |
| 1.899 45 | 0.0 | C iv | 12.7 ± 0.9 | 13.30 ± 0.05 |
| 1.899 57 | +12.4 | C iv | 6.6 ± 2.3 | 12.35 ± 0.32 |
| 1.900 05 | +62.0 | C iv | 15.8 ± 0.5 | 12.68 ± 0.01 |
| 1.900 39 | +97.2 | C iv | 8.2 ± 1.6 | 11.81 ± 0.06 |
| 1.900 62 | +120.9 | C iv | 5.9 ± 0.3 | 12.36 ± 0.01 |
| 1.901 40 | +201.6 | C iv | 6.8 ± 0.3 | 12.46 ± 0.02 |
| 1.901 61 | +223.3 | C iv | 9.8 ± 0.9 | 12.39 ± 0.03 |
| 1.901 82 | +244.9 | C iv | 5.7 ± 0.8 | 12.33 ± 0.04 |
| zabs = 1.9253 | ||||
| 1.925 33 | 0.0 | H i | 54.6 | ≥15.12 |
| 1.925 27 | 0.0 | C iv | 13.7 ± 0.8 | 12.25 ± 0.02 |
| zabs = 2.2298 | ||||
| 2.229 79 | 0.0 | C iv | 7.1 ± 0.3 | 12.19 ± 0.01 |
| 2.229 78 | −1.0 | O vi | 19.3 ± 0.9 | 13.61 ± 0.02 |
| 2.230 16 | +34.3 | O vi | 11.6 ± 5.5 | 12.51 ± 0.18 |
A8 zabs = 1.8994
This is another system identified only by the presence of Lyα and the C iv doublet. No other low- or high-ion species is detected. The velocity profiles and vpfit solutions for this C iv system are presented in Fig. A4 together with the wavelength ranges where Si iv doublet absorption are expected. We found 12 components were required for an optimal fit to the C iv absorption profiles. The results of the fit are presented in Table A4. This system extends over ≈400 km s−1 in velocity space.
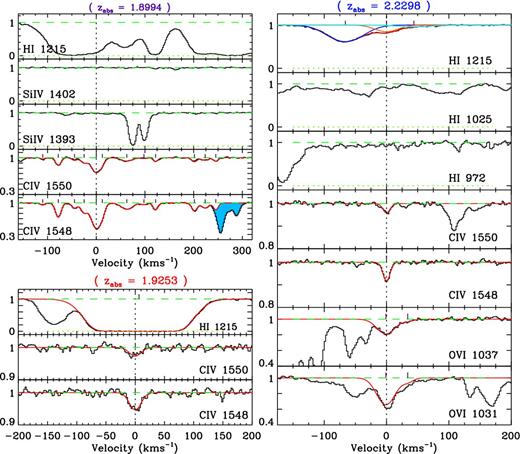
Observed velocity profiles and vpfit solutions of several transitions seen in the zabs = 1.8994, 1.9253 and 2.2298 absorbers. The blue shaded region shows blends with other lines. Parameters of the fit can be found in Table A4.
A9 zabs = 1.9253
This absorption system is very weak and identified by the presence of the C iv and Lyα absorption (see Fig. A4). The expected Mg ii doublets of the absorber is either not detected or lost in the atmospheric absorption lines. The parameters of the fits are listed in Table A4.
A10 zabs = 2.2298
This system is recognized mainly by its C iv and O vi doublets. The corresponding H i absorption profile is very weak. However, a three-component fit was conducted to the Lyα absorption profile (Fig. A4) and yields log |$N_{\rm H\,{{\small I}}} = 12.75 \pm 0.08$| (orange curve). The absorption straddles two other H i absorption profiles with log |$N_{\rm H\,{{\small I}}} = 13.38 \pm 0.01$| (blue curve) and log |$N_{\rm H\,{{\small I}}} = 12.30 \pm 0.22$| (cyan curve). Moreover, a single component fit to the C iv doublet was optimal, yielding |$\chi _{\nu }^2$| = 1.09 and |$P_{\chi ^2}$| = 0.313. The O vi doublet is suffering from blending and we performed a two-component Voigt profile fit to the O vi λ1037 transition, which appears to be less blended than the O vi λ1031. The fit was successful, yielding |$\chi _{\nu }^2$| = 1.12 and |$P_{\chi ^2}$| = 0.308. Note that, due to the poor alignment, the fit to different high-ions were performed separately. In Fig. A4, the vpfit results are superimposed on to the observations as red lines. Table A4 gives the fit parameters.
Finally, Table A5 presents the total column densities of the C iv and Si iv species of the systems studied in this work. In this table, columns 2 and 3 indicate the velocity width of the C iv and Si iv absorption features, respectively. The last two columns also give the C iv/H i and Si iv/H i column density ratios.
Total column densities of the C iv and Si iv species of the systems studied in this work. Column 1 shows the redshifts of the systems, columns 2 and 3 indicate the velocity width of the C iv and Si iv absorption features, columns 3, 4 and 5 indicate the total column densities of C iv, Si iv and H i, respectively, and finally, the last two columns give the C iv/H i and Si iv/H i column density ratios.
| z | ΔV (C iv) (km s−1) | ΔV (Si iv) (km s−1) | log N(C iv) | log N(Si iv) | log N(H i) | log N(C iv)/N(H i) | log N(Si iv)/N(H i) |
|---|---|---|---|---|---|---|---|
| 1.1846 | 79.6 | 79.6 | 13.98 ± 0.04 | 13.68 ± 0.06 | – | – | – |
| 1.4681 | 21.9 | – | 12.89 ± 0.01 | – | – | – | – |
| 1.5610 | 42.2 | – | 13.05 ± 0.01 | – | 14.13 ± 0.01 | −1.08 ± 0.01 | – |
| 1.5965 | 234.4 | 175.5 | 15.08 ± 0.02 | 13.28 ± 0.02 | ≥17.85 | ≤ −2.77 | ≤ −4.57 |
| 1.6109 | 160.8 | – | 14.06 ± 0.01 | – | ≥14.59 | ≤ −0.53 | – |
| 1.6359 | 187.6 | 187.6 | 13.54 ± 0.09 | 12.81 ± 0.05 | 19.15 ± 0.04 | −5.61 ± 0.09 | −6.34 ± 0.06 |
| 1.6574 | 551.5 | 157.9 | 14.84 ± 0.02 | 14.18 ± 0.01 | – | – | – |
| 1.6720 | 582.0 | 499.1 | 15.08 ± 0.01 | 14.18 ± 0.04 | 19.78 ± 0.05 | −4.70 ± 0.05 | −5.60 ± 0.06 |
| 1.7221 | Single-comp. | – | 12.43 ± 0.01 | – | ≥14.80 | ≤ −2.37 | – |
| 1.7536 | 26.1 | – | 12.89 ± 0.02 | – | ≥14.81 | ≤ −1.92 | – |
| 1.8994 | 355.5 | – | 13.70 ± 0.02 | – | – | – | – |
| 1.9253 | Single-comp. | – | 12.25 ± 0.02 | – | ≥15.12 | ≤ −2.87 | – |
| 2.0422 | 131.0 | – | 13.70 ± 0.02 | – | ≤ 12.90 | ≥ +0.80 | – |
| 2.1979 | 28.1 | 7.5 | 13.24 ± 0.02 | 12.23 ± 0.04 | ≥15.98 | ≤ −2.74 | ≤ −3.72 |
| 2.2028 | 43.1 | 43.1 | 14.14 ± 0.06 | 13.33 ± 0.06 | ≥15.54 | ≤ −1.40 | ≤ −2.21 |
| 2.2298 | Single-comp. | – | 12.19 ± 0.01 | – | 12.75 ± 0.08 | −0.56 ± 0.08 | – |
| 2.2363 | 48.2 | – | 12.66 ± 0.04 | – | 14.18 ± 0.05 | −1.52 ± 0.06 | – |
