


Abstract
Samples of amorphous MgSiO3 annealed at temperature steps leading up to their crystallization temperature show a rise in photoluminescence activity, peaking at ∼450°C. The photoluminescence band has a main peak at 595 nm and a weaker peak at 624 nm. We present laboratory data to show that the maximum in photoluminescence activity is related to substantial structural reordering that occurs within a relatively narrow temperature range. We attribute the origin of the photoluminescence to non-bridging oxygen hole centre defects, which form around ordered nanosized domain structures as a result of the breakup of tetrahedral connectivity in the disordered inter-domain network, aided by the loss of bonded OH. These defects are removed as crystallization progresses, resulting in the decrease and eventual loss of photoluminescence. Thermally processed hydrogenated amorphous silicate grains could therefore represent a potential carrier of extended red emission.
INTRODUCTION
Extended red emission (ERE) is a broad (Δλ ∼ 60–120 nm), featureless emission band with a peak wavelength between 600 and 850 nm first detected in the spectrum of HD 44179 (the Red Rectangle; Schmidt, Cohen & Margon 1980). ERE is commonly seen in environments where both dust and ultraviolet (UV) photons are present (Witt & Vijh 2004) and has been detected in reflection nebulae, dark nebulae, cirrus clouds, planetary nebulae, H ii regions, novae, the diffuse interstellar medium (ISM) and the haloes and high galactic latitude interstellar clouds of galaxies (e.g. Witt & Schild 1988; Witt & Boroson 1990; Scott, Evans & Rawlings 1994; Szomoru & Guhathakurta 1998; Smith & Witt 2002; Rhee et al. 2007; Berné et al. 2008; Witt et al. 2008). Darbon, Perrin & Sivan (1999) showed that the peak wavelength and width of the ERE band are correlated, while Smith & Witt (2002) showed that the peak wavelength also correlates with the density of the UV radiation field in a given ERE source. Examples of ERE illustrating the observational variation between different environments are shown in Fig. 1.
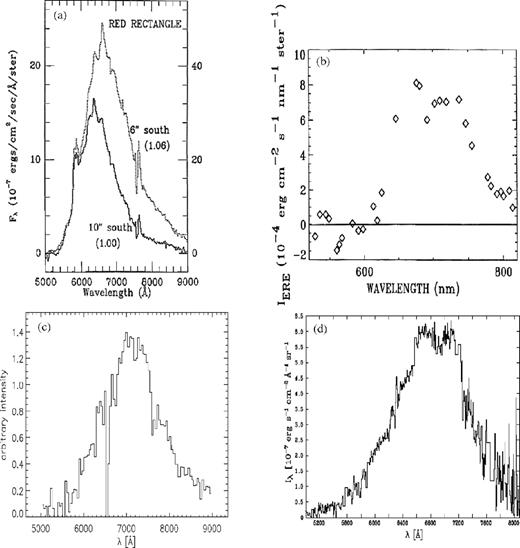
Observed ERE for (a) the Red Rectange (from Witt & Boroson 1990); (b) the planetary nebula NGC 7027 (from Furton & Witt 1992); (c) the NGC 2327 reflection nebula (from Gordon, Witt & Friedmann 1998) and (d) the north-western filament of the reflection nebula NGC 7023 (Witt, personal communication, see also Witt et al. 2006). Panels (a)–(c) reproduced by permission of the AAS.
Since many solids emit visible luminescence when exposed to UV light, it is assumed that ERE is a photoluminescence (PL)1 process powered by far-UV photons. In the ISM, ∼4 per cent of the energy absorbed by dust at wavelengths <550 nm is emitted in the form of ERE, suggesting the carrier must be a major component of the interstellar grain population. The ERE carrier may have originally condensed in the circumstellar environment of protoplanetary and planetary nebulae and subsequently been ejected into the ISM (Witt, Gordon & Furton 1998). To survive the journey through the ISM and to spread throughout the halo of the Galaxy requires a robust carrier material. The intrinsic quantum yield of ERE may be as high as ∼50 per cent with its carrier intercepting ∼20 per cent of the photons absorbed by interstellar dust in the 90–550 nm range (Smith & Witt 2002), which therefore limits the chemical composition of the ERE carrier to the few elements that are both abundant and highly depleted, i.e. C, Fe, Si and Mg. Since metals do not produce PL, the remaining possibilities are C- and Si-bearing solids.
The physical nature of the ERE carrier is still contentious and various potential carriers have been proposed. These include hydrogenated amorphous carbon (Duley 1985, 2001; Duley & Williams 1988; Witt & Schild 1988; Furton & Witt 1990; Furton & Witt 1992; Duley, Seahra & Williams 1997; Seahra & Duley 1999; Godard & Dartois 2010), quenched carbonaceous composites (Sakata et al. 1992), C60 (Webster 1993), diamond (Duley 1988; Chang, Chen & Kwok 2006), embedded polycyclic aromatic hydrocarbon molecules (Wada et al. 2009), isolated dehydrogenated carbon clusters (Kurth et al. 2013) and silicon nanoparticles (Ledoux et al. 1998; Witt et al. 1998; Smith & Witt 2002). In a 2003 review, Draine (2003) noted that, while a number of these proposed identifications have been ruled out, the arguments against them are not conclusive. The fact that evidence for ERE was found in C-rich planetary nebulae (Furton & Witt 1992) initially pointed to a carbonaceous carrier, but there appears to be no correlation between the 3.3 μm unidentified infrared (UIR) feature, generally attributed to polycyclic aromatic hydrocarbons (PAHs), and the ERE in the Red Rectangle (Kerr et al. 1999); while amorphous carbon struggles to meet both efficiency and spectral constraints (Godard & Dartois 2010). Later Infrared Space Observatory (ISO) observations of C-rich planetaries showed the presence of strong crystalline silicate features (Waters et al. 1998). However, ERE has not been observed in O-rich planetaries, appearing to make a straightforward association with O-rich materials difficult, particularly since the Red Rectangle, which is the most prominent ERE source with local dust production, is a C-rich environment.
Nevertheless silicates are a well known and abundant dust species whose presence in various environments is ubiquitous and Koike et al. (2002a,b, 2006) noted the similarity between the Red Rectangle ERE and thermoluminescence measured from gamma-ray irradiated synthetic forsterite (Mg2SiO4). This gave an intense peak at 645–655 nm, while only very weak luminescence was observed in natural unirradiated olivine. However, other than these studies (and an apparently unpublished preprint by Koike et al. 2004, suggesting a UV excited post-thermoluminescence PL effect in irradiated forsterite, attributed by them to nanoforsterite structures), there appears to have been little experimental or theoretical work examining the possibility of silicates as ERE carriers.
Possibly related to the ERE phenomenon is the weak very broad-band structure (VBS) observed between 478 and 577 nm as a shallow depression on the interstellar extinction curve, first reported by Whiteoak (1966; see also Hayes et al. 1973; Schild 1977; van Breda & Whittet 1981; Krelowski, Maszkowski & Strobel 1986). The VBS carrier has been proposed variously as an absorption effect (Hayes et al. 1973; Manning 1975; Huffmann 1977), extinction by a population of very small amorphous carbonaceous grains (Jenniskens 1994) or as luminescence from hydrogenated amorphous carbon (Duley & Whittet 1990).
In this paper we present PL measurements for samples of amorphous MgSiO3 that have been annealed at temperatures leading up to crystallization and show that their PL activity grows and peaks within a relatively narrow temperature range coinciding with the fragmentation of the silicate network that connects between nanosized, but ordered domains. We suggest that silicate PL arises from non-bridging oxygen hole centres that form on the outer surfaces of the domain structures as a result of interdomain network breakup and loss of bonded OH.
EXPERIMENTAL
Sample manufacture
Data collection
Photoluminescence measurements
Without further preparation, approximately equal quantities of powdered sample for each of the annealing temperatures were loaded on glass microscope slides such that each sample presented a roughly circular area ∼8 mm diameter and >0.5 mm thick. The surface was levelled off using the flat side of a stainless steel spatula. PL spectra were measured using a Horiba Jobin Yvon confocal LabRam 800 spectrometer employing 532 nm laser excitation operated at 30 mW. A 600 g/mm spectrometer grating was used in conjunction with a 100 μm entrance slit and 300 μm confocal hole size; a 10× objective lens was used to both focus the incident laser spot (via imaging camera) and gather the PL radiation. In this configuration the laser spot on the sample was typically 300–400 μm in diameter, depending on the quantity of sample that lay in the focal plane. Indeed, as the overall sample surface was highly irregular due to the powder grains themselves being irregular in shape and orientation, data were collected from at least 10 randomly selected locations per sample and the PL spectra averaged. The spectra per location were collected in 0.051 nm steps from 534 to 1000 nm in overlapping 50 nm segments, with each segment being the average of three 3 s collections. We did not observe any systematic size-dependent effects, in that spots containing numerous smaller particles tended to give similar PL profiles to those with only a few larger ones. However for any given sample, the measured intensity often showed wide variations from spot to spot, due to various physical factors, including the uneven nature of the sample surface, particle orientation, size and possible variations in the internal homogeneity of the constituent particles in respect of the PL producing species. However, all measured spectra became asymptotically flat beyond ∼900 nm and the intensity at 1000 nm (based on an average of the 20 data points between 999 and 1000 nm) was therefore used to normalize each individual spectrum prior to averaging.
X-ray characterization
Materials with structural correlations that extend only over the nanometre length-scale give only broad diffuse X-ray scattering patterns rather than sharp Bragg diffraction peaks and represent the size domain where traditional X-ray crystallographic methods become less effective. However the total scattering (TS) method, also known as the pair distribution function (PDF) method, though similar to conventional powder diffraction, provides a means of extracting structural correlations at nanoscale distances from materials that do not possess long-range periodicities (see reviews by Proffen et al. 2003, 2006; Proffen & Page 2004). Therefore, to supplement the structural analysis previously reported for these samples by Thompson et al. (2012, hereafter referred to as TPT, see summary in Section 3.3), TS measurements were also made on three amorphous samples using beamline I12 at the Diamond Light Source synchrotron. These were the as-prepared sample dried at 75°C and two that had been annealed at 300 and 600°C, respectively. These correspond to annealing temperatures at either side of the range where the strongest PL was observed and provide a ‘before and after’ structural reference. Also for comparison, TS data were collected on a sample that had been extensively crystallized by annealing at 900°C.
The main measurement criterion for TS compared to conventional powder diffraction is the need to measure to high magnitude values of the X-ray scattering vector, |$\boldsymbol Q$| (|$Q = \vert {\boldsymbol Q} \vert =4\pi \lambda ^{-1}\sin \theta$|, where λ is the X-ray wavelength and θ the incident angle). This captures information relating to short-range atom–atom distances and is essential for the resolution of atomic distances by Fourier inversion (see Section 3.2). The need for measuring at high Q and the weakness of the scattered signal in that region necessarily involves the use of high X-ray energies and relatively long exposure times, depending on X-ray source output characteristics. For X-rays of energy E the maximum theoretically accessible Q is Qmax = 4πE/hc Å−1. In practice however Qmax is limited by the experimental geometry and detection arrangements, as is the minimum, Qmin, value of Q below which data cannot be collected (e.g. limited by the backstop arrangements necessary to prevent primary beam entering the detector).
For the TS measurements samples were loaded into 2-mm Kapton capillaries and scattering data collected using 87.4 keV monochromatic X-rays produced by a 4.2 T superconducting multi-pole wiggler insertion device in the Diamond storage ring. Data collection involved 720 summed exposures per sample of 4 s each, acquired using a large pixellated 2D area detector (Thales Pixium 4343 with CsI scintillator on amorphous Si substrate: 148 μm2 pixel size, 2880 × 2881 pixels; Daniels & Drakopoulos 2009). The detector was offset from the beam centre such that, at a distance of 500 mm from the sample, scattering data could be recorded out to Qmax = 30.8 Å−1. To provide background correction, equivalent empty capillary and air scatter measurements were also made. The scattered intensity in the form of portions of the Debye–Scherrer rings captured on the area detector for each sample was integrated to give a two-dimensional data set of intensity as a function of scattering angle (converted to Q), which was then corrected for background scatter and transformed to radial distribution functions, G(r) (see next section), using the PDFgetX2 software.2 The X-ray energy (and precise sample-detector distance) was calibrated using the measured pattern from a standard reference sample of CeO2 of known lattice parameter.
RESULTS AND ANALYSIS
Photoluminescence measurements
Fig. 2 shows the averaged PL spectra for each annealing temperature. The broad PL band shows a main peak at ∼595 nm (2.08 eV), with a weaker secondary peak at ∼624 nm (1.98 eV). The overall strength of the band exhibits a strong variation with annealing temperatures and Fig. 3 plots the integrated PL signal for each temperature step, showing a clear peak in the PL activity around ∼450°C. The width of the error bars reflects the variation in measured intensity, due to both physical measurement factors (i.e. sample volume) and any intrinsic inhomogeneity in the distribution of PL centres within the silicate, as already discussed. However a clear rise in PL activity is observed above 200°C, with a very narrow peak between 400 and 475°C. Above this the PL activity decreases back towards the base line level at 600°C.
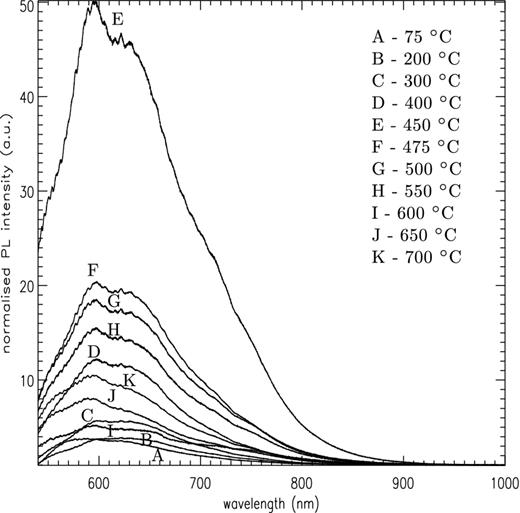
Normalized PL spectra for amorphous MgSiO3 annealed at increasing temperatures between RT and 700°C.
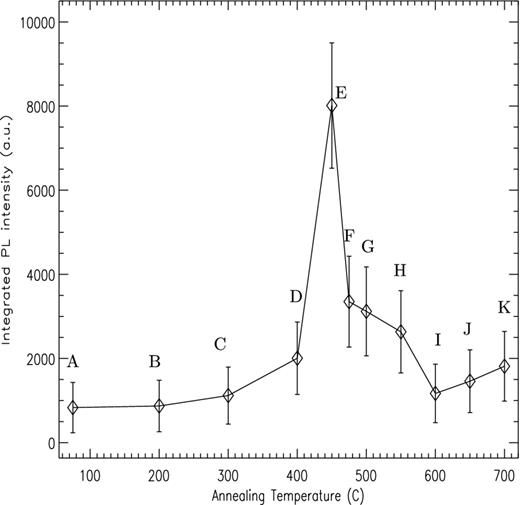
Integrated intensity of the PL signal for amorphous MgSiO3 as a function of annealing temperature. Labels A–K as per Fig. 2.
Total scattering measurements
The measured TS data are shown in Fig. 4. The as-prepared and the two samples annealed at 300 and 600°C show TS patterns characteristic of scattering from non-crystalline structures (i.e. no sharp features), while the sample annealed at 900°C shows well defined crystalline structure, evidenced by the appearance of sharp Bragg features.

Measured X-ray total scattering diffraction patterns for amorphous MgSiO3. (a) As manufactured (i.e. dried at 75°C); (b) annealed at 300; (c) 600 and (d) 900°C.
In Fig. 5, the G(r) radial PDFs obtained by Fourier inversion are shown for the four samples. Each peak in G(r) corresponds to a discrete atom pair distance and for the sample crystallized at 900°C atom to atom correlations clearly extend beyond the 50 Å shown in the plot. The three amorphous samples however show heavily damped G(r) signals. The distance at which the oscillations in G(r) diminish to zero represents the size of the coherent scattering domain (CSD) and is a measure of the distance over which the constituent atoms exhibit structural correlation. Both the as-manufactured and the 300°C samples show a CSD size of ∼30 Å, while in the 600°C sample the CSD has reduced to ∼15 Å, showing that there has been a reduction in the silicate's longer range structural ordering as a direct result of annealing, that is, the silicate has become more amorphous.
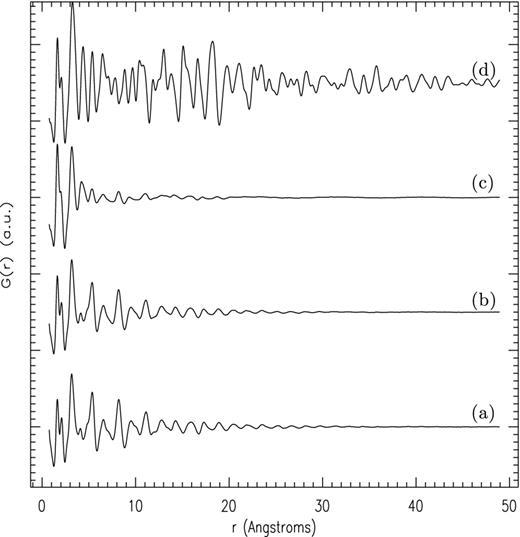
Radial distribution functions, G(r), obtained from total scattering measurements for annealed amorphous MgSiO3. Labels as per Fig. 4.
There are two competing structural models for amorphous silicates: (i) the Zachariasen–Warren model (Zachariasen 1932; Warren 1933, 1934; Warren, Krutter & Morningstar 1936) in which Si–O tetrahedra are linked together in a statistically disordered way to form a continuous random network with no long-range periodicity and (ii) the microcrystal model proposed by Lebiediev (1921), Randall, Rooksby & Cooper (1930a,b) and Valenkow & Porai-Koshitz (1936). Here a continuous statistically random network provides links between the surfaces of ultrafine microcrystalline regions (∼15–20 Å) to form a domain structured material (Verweij & Konijnendijk 1976). In Fig. 5, for distances less than ∼10 Å, the G(r) for all three samples shows very close similarities in the silicate structure in terms of the number, shape and positions of the component peaks, showing the amorphous silicate is described well by a nanoscale domain structured model.
Summary of results from previous analyses
The evolution of short- and medium-range structure leading up to crystallization in these samples was investigated previously by TPT using Fourier transform infrared spectroscopy (FTIR) at 10 μm, Raman spectroscopy and X-ray scattering at low Q. The Raman and X-ray data revealed that as the annealing temperature increases, there is a build up of strain within the silicate network, which is released at ∼450°C, causing a relaxation of both the Si–O–Si bond angle and Si–O bond length. Decomposing the 10 μm band at each temperature step allowed these changes to be related to changes in the intertetrahedral connectivity. As implied by the stoichiometry of the MgSiO3 composition, SiO3 was found to be the initially dominant species and increased in proportion with rising annealing temperature as other tetrahedral species became incorporated into the SiO3 chain structure. However in the region of ∼450°C the proportion of SiO3 rapidly decreased as species with greater numbers of non-bridging oxygen (NBO) atoms form. This coincides with a relaxation of the strain due to the breakup, or fragmentation, of the larger chain (and sheet) structures built from interconnected tetrahedra.
The X-ray analysis performed by TPT focused on the scattering characteristics at low Q (i.e. low scattering angle), however, in Fig. 6 the conventional powder diffraction data collected by TPT are plotted for a wider angular range (equivalent to 0.2–5 Å−1 in Q), showing qualitatively the evolution of the amorphous phase and formation of crystalline structure at ∼650°C (pattern J in the figure). These data were recorded on the I11 beamline (Thompson et al. 2009) at the Diamond Light Source using flat-plate reflection geometry and low-background, high-resolution Si analyser crystals. The scattering features clearly visible in the 5°–30° 2θ range appear in the 2–7 Å−1 range in the TS patterns of Fig. 4, albeit with lower resolution due to differences in detection arrangements. Comparing Fig. 6 with Fig. 3 shows the peak in PL activity is clearly associated with the amorphous phase. The conclusion from the TS data that the 600°C sample has become less ordered is also evident in the conventional powder pattern I, which despite the presence of a few exceedingly weak trace-level Bragg features which are below the detection level of the TS area detector, shows a loss of strength for the two prominent amorphous features at 14° and 23° 2θ.
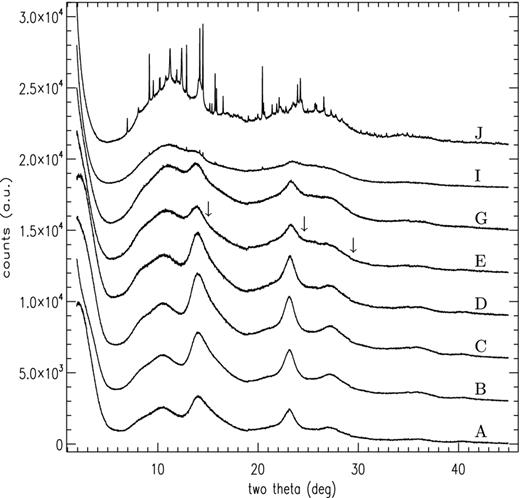
Conventional X-ray powder diffraction patterns for the MgSiO3 samples measured using 15 keV X-rays at selected annealing steps. Plots are offset in y-axis for clarity, labels as per Fig. 2. The arrows shown for pattern E indicate the position of where the three strongest diffraction lines of pure-phase silicon should occur if nanocrystalline silicon is present in the sample (see Section 4.1).
DISCUSSION
The annealing temperature at which PL activity becomes strongest closely coincides with the temperature at which specific modifications in the form of structural fragmentation and changing of the non-bridging oxygen distribution were previously observed to occur; and suggests a relationship between structure and PL. Below we discuss four possible mechanisms for the observed PL: formation of Si nanoparticles, impurity doping, network deformation and non-bridging oxygen hole centres, concluding that non-bridging oxygen hole centres are the likely source of the PL.
Embedded Si nanoparticles
Si nanoparticles (SNPs; Ledoux et al. 1998, 2000, 2001, 2002; Witt et al. 1998) with 1.5–5.0 nm diameters are widely considered to be a strong contender for the ERE carrier (Witt & Vijh 2004). PL in SNPs is believed to arise from a combination of quantum confinement in nanocrystals and the passivation of dangling surface bonds by H, O, N, C or Fe atoms to inhibit non-radiative electron-hole recombination (Kovalev et al. 1999), though the details are still debated (e.g. Hannah et al. 2012). Laboratory studies involving O and H passivation show SNPs with H-passivation and diameters of <2.5 nm produce luminescence at blue and near-UV wavelengths, while O-passivation produces only red luminescence (Wolkin et al. 1999; Zhou, Brus & Friesner 2003). Because neither blue PL nor the Si–H absorption feature at 4.6 μm is observed under interstellar conditions, O-passivation is considered more probable (Witt et al. 1998).
Once produced in a circumstellar outflow O-passivated SNPs (O-SNPs) could persist, even in the ISM with abundant H atoms, since the Si–O bond is energetically two to three times stronger than the Si–H bond. However, such particles would also contribute to the 10 μm silicate band via Si–O vibrations and stochastically heated O-SNPs should also produce a 20 μm emission band in excess of observationally established limits, while requiring an unrealistically high proportion of the Si abundance to be in the form of SNPs (Li & Draine 2002). In addition, experiments indicate SNPs could lose their PL capability in environments where cosmic ion bombardment is significant (Baratta et al. 2004). These problems may be overcome if O-SNPs are either attached to, or embedded within, larger grains (Li & Draine 2002; Witt & Vijh 2004). Experiments involving embedded SNPs produced by ion implantation into solids show SNP luminescence can be preserved (e.g. Iwayama et al. 2002), but may be redshifted (relative to PL from ‘free-standing’ SNPs) by compressive strain imparted by the embedding matrix (Kůsová et al. 2012). X-ray absorption near edge structure (XANES) spectroscopy at the Si K-edge shows the average environment surrounding the Si atoms in these silicates prior to annealing (i.e. weak PL activity) is dominated by medium-range tetrahedral Si–O symmetry (Thompson 2008) rather than cubic Si–Si environments. Fig. 7 compares the first 8 Å of the G(r) obtained for the sample annealed at 600°C (i.e. weak post-annealing PL) with theoretical G(r)s calculated using the discus diffuse scattering simulation software (Neder & Proffen 2008) for 2 nm spheres of crystalline silicon (Fd3m structure and 5.4307 Å lattice parameter) and crystalline enstatite (Pbca structure, lattice parameters 18.216, 8.813, 5.179 Å). Although the experimentally derived G(r) contains less fine structure, reflecting its more disordered nature (crystallographic Debye–Waller temperature factors were used in the simulations), the general peak positions are quite well accounted for by the silicate structure. Peaks at 2.35 and 3.83 Å corresponding to the first and second Si–Si distances are clearly absent from the experimental G(r) (and are similarly absent in the other experimentally derived G(r)s).

Calculated radial distribution functions, G(r), out to 8 Å for (a) bare 2 nm diameter Si particles and (b) 2 nm silicate particles with enstatite structure compared with (c) measured G(r) for the amorphous silicate annealed at 600°C.
However, there are reports in the literature regarding SNP PL in crystalline and amorphous SiO2 induced by Si implantation (e.g. Linnros et al. 1999), so we might consider the possibility that thermally induced network fragmentation might produce SNPs, that are naturally O-passivated, via the formation and linking together of structural units with one or more dangling Si bond, somewhat akin to the Si/SiO2 core mantle nanograins that Li & Drain (2002) suggested could exist as ERE carriers, either as >50 Å clusters or as attachments to larger grains. The weak PL activity above ∼600°C however would presumably require their ‘reabsorption’ back in to the silicate structure at higher annealing temperatures, which is plausible as the Si–Si bond dissociation energy is approximately half that of the Si–O bond. Indicated in Fig. 6 are the locations where the first three strongest peaks of crystalline cubic Si (shown by arrows at 15| $_{.}^{\circ}$|1, 24| $_{.}^{\circ}$|5 and 29| $_{.}^{\circ}$|4 2θ) should appear in the conventional powder diffraction pattern for the sample annealed at 450°C. For 2 nm Si particles the expected diffraction peak width will be at least 2° in 2θ, calculated via the well-known Scherrer equation B(2θ) = 0.94λ/Dcos (θ), which relates crystallite size D to the width B of a reflection of scattering angle θ. For much larger particles, any such peaks should become correspondingly narrower, however, 2 nm represents a significant proportion of the CSD derived from the TS measurements and the formation of SNPS in any significant number should have an observable effect on the morphology of the conventional powder pattern. No such features are apparent in Fig. 6, suggesting SNPs do not, or cannot, form by the thermal annealing of amorphous silicate.
Impurity doping
Because of its potential technological importance (e.g. lasers Petričević et al. 1988), PL in doped crystalline forsterite (Mg2SiO4) and enstatite (MgSiO3) has received much interest. Of relevance to the present discussion are Mn impurities since these produce luminescence lines at 630 and 670 nm in forsterite and enstatite, respectively (references in MacRae & Wilson 2008), and submicron Mn-rich forsterite and enstatite crystals have been found in chondritic, porous IDPs, the matrices of chondrite meteorites (Klöck et al. 1989; Vollmer et al. 2009) and in olivine in comet 81P/Wild 2 nucleus samples (Zolensky et al. 2006), though olivine with low Fe and elevated Mn is thought to have formed from condensation in the protosolar nebula (Klöck et al. 1989). The use of high purity reagent grade starting materials (MgCl2 >99 per cent, Fisher Scientific and NaSiO3, Fluorochem) in the sol–gel procedure, although used as supplied, should rule out impurities as the source of PL. Unless annealing provides specific, but thermally temporary, structural sites for PL to be produced by impurities, any such species would be present in all samples over the temperatures studied, as should their PL. Furthermore, X-ray fluorescence spectra (Horiba XGT-7000 X-ray Fluorescence Microscope) collected from different regions of a portion of the as-prepared sample showed no lines in the region of 6 keV characteristic of Mn Kα fluorescence. The observation by Koike et al. (2002a,b, 2006) that luminescence can be induced in forsterite that has been structurally disrupted by gamma rays likely points to an intrinsic structure related mechanism.
Network deformation
Shinno, Nakamura & Sekine (2000) observed luminescence in crystalline forsterite subjected to shock pressures in the range of 10–82 GPa. Correlating shifts in the Mg–O translational and Si–O rotational Raman bands at 308 and 328 cm−1 with the growth of luminescence intensity as a function of pressure, they attributed the luminescent mechanism to lattice deformation, which allows transitions to occur between deformed electron levels and vibrational sublevels in the [SiO4]4 − molecular orbital (Shinno, Nakamura & Sekine 1999). In TPT shifts to higher frequency in the position of the 670 cm−1 Raman band, attributable to a narrowing of the Si–O–Si intertetrahedral bond angle, |$\phi _{\text{T-T}}$|, and a stretching of the Si–O bond length, |$r_{\text{Si-O}}$| (also deduced by TPT from X-ray scattering), indicate that the silicate structure becomes increasingly strained with annealing temperature. Fig. 8 reproduces the TPT Raman data. Clearly visible is a general trend towards higher frequency, but with anomalously large shifts in the region of 450°C. The sudden decrease in frequency between 475 and 500°C represents the release of built up strain by structural re-ordering and changes in the relative abundances of SiO2, Si2O5, SiO3, Si2O7 and SiO4 species within the silicate (see TPT for detailed discussion). The peak in PL activity also coincides with the peak in strain at ∼450°C, suggesting a possible link. However, the luminescence observed by Shinno et al. peaked at ∼400 nm, with a long tail decay showing little activity by 600 nm and was the result of high pressure deformation, which seems unlikely to be replicated by the relatively low temperatures used here. Furthermore forsterite, although known to be the first crystalline phase to form in amorphous MgSiO3 (Rietmeijer, Nuth & MacKinnon 1986; Thompson & Tang 2001; Roskosz et al. 2009), contains isolated SiO4 tetrahedra while the 670 cm−1 Raman band relates to changes in the intertetrahedral bond angle |$\phi _{\text{T-T}}$| and therefore strain within linked tetrahedral structures. However, the close occurrence of the two peaks in PL activity and strain in the region of 450°C means that we cannot necessarily rule out a deformation-based contribution to the PL (see Section 4.5).
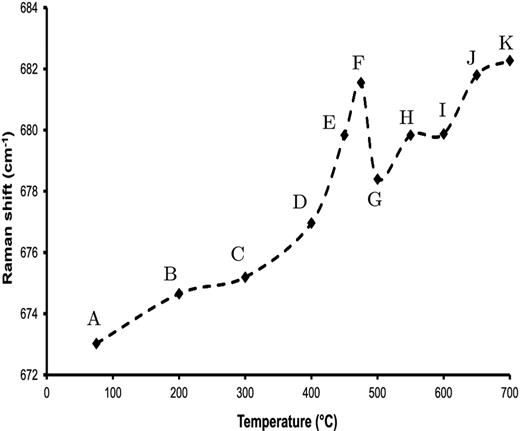
Shift in peak position of MgSiO3 670 cm−1 medium-range order Raman feature as a function of annealing temperature. Shifts towards higher frequencies are characteristic of a narrowing of the Si–O–Si bond angle and a shortening of the Si–O bond distance. The sharp decrease between 475 and 500°C is attributed to strain release. Labels as per Fig. 2.
Non-bridging oxygen hole centres (NBO-HC)
Because of its industrial and commercial importance, most studies of luminescence defect centres in undoped silicate focus on SiO2, where four intrinsic types have been identified: (i) the E ′ centre due to either a paramagnetic positively charged oxygen vacancy ≡Si·Si≡ (where ≡Si represents the bonding to three other oxygen atoms in the Si–O tetrahedron), or to a neutral dangling silicon bond ≡Si·; (ii) a dangling oxygen bond ≡Si–O· which is the NBO-HC; (iii) a peroxy radical (POR) ≡Si–O–O and (iv) oxygen deficiency centre (ODC) due either to a neutral oxygen vacancy ≡Si–Si≡ or twofold coordinated silicon atom ≡Si–O–Si–O–Si≡. Of these only the POR and NBO-HC defects produce PL in the region of 2 eV (Skuja 1998).
POR defects can be formed by the combination of ≡Si· E ′ centres with interstitial O2 molecules (Edwards & Beall-Fowler 1982). Re-examination of the TPT Raman data collected at each annealing step show no Raman feature in the region of 1549 cm−1, that would be characteristic of interstitial O2 (Skuja et al. 1998). The rise in PL with annealing is therefore unlikely to be due to POR defects.
Deconvolution of the mid-IR 10-μm band by TPT showed the strain release peak at ∼450°C to coincide with a significant change in the relative proportions of the various tetrahedral species within the silicate, while changes in the silicate's IR hydration band near 3 μm suggested this was likely driven or facilitated by dehydrogenation of the sample. Consequently, the PL may be related to the formation of defects in the silicate structure resulting from this process.
In reaction (4) the ≡Si–O− anion, once excited, acts as an energy donor, transferring its excess energy to the NBO-HC energy acceptor defect that has been formed together with the ≡Si–O−. The NBO-HC is them pumped to the excited state, returning to the ground state by luminescence. Reaction (5) on the other hand requires the existence, or formation, of closely located ≡Si–O–H pairs from which a hydrogen atom is released to leave a hydrogen bonded NBO-HC. The two peaks in the PL spectrum at 595 and 624 nm (2.08 and 1.98 eV, respectively) of our samples are very close to the SiO2 NBO-HC PL peak energies and therefore suggest a similar NBO-HC origin. To support this, Fig. 9 compares PL spectra measured for samples of commercially sourced silica (amorphous SiO2), mineral enstatite and two mineral olivines. All three exhibit clear PL features, albeit with weak activity, close to 590 and 630 nm and similar to those observed in the spectra of the annealed amorphous silicate.

PL measured for silica, mineral enstatite and two olivine mineral samples.
Fig. 10 plots the percentage of NBO atoms in the silicate for each annealing temperature. These are derived from the relative proportions of the SiO3, Si2O7, Si2O5 and SiO4 obtained by TPT by decomposition of the 10 μm band. There is a ∼10 per cent increase in the NBO content between 200 and 475°C which, taken in combination with the reduction in the CSD size, implies a breaking of intertetrahedral connections. Since the core structure of the CSD remains unchanged this can be viewed either as a ‘surface’ fragmentation of the structured domains, or as a growth and penetration of the random interdomain network into the ordered domains. We suggest therefore that during this process NBO-HC defects, associated with newly formed NBO sites around the domain surface, give rise to the observed PL.
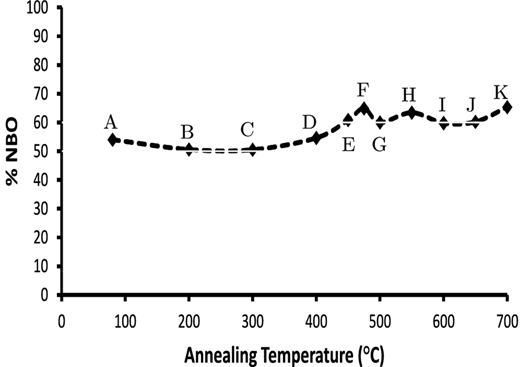
Percentage of non-bridging oxygen atoms in the MgSiO3 silicate at each annealing temperature. Labels as per Fig. 2.
Astrophysical relevance
Because of their formation in H-rich environments, bonded hydrogen defects such as SiH and SiOH have long been believed to be present in cosmic silicates (e.g. Moore, Tanabe & Nuth 1991; Timmermann & Larson 1993; Whittet et al. 1997; Malfait et al. 1999; Thompson et al. 2003) though the close proximity of O–H features from water ice have hindered observational identifications. Hydroxylated amorphous silicates on the other hand have been indentified in interplanetary dust particles (IDPs) and glasses with embedded metal and sulphides (GEMS; Thomas et al. 1993; Bradley 1994; Bradley et al. 2005) some of which may be pre-solar (Messenger et al. 2003) and originate from the ISM (Bradley et al. 1999). The presence of OH groups in these recovered amorphous silicates is thought to result from hydrogen implantation by irradiation processes (Bradley 1994); while laboratory work by Djouadi et al. (2011) shows stable OH defects in ISM silicates should result from low-energy proton irradiation in shock waves.
In a crystalline silicate the total number of hydroxylated sites is small due to the limited surface area of the crystal edge regions where OH can form, thus limiting the number of potential NBO-HC sites and hence yield only the low levels of PL activity observed in mineral species. In amorphous silicates however the inherent disorder, possibly further supplemented by the disruptive effects of ion implantation (Demyk et al. 2001, 2004; Brucato et al. 2003; Jäger et al. 2003; Bringa, Kucheyev & Loeffler 2007; Davoisine, Leroux & Frère 2008) should provide for greater numbers of OH edge defects capable of producing NBO-HC's when annealed and, hence, an increase in PL activity. The level of PL produced by silicate grains in a potential ERE environment will thus depend on whether the grains have experienced (a) sufficient hydrogenation to produce bonded OH and (b) sufficient thermal processing at some point to convert these to NBO-HC's (and would not necessarily have to have occurred in situ within the ERE emitting environment). Observationally, silicate PL should thus correlate with weakened, or absent, silicate OH features in the mid-IR.
The change in the relative distribution of tetrahedral species observed by TPT and the domain structure reported here raises the possibility that NBO-HC defects could form in different regions of the silicate structure rich in one or other of the Si–O species. Indeed the large error bars in the integrated PL intensity, particularly for the 450°C sample, arise from the increased variation in the measured PL signal obtained for different spots on the powder sample; and likely indicates phase inhomogeneity caused, or exacerbated, by annealing. These slightly different structural environments could offer a means of tuning both the PL band width and its peak wavelength in different environments. In Fig. 11 we show the results of a Gaussian decomposition of the PL bands measured for the samples annealed at 200 and 475°C (label F in Figs 2 and 3). Four components were necessary to reproduce the measured signal and were located at 554.07, 587.54, 621.03 and 659.99 nm (2.24, 2.11, 1.99 and 1.88 eV, respectively). A similar fit to the 200°C band gave component positions of 559.52, 593.27, 632.70 and 641.87 nm (2.22, 2.09, 1.96 and 1.93 eV, respectively) which, with reference to Fig. 8, represent points of high and low strain. In both cases the energies are sufficiently close to the energies of reactions (4) and (5) to suggest that four distinct NBO-HC environments may be contributing to the PL. That the relative numbers of these can vary is also apparent in Fig 9, where the weak shoulder at ∼554 nm visible in the annealed samples in Fig. 1 is more pronounced in the mineral enstatite spectrum compared to either the olivine or silica spectra. On the other hand, the weaker ∼659 nm feature in both the annealed samples and the enstatite and silica spectra is more prominent in one of the olivine spectra. As is the case with embedded SNPs these small variations in energy may be related to strain in the surrounding silicate network in which the two generic NBO-HCs are embedded, which could affect the local symmetry to possibly produce four distinct sites, or contribute directly to their formation (Hibino & Hanafusa 1988).
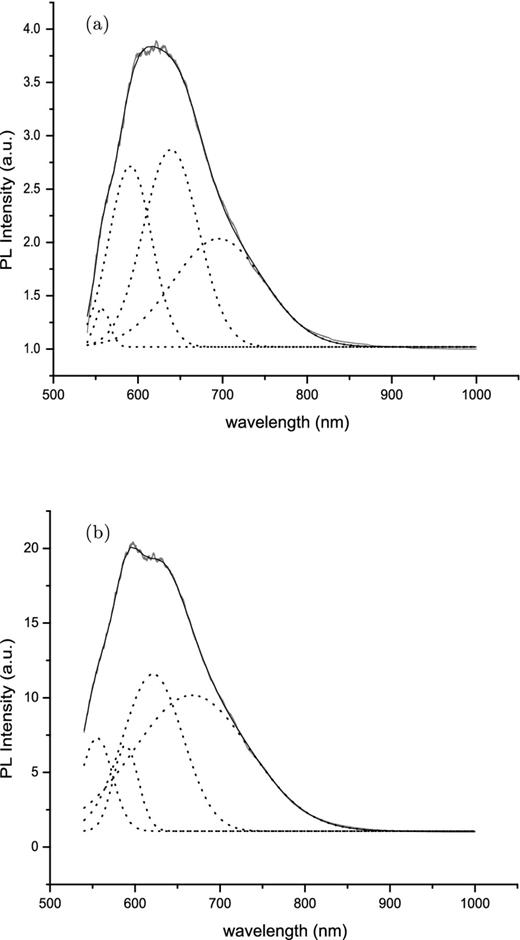
Gaussian decomposition for the PL spectra for amorphous MgSiO3 (a) annealed at 200°C and (b) annealed at 475°C. Component peaks for (a) are located at 557.64, 590.91, 639.00 and 695.42 nm (2.223, 2.098, 1.940 and 1.783 eV, respectively) and for (b) are located at 554.07, 587.54, 621.03 and 659.99 nm (2.238, 2.110, 1.996 and 1.879 eV, respectively).
From the foregoing, the narrow temperature range over which the PL activity peaks appears to be clearly related to the thermally driven evolution of an initially hydrated amorphous structure, with initial changes in the number of NBOs allowing PL active NBO-HCs to form. As these structural changes continue towards crystallization, the PL activity decreases as the NBO-HC defects become ‘reabsorbed’ back into the silicate structure. Therefore, increased PL activity is a characteristic of amorphous grain processing prior to crystallization. As such, ERE due to silicate PL should be anticorrelated with IR features due to crystalline grains. The range in temperature reported here over which PL is observed however could be widened if the PL-reducing effects of thermal annealing are offset by structural disruption and rehydrogenation due to ongoing ion implantation.
Comparing Figs 1 and 2 suggests that the silicate PL, peaking at ∼650 nm, better matches the ERE from the Red Rectangle protoplanetary nebula (Fig. 1a) rather than the ERE from the two reflection nebulae (Figs 1c and d), where the peak wavelength is shifted longward to ∼700 nm, though the low-resolution spectrum for the NGC 7027 planetary nebula (Fig 1b) is suggestive of a component close to 650 nm. One possibility for the peak position variability observed from source to source is that ERE does not originate from a single specific carrier, but rather a set of different carriers whose specific PL producing properties (e.g. relative abundance, size distribution, etc.) are determined by local conditions (Witt, personal communication). In this respect, silicate PL at ∼650 nm may represent one component of a wider ERE producing grain population and may contribute to a lesser or greater extent in different sources.
Finally, silicate PL via NBO-HC's should not produce excess contributions to the mid-IR 10 and 20 μm bands as, unlike O-SNPs, an additional vibrating Si–O species is not invoked. It may be possible, however, that luminescence from silicates could be observable at other wavelengths. Koike et al. (2006) observed blueshifted thermoluminescence in samples of forsterite and fused quartz that had been neutron irradiated. Although the luminescence mechanism was not identified, peak emission occurred between 340–500 and 420–520 nm, respectively, both of which are close, for example, to the interstellar VBS observed between 478 and 577 nm. We may therefore speculate that the formation of stable defects in silicate grains, akin to those outlined in Section 4.4, might also give rise to other observable emissions outside of the ERE region.
CONCLUSIONS
We have observed the rise and decline of PL activity in thermally processed amorphous MgSiO3 and identify this with the formation and reabsorption of non-bridging oxygen hole centres which form when intertetrahedral connections are broken and reformed as a result of structural rearrangement and dehydroxylation. Decomposition of the PL band suggest ∼4 distinct defects are contributing to the observed PL signal, which we interpret as being due to hole centres associated with regions of differing tetrahedral connectivity, while differences in their PL energies may be related to distortions of the hole centre environment by strain within the silicate network. X-ray scattering shows ordered nanocrystalline domains to be present within the silicate, whose size is reduced with annealing, suggesting that the non-bridging oxygen hole centres most likely form around the shrinking surface of the nanocrystal domains as it becomes incorporated into the random network structure that links between the domains. As crystallization proceeds, the hole centres become reabsorbed into the structure and PL activity decreases. The formation of non-bridging oxygen hole centres requires the presence of hydrogen atoms in the form of bonded OH molecules and can be achieved either by formation in H-rich environments and/or by implantation. If astronomical red PL, i.e. ERE, originates (or at least in part) from silicates, then its presence will be indicative of hydrated grains having, at some point in their history, undergone low-level thermal processing; while its absence may indicate anhydrous grains and/or grains that have undergone extensively thermal processing. Differences in the PL emission characteristics may derive naturally from differences in structural state, compositional variation or differing H implantation conditions.
This work was supported by Diamond Light Source through beamtime award 7124. SJD acknowledges financial support from Diamond Light Source and Keele University. The authors would also like to extend their thanks to Professor A. N. Witt for providing the ERE data for NGC 7023 and additional discussions regarding ERE; and to Professor L. d'Hendecourt for his helpful comments and suggestions during review.
A list of uncommon acronyms is given in Appendix A.
REFERENCES
APPENDIX A
Quantities and definitions.
| CSD | coherent size domain |
|---|---|
| ERE | extended red emission |
| E′ | colour centre due to missing oxygen atom |
| GEMS | glasses with embedded metal and sulphides |
| G(r) | atomic pair distribution function (PDF) |
| NBO | non-bridging oxygen (atom) |
| NBO-HC | non-bridging oxygen hole centre |
| ODC | oxygen deficiency centre |
| O-SNP | oxygen passivated silicon nanoparticle |
| (atomic) pair distribution function (G(r)) | |
| |$\phi _{\text{T-T}}$| | intertetrahedral bond angle |
| PL | photoluminescence |
| POR | peroxy radical |
| |$\boldsymbol {Q}$| | X-ray scattering vector |
| |$r_{\text{Si-O}}$| | silicon to oxygen bond length |
| S(Q) | normalized scattered intensity |
| SNP | silicon nanoparticle |
| TPT | Thompson, Parker & Tang (2012) |
| TS | total (X-ray) scattering |
| VBS | very broad-band structure |
| XANES | X-ray absorption near edge structure |
