


Abstract
Fermi Gamma-ray Space Telescope observations of GRB 110721A have revealed two emission components from the relativistic jet: emission from the photosphere, peaking at ∼100 keV, and a non-thermal component, which peaks at ∼1000 keV. We use the photospheric component to calculate the properties of the relativistic outflow. We find a strong evolution in the flow properties: the Lorentz factor decreases with time during the bursts from Γ ∼ 1000 to ∼150 (assuming a redshift z = 2; the values are only weakly dependent on unknown efficiency parameters). Such a decrease is contrary to the expectations from the internal shocks and the isolated magnetar birth models. Moreover, the position of the flow nozzle measured from the central engine, r0, increases by more than two orders of magnitude. Assuming a moderately magnetized outflow we estimate that r0 varies from 106 to ∼109 cm during the burst. We suggest that the maximal value reflects the size of the progenitor core. Finally, we show that these jet properties naturally explain the observed broken power-law decay of the temperature which has been reported as a characteristic for gamma-ray burst pulses.
1 INTRODUCTION
GRB 110721A is one of the brightest bursts observed by the Fermi Gamma-ray Space Telescope and had a fluence of 876 ± 28 × 10−7 erg cm2 in the energy range 10 keV–10 GeV (Fermi-LAT Collaboration 2013). The prompt emission spectrum exhibits significant deviations from a single Band spectrum. The time-resolved spectrum is characterized by two spectral peaks (Fig. 1): one can be modelled by a blackbody while the second one is given by a Band function, whose spectral peak is at higher photon energies (Axelsson et al. 2012). The time-scale of the flux variations is much longer than the time-scale required to perform time-resolved spectral analysis. This suggests that any spectral variation can be followed with sufficient temporal detail. GRB 110721A is therefore the archetype burst to study the characteristics of the blackbody component and its behaviour. We note that a similar deviation from the Band function was also found in the highly fluent Fermi burst, GRB 100724B (Guiriec et al. (2011); 10 keV–10 GeV fluence of 4665 ± 78 × 10−7 erg cm2 (Fermi-LAT Collaboration 2013). GRB 100724B, however, has a much more complex light curve and has flux variations on short time-scales. This prevents the possibility to temporally resolve pulse structures, and spectral averaging is required. Double-peaked spectra, which are similar to these two bursts, are now being frequently observed and more examples are given for long bursts in e.g. Burgess et al. (2011) and McGlynn & Fermi GBM Collaboration (2012), and for short bursts in Guiriec et al. (2012).
The blackbody component in GRB 110721A can be interpreted as the emission from the jet photosphere, from which the optical depth to Thomson scattering equals unity. A robust prediction of the fireball model for gamma-ray bursts (GRBs; Cavallo & Rees 1978; Rees & Mészáros 1994) is that the relativistic jet is initially opaque and therefore photospheric emission is inevitable. The question is only how strong it is and if it is detectable. In 1986, both Paczyński (1986) and Goodman (1986) suggested a strong contribution of photospheric emission in GRB spectra. But these models were not appealing since the observed spectra appeared purely non-thermal. However, later it was envisaged that the photospheric component can also be accompanied by non-thermal, optically thin emission (Mészáros et al. 2002). Thus, the Band component in bursts like GRB 110721A is typically interpreted as being produced by a non-thermal radiation process taking place in a separate zone in the flow, typically at large distances from the photosphere (Mészáros et al. 2002; however, see Section 5).
An important consequence of having identified the photosphere in the burst spectrum is that the properties of the flow at the photosphere can be determined (Pe’er et al. 2007; Ryde et al. 2010; Guiriec et al. 2011, 2012; Hascoët, Daigne & Mochkovitch 2013). As the properties of the flow, e.g. the burst luminosity and baryon loading, vary during the burst the observed properties of the photosphere will also vary. For instance, a varying Lorentz factor, Γ, was observed in GRB 090902B, for which the value of Γ initially doubled before decreasing (Ryde et al. 2010). Indeed, many models of GRBs, such as the internal shock model (Hascoët et al. 2013), and the magnetar model (Metzger 2010) predict time varying Lorentz factors.
Likewise, the distance from the central engine to the nozzle of the jet, r0, can vary (see e.g. Ryde et al. 2010 for GRB 090902B). The radius r0 represents the position from where the thermalized fireball starts expanding adiabatically such that the Lorentz factor of the outflow increases linearly with radius, Γ(r) ∝ r. Generally, r0 is assumed to have a value between the last stable orbit around the black hole (e.g. ∼106 cm for a 10 M⊙; Rees & Mészáros 1994) and the size of the core of the Wolf–Rayet progenitor star of typically 109–10 cm (Thompson, Mészáros & Rees 2007). Large values of r0 are suggested to be a consequence of shear turbulence and oblique shocks from the core environment that prevent an adiabatic expansion and acceleration. This in turn also suggests that it is possible that r0 can vary with time during a burst depending on the nature of the energy dissipation during the passage of the jet through the star.
In this paper, the temporal study of the flow parameters of GRB 110721A shows that they vary significantly over the burst duration. We discuss the basic observational properties in Section 2 and present the model used in Section 3. The calculated properties are presented and discussed in Section 4. Finally, we comment on the non-thermal, Band, component in Section 5. Discussion and conclusions are given in Sections 6 and 7, respectively.
2 BASIC CONSIDERATIONS OF THE GAMMA-RAY OBSERVATIONS
The Fermi Gamma-ray Space Telescope observations of GRB 110721A are presented in Axelsson et al. (2012) and in GCN12187 and GCN12188 (Tierney & von Kienlin 2011; Vasileiou et al. 2011). The Band component had an initial peak energy of record breaking 15 ± 2 MeV, and decayed later as a power law. In contrast to this behaviour the temperature of the blackbody component decayed as a broken power law (fig. 3 in Axelsson et al. 2012 and Fig. 2 below).
Furthermore, Axelsson et al. (2012) showed that the light curve which includes photons above ∼100 keV are consistent with a single pulse. However, if one includes photons with energies below ∼100 keV the light curve has two clear pulses. This shows that the second pulse in the light curve is dominated by a narrow distribution of soft photons, which has a different temporal behaviour compared to the high-energy photons. Such a narrow distribution of low-energy photons can be interpreted as a separate component in addition to the Band function, in the form of a blackbody. Fig. 1 shows a time-resolved power spectrum (νFν)1 of the time bin 2.2–2.7 s after the Gamma-ray Bursts Monitor (GBM) trigger. The spectrum is modelled by a Band function and a blackbody, the latter giving rise to a shoulder at a few 100 keV. The probability for the blackbody component to be required in addition to the Band function reaches ≳ 5σ confidence level.
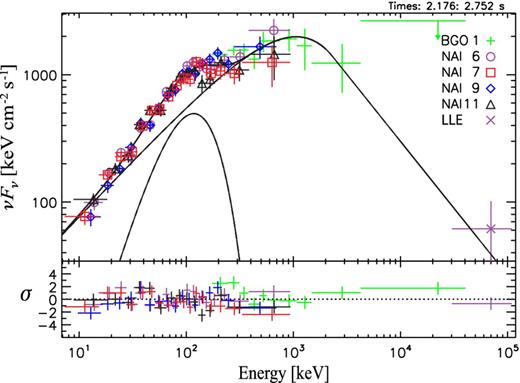
Time-resolved spectrum for the time bin 2.2–2.7 s after the GBM trigger. The spectrum is best modelled using a blackbody (kT ∼ 100 keV) and the Band function (Ep ∼ 1 MeV).
In the present study, we have performed a spectral analysis of the burst using the same data sets and data selections as presented in section 2 in Axelsson et al. (2012). We used the Fermi GBM data and from the Large Area Telescope (LAT) we used the low-energy events (LLE) and P7V6 transient class (Atwood et al. 2009) events. For the spectral analysis we used both RMfit 4.0 package2 and xspec package (Arnaud 2010), to ensure consistency of the results across various fitting tools. For the time-resolved analysis, we allow for a finer time binning compared to Axelsson et al. (2012), since time resolution is essential for the study of the evolution of the spectral parameters. All the results are, however, checked against the coarser time binning, which provides the advantage that the spectral components are detected with a larger statistical significance.
The redshift, z, of the burst is not known. A possible optical counterpart was identified by the Gamma-Ray Burst Optical/Near-Infrared Detector (GROND) team (GCN12192; Greiner et al. 2011). An X-ray afterglow follow-up observation was performed by Swift-X-Ray Telescope (XRT) without a positive identification (GCN12212; Grupe et al. 2011). Spectroscopy of the counterpart suggested two possible redshifts, z = 0.382 and 3.512 (GCN12193; Berger 2011). However, the Interplanetary Network (IPN) triangulation (GCN12195; Hurley et al. 2011) and the Swift [Ultraviolet/Optical Telescope (UVOT) GCN12194; Holland & Swenson 2011 observations could not confirm this association.
2.1 Flux ratio: adiabatic loss
The observed ratio of FBB/F is shown in the left-hand panel in Fig. 2.3 The thermal flux initially is about 1 per cent of the total flux and it peaks to about 10 per cent. The best fit to a broken power-law model gives the power-law indices 2.0 ± 0.4 and −2.0 ± 0.3 before and after the break, which occurs at t = 2.3 ± 0.1 s. The adiabatic parameter does indeed vary significantly. We also note that since (FBB/F)−3/2 is larger than unity in GRB 110721A, the photospheric radius rph lies above rs.
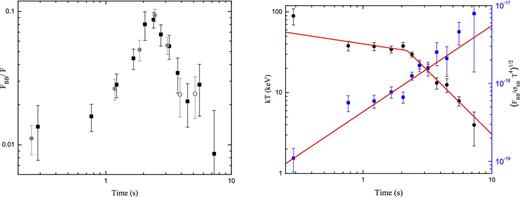
Left-hand panel: fraction of thermal flux to total flux, FBB/F. The ratio initially increases from approximately 1 to 10 per cent and then decreases. The grey points correspond to the time resolution used in Axelsson et al. (2012). The solid (open) circles correspond to a significance of the thermal component of ≳ 5σ (3σ). Right-hand panel: blackbody component: its normalization, |${\cal {R}}$| (squares/blue), and its temperature (circles/black). While the temperature decays as a broken power law, the |${\cal {R}}$| parameter increases as a single power law, without any obvious breaks.
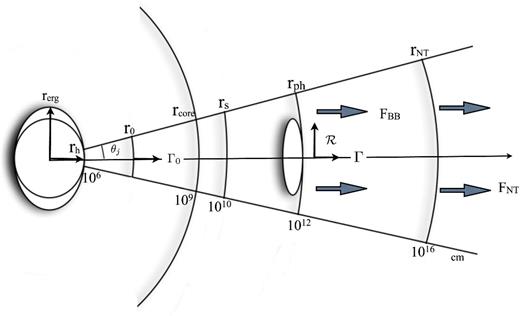
Schematic figure illustrating the distances referred to in the text.
We note that the peak in the adiabatic parameter is coincident with the break in temperature (t = 2.3 ± 0.2 s; right-hand panel in Fig. 2). Moreover, the peak in the adiabatic parameter also coincides with the second peak in the Na i count light curve, but is different from the peak in the pulse which occurs at 0.4 s relative to the GBM trigger, see fig. 1 in Axelsson et al. (2012). It is thus apparent that the behaviour of the thermal emission component is partly due to the variation in adiabatic losses.
Ryde & Pe’er (2009) found recurring trends for the blackbody component observed in 49 smooth pulses using the Compton Gamma-ray Observatory (CGRO) Burst and Transient Spectrometer Experiment (BATSE) instrument. Among other results they found that the parameter ϵad in most cases only varied moderately, however, both increasing and decreasing trends were observed.4 The significant change in ϵad observed for GRB 110721A suggests that its behaviour is particular.
3 PROPERTIES OF THE OUTFLOW AT THE PHOTOSPHERE
We imagine that the flow is advected through the photosphere. As the properties of the flow vary the observed properties of the photosphere will also vary. The properties will depend on the initial conditions at the central engine, e.g. burst luminosity, L0(t), dimensionless entropy, |$\eta (t) \equiv {L_0}/{\dot{M}c^2}$|, and nozzle radius, r0(t). Here |$\dot{M}$| is the baryon loading. Furthermore, we assume the dynamics to be dominantly adiabatic, following the classical fireball evolution.
The shortest variability time in the light curve is expected to be the dynamical time. This is the time for a section of the flow to reach the distance rph at which it emits the observed radiation. This is given in the lab frame by rph/c, which corresponds to an observer frame time tobs = rph/(2cΓ2) ∼ 0.2 ms, for typical values of rph = 1012 cm and Γ = 300. In GRB 110721A the observed variation time-scale is much longer than the dynamical time indicating that the central engine varies on a longer time-scale. In addition, the time bins used in the spectral analysis are around 0.1 s, which also are shorter than the variations in the light curve. We therefore conclude that, for each time bin used in the analysis, we can assume the flow to be quasi-static. This simplifies the calculations of the outflow parameters (see Fig. 3).
3.1 Calculations of the outflow parameters
In the right-hand panel in Fig. 2 the observed normalization of the blackbody is plotted on top of the temperature evolution. The figure shows that normalization varies independently of temperature and increases monotonically with time as |${\cal {R}} \propto t^\rho$|, with ρ = 1.14 ± 0.15. Both the broken power law of the temperature decay and the increase in |${\cal {R}}$| are similar to the results found for CGRO BATSE bursts in Ryde (2004, 2005). The rise in |${\cal {R}}$|, given by the power-law index ρ, was found in Ryde & Pe’er (2009) to have a very large spread, centred around an averaged value of 0.51 and having a standard deviation of 0.25. The value found for GRB 110721A is thus among the steepest rises observed.
Equations (4) and (5) thus show that |${\cal {R}} \propto Y \, F/\Gamma ^4$| and Γ is thereby fully determined by the observables F, |${\cal {R}}$|, Y and redshift z: |$\Gamma \propto \left( {F }/{{\cal {R}}}\right)^{1/4} {Y}^{1/4}$|. An estimate of rph now follows giving |$r_{\rm ph} \propto {F^{1/4}} \, { {\cal {R}}^{3/4}} \, {Y}^{1/4}$|.
These estimations are robust and depend only on the assumptions (i) that the flow is baryonic dominated (rph is the baryon photosphere), (ii) rph > rs, (iii) that the observed part of the flow is approximately spherical, (iv) that the emission is dominated by line-of-sight emission and (v) that the outflow is thermally and adiabatically accelerated beyond r0 (there is no internal energy dissipation; classical fireball model).
4 PROPERTIES OF THE FLOW IN GRB 110721A
For each time bin we use the blackbody temperature T and normalization |${\cal {R}}$|, and the total flux, F, to calculate the flow parameters Γ, rph and r0, as well as rs. The results are shown in Fig. 4. Since the redshift of the burst is not known, the outflow parameters are calculated for redshift z = 2, the averaged value for GRBs, and assuming a flat universe (ΩΛ = 0.73, H0 = 71). In order to show the dependency on the unknown redshift we plot, for one of the time bins, the corresponding values for redshifts z = 0.382 and 3.512, respectively. These redshifts assume the association of the optical counterparts reported.
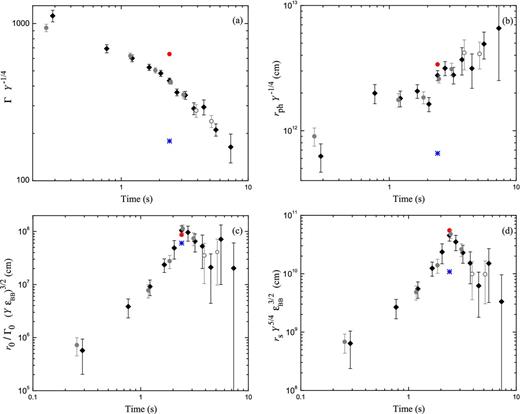
Evolution of the flow parameters in GRB 110721A for redshift z = 2 (diamonds). For comparison the parameters values for redshifts z = 0.382 (blue/star) and z = 3.512 (red/circle) are indicated for time bin around 2.5 s. (a) The Lorentz factor, Γ, decreases monotonously with time. (b) The photospheric radius, rph, has a weak increase and lies around 1012 cm. The nozzle radius, r0, initially increases and reaches a peak at about 2.5 s and then decreases weakly. (d) The evolution of the saturation radius, rs is similar to that of r0. See the text for estimation of the parameters Γ0, σ, ϵBB and Y.
4.1 Lorentz factor, Γ
The Lorentz factor is inferred to decay monotonically with time from an initial value of 1000 Y1/4 down to a few 100 Y1/4 as depicted in Fig. 4(a). A weak curvature of the decay can be noticed. A fit of a broken power law yields a break at 2.11 ± 0.24 s with power-law indices of −0.41 ± 0.04 and −0.81 ± 0.06, respectively.
The decrease of the values of Γ = Γ(t) is not surprising by realizing the fact that |${\cal {R}} \sim L_0/\Gamma ^4$| and that |${\cal {R}}$| typically is observed to increase over a pulse (Ryde & Pe’er 2009). Such a decrease must therefore be a common behaviour over individual pulse structures in GRBs.
The decreasing Lorentz factor has the following implications.
In the internal shock model, the need of high efficiency requires the Lorentz factor distribution of the shells to be such that the difference in Γ is large and that Γ increases with time.
For instance, Hascoët et al. (2013) assume an increasing Lorentz factor distribution to produce a smoothly varying pulse from internal shocks. Following the discussion in Section 3, in the case of GRB 110721A, it can be assumed that each time bin of the analysis represents a shell of the flow. In such a scenario, a decreasing Lorentz factor with time challenges the simplest prescriptions for the smooth emission pulses produced by internal shocks.
One of the robust predictions of the magnetar model of GRB central engines is that the Lorentz factor of the outflow should increase monotonically with time during a burst (e.g. Metzger 2010). However, this prediction is for an isolated magnetar birth and thus neglects effects from the overlying stellar envelope, which could affect the predictions.
In addition to this, it is also worthwhile noting that in GRB 110721A, L0 varies from 1.5 × 1054 to 3 × 1052 Y erg s−1 for a redshift of z = 2, which are both much larger than the upper limit of the total energy release in magnetar models.
For Γ ≫ 1/θj, the effective transverse size of the emitter is given by the equation (4). However, for Γ ≪ 1/θj, |${\cal {R}}$| scales as θjrph.
For bursts which have a decreasing Γ, the limit Γ = 1/θj can thus be reached. This would cause a break in the temporal increase of |$\cal {{R}}$|.
Ryde & Pe’er (2009) found that for some GRB pulses the parameter |${\cal {R}}$| indeed exhibited such a late-time break. The break should then be interpreted as the point when Γ = 1/θj. We note that in GRB 110721A no break is detected and thereby concludes that the jet opening angle θj > (1/200) Y−1/4.
One can speculate whether a decreasing Lorentz factor is due to the outflow developing an increasing baryon pollution as the accretion disc stabilizes thereby produces a stronger neutrino-driven wind which can interact with the jet to pollute it with baryons.
4.2 Radius of the photosphere, rph
The photospheric radius, rph, shows an increase with time, which is moderate compared to the scale of variation in the other parameters, Γ, r0 and rs; see Fig. 4(b). The size of the photospheric radius is of the order of 1012 Y1/4 cm (for redshift z = 2). Fitting a power law to the data yields rph ∝ t0.58 ± 0.06. The moderate variation and the size scale is similar to the results found by Ryde et al. (2010) and Guiriec et al. (2012).
4.3 Nozzle radius r0
Fig. 4(c) shows that r0 increases by two orders of magnitude during the first 2 s. The best fit of a broken power law gives the power-law indices 3.0 ± 1.8 and −1.0 ± 0.9, before and after the break, which is at t = 2.6 ± 0.7. We note that after the break the evolution is consistent with r0 being constant. The maximal value is |${\sim } 10^8\, \mathrm{cm} \,\, \Gamma _0 \, ({\rm \epsilon _{\rm BB}} \, Y)^{-3/2}$|. We also note that the time of this break coincides with the break detected in ϵad(t) ∝ FBB/F and in kT(t).
Applying the trends found by Ryde & Pe’er (2009) for |${\cal {R}}$| (increasing) and FBB/F (moderate variations) to equation (7), and further assuming that ϵBB Y only varies moderately over the pulse, implies that r0 should in general increase in bursts. This fact suggests that an increase in r0 is a general type of behaviour for pulses in GRBs.
4.4 Efficiency parameters, Γ0, and magnetization
The derived values of the flow parameters are dependent on the unknown quantities Y, ϵBB, Γ0 and potential magnetization, σ, of the flow. Below we discuss their estimation.
4.4.1 Parameter Y
The value of the parameter Y can be estimated from the observations of the total relativistic energy in jets made by e.g. Cenko et al. (2010) and Nemmen et al. (2012). Their measurements correspond to that the most energetic GRBs have 1 < Y < 2, with a trend that more energetic the burst is the closer Y is to unity.
Such a value means that the efficiency of converting the kinetic energy of the flow into the observed non-thermal component in the spectrum must be high. This is likely to be the case for GRB 110721A since it is very energetic.
4.4.2 Parameter Γ0
Thompson et al. (2007) suggested that oblique shocks can cause dissipation which counter-acts the acceleration until r0, which lead to typical value of |$\Gamma _0 \sim (2 \, \sqrt{3} \, \theta _{\rm j})^{-1}$|, where θj is the jet opening angle (see further e.g. Lazzati, Morsony & Begelman 2011; Mizuta, Nagataki & Aoi 2011; Lazzati et al. 2013). GRB 110721A is a very luminous burst; the observed fluence corresponds to a Eiso = 2.6 × 1054 erg. Therefore, the opening angle can be assumed to be small (Cenko et al. 2011; Ghirlanda et al. 2013) and thus typically Γ0 ∼ 4 (θj/4°)−1.
4.4.3 Initial value of r0 and the black hole mass
The value of r0 in the first time bin, where a blackbody component is detected, is determined to be approximately 6 × 105 cm. By assuming a Kerr black hole at the centre, the smallest value that r0 can attain is found by associating it to the radius of the ergosphere, rerg, at the poles of the black hole (see further discussion in Appendix A). Along the polar axis, for any degree of rotation, the ergosphere always coincides with the event horizon of the black hole, giving r0 = χGMbh/c2 with χ lying between χ = 1 for a maximally rotating black hole and χ = 2 for a non-rotating black hole. Associating the determined value of r0 with the radius of the ergosphere at the pole thus provides an estimate of the mass of the black hole in GRB 110721A to 2 M⊙ < Mbh < 4 M⊙, with the upper limit for a maximally rotating black hole.
These values are under the reasonable assumption that Γ0 (ϵBB Y)−3/2 = 1 for the initial time bin. The value of r0 ∼ 6 × 10⁵ is thus consistent with a jet that is launched at the ergosphere of a small black hole and that has a highly efficient initial thermalization (ϵBB) and dissipation of the kinetic energy (Y = 1), and finally assuming Γ0 to be close to unity. For typical values of 1 < Y < 2 the requirement becomes that 0.5 < ϵBB < 1.
However, the mass of the stellar mass black hole that is formed after a collapse of a massive star is generally assumed to be 5–10 M⊙ (Paczyński 1998). Furthermore, the launch site could be larger than the minimally allowed value (the launching mechanism is unknown) which would decrease the estimate of the black hole mass.
4.4.4 Magnetized outflows
The outflow energy can be imagined to be in other forms other than the fireball (baryonic) form. For instance, the energy can be transported by a Poynting flux entrained in the baryonic flow. A fraction of the non-thermal emission could then be due to dissipation of the Poynting flux component, which would be transferred into the observed non-thermal component (e.g. Zhang & Pe’er 2009; Guiriec et al. 2011). Neglecting this fact will cause us to underestimate r0 and thus the mass of the black hole.
Another possibility is that the flow could have an even larger magnetization, thereby causing the observed blackbody to be emitted during the acceleration phase rph < rs. In that case we cannot estimate the Lorentz factor nor rph (Pe’er et al. 2007). However, |$r_0 \cong d_{L}/(1+z)^2 \, {\cal {R}} \sim {\rm few} \times 10^{12}$| cm, which is too large. This is also the case if we have efficient magnetic acceleration, which again will cause the photosphere to be below the saturation radius. We note that the acceleration of the flow caused by the magnetic fields will only give rise to weak dependences on the derived flow parameters r0, Γ and rph (see e.g. Guiriec et al. 2012; Hascoët et al. 2013).
We, therefore, conclude that under the above assumptions, the flow cannot be highly magnetized, however, a moderate magnetization is possible as long as the magnetic acceleration is inefficient, see also Veres, Zhang & Mészáros (2012).
4.4.5 Evolution of r0
Thus, if we assume that (1 + σ)/(ϵBB Y) ∼ 1.8 throughout the burst and that Γ0 ∼ 4 at the thermal peak, equation (8) yields that r0 ∼ 109 cm. We note that this is close to the radius of the core of the Wolf–Rayet progenitor star (Woosley & Weaver 1995; Thompson et al. 2007). Thus, the nozzle radius of the jet evolves from 106 cm to a peak value of 109 cm and then decreases. One can therefore speculate that this break in r0 is due to the nozzle radius reaching the surface of the core of the progenitor star and thereby does not continue to increase: beyond the core of the progenitor the heated cocoon (whose pressure collimates the jet) expands and only provides a weak sideways confinement of the jet. The efficiency and strength of the oblique shocks therefore decreases (Mizuta & Ioka 2013).
5 ORIGIN OF THE BAND COMPONENT
The evolution of the photon indices of the Band function, α and β, found from the fits show no dramatic variations with α ∼ −1 and β ∼ −3, throughout the burst, see Fig. 5. The unusually high peak energy value of 15 ± 1.7 MeV is measured in the first time bin (−0.32 to 0.0 s) with α = −0.81 ± 0.08 and |$\beta = -3.5^ {+ 0.4}_{-0.6}$| (Axelsson et al. 2012). Below we shortly discuss the origin of the Band component.
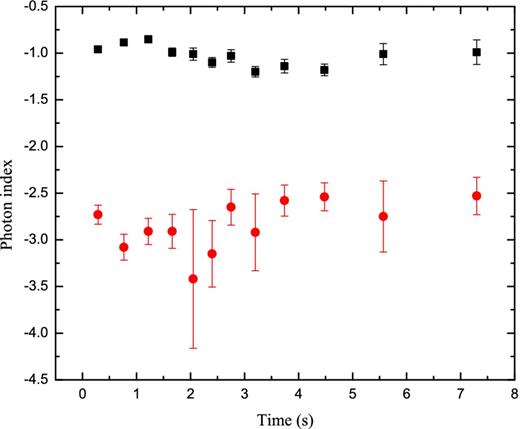
Power-law indices, α (black/squares) and β (red/circles) of the Band component of the fits. Both remain approximately constant with average values α = −1 and β = −3.1.
One alternative is that the whole spectrum (blackbody+Band) is emitted at the photosphere and the spectral shape is formed due to energy dissipation below the photosphere, at optical depth τ > 1 (Rees & Mészáros 2005). Indeed, the spectral evolution in GRB 090902B provided evidence that the emission spectrum from the photosphere does not need to be blackbody like but can be broadened into a Band-like spectrum (Ryde et al. 2011). Subphotospheric dissipation (Pe’er, Meszaros & Rees 2005; Beloborodov 2011; Ryde et al. 2011; Giannios 2012) and geometrical broadening (Goodman 1986; Lundman, Pe’er & Ryde 2013) have been suggested to give rise to a mechanism that broadens the photospheric spectrum. Several different shapes of spectra can emerge from the photosphere, mainly depending on the radial distribution of dissipation and emission mechanisms involved (e.g. Pe’er et al. 2005; Beloborodov 2011). In order to reproduce the observed spectrum in GRB 110721A a large amount of dissipation is required below the photosphere (Zhang et al. 2012).
The second alternative is that the photospheric emission is not dominant in the spectrum but only forms a shoulder to the Band function, which is interpreted as synchrotron emission. However, the observed spectrum with Ep ∼ 15 MeV has an α ∼ −0.81 that is larger than α = −1.5, which is the expected value for synchrotron emission from fast cooling electrons. Applying basic synchrotron theory to an impulsive energy injection episode, the emission radius from where synchrotron emission from slow cooled electrons can occur, is found to be |$r \le 8 \times 10^9 [(1+{\cal {Y}}) (1+z)^2]^{-1}\, \rm cm$|, where |${\cal {Y}}$| is the Compton parameter and the factor |$(1+{\cal {Y}})$| takes into account the cooling due to Compton scattering. This is obtained by assuming that electron Lorentz factor cannot be much larger than mp/me and the bulk Lorentz factor is not larger than 1000. This radius is much below the photospheric radius (rph ∼ 1012 cm for z = 2, see above). Hence, slow cooling synchrotron emission from an impulsive energy injection cannot be the origin of this record breaking high-energy peak.
On the other hand, Uhm & Zhang (2013) show that taking the effect of adiabatic expansion of the magnetic field B into consideration the expected photon index for the fast cooling regime is no longer α = −1.5, but rather a harder value, such as α ∼ −0.8. Therefore, the observed spectrum can be consistent with fast cooling synchrotron. On the other hand, Uhm & Zhang (2013) also note that the spectrum should be softer during the early phase of the pulse, while the observed value of −0.81 is from the first bin.
Moreover, continuous energy injection can also alleviate the restrictions on synchrotron emission. For instance, Zhang & Yan (2011) discussed the possibility that the Band function in the Band+blackbody fits may be produced by the internal collision-induced magnetic reconnection and turbulence (ICMART) events (see also e.g. Waxman 1995). According to the ICMART model, the Band component could be formed at radii much above the photospheric radius, at typical 1015–1016 cm. Here electrons are accelerated by a runaway release of magnetic energy due to magnetic reconnections which are initially produced by internal shocks occurring at lower radii. The electrons are thus continuously accelerated through second-order turbulences. The resulting synchrotron spectrum can therefore be consistent with the observed spectral shape (see also Burgess et al., in preparation). During an ICMART event the magnetization σ decreases rapidly. The efficiency can be high and depends on (1 + σend)−1, where σend is the magnetization after the event.
6 DISCUSSION
The temporally resolved spectra of GRB 110721A exhibit two peaks. The low-energy peak is interpreted as the thermal peak, given by the blackbody component. For GRB pulses two recurring trends of the thermal peak have been identified: first, the temperature decays as a broken power law, and second, |${\cal {R}}$| increases monotonically with time, independent of the temperature decay (Ryde 2004, 2005; Ryde & Pe’er 2009; Axelsson et al. 2012).
The increase in |${\cal {R}} \propto r_{\rm ph}/\Gamma$| is mainly a consequence of the decrease in Lorentz factor. This causes the effective emitting surface |${\sim } {\cal {R}}^2$| to increase since the relativistic aberration of the emitted light becomes weaker. The increase observed in rph for GRB 110721A also strengthens the increase of |${\cal {R}}$|. However, in most bursts the variations in rph are typically smaller than in r0 and Γ (Ryde et al. 2010; Guiriec et al. 2011).
The observed temperature is given by |$T \propto (L_0 \, \epsilon _{\rm ad})^{1/4} \, {\cal {R}}^{-1/2}$|. Since |${\cal {R}}$| is a monotonic function without any breaks, the break in temperature must be due to the break in the thermal flux (L0 ϵad). Such a break can be dominantly caused by the peak in L0, like in cases with ϵad ∼ constant (Ryde & Pe’er 2009), or by a break in ϵad, like in the case of GRB 110721A.
Furthermore, the temperature is observed to be approximately constant, or decaying weakly, before the break (Ryde 2004). This is due to the emitting surface |${\sim }{\cal {R}}^2$| increasing in parallel with the thermal flux (L0 ϵad) which causes the temperature to only vary moderately.
Equation (7) gives that |$\epsilon _{\rm ad} \propto ({\cal {R}}/r_0)^{-2/3}$|. Therefore, a consequence of |${\cal {R}}$| not having any breaks is that the breaks in r0 and in ϵad must be related to each other. Note that ϵad can maximally reach unity (when the saturation radius approaches the photosphere). Furthermore, in order to keep ϵad close to constant the flow must have |${\cal {R}} \propto r_0$|. Likewise, for a rising ϵad, r0(t) must instead evolve faster than |${\cal {R}}(t)$|. Assuming a moderate variation in rph, the former case corresponds to |$r_0 \propto {\cal {R}} \propto \Gamma ^{-1}$|. This relation suggests that a small outflow velocity (small Γ) must facilitate the formation of shear turbulence and oblique shocks which yield the larger values of r0. Similarly, a large flow velocity must prevent the formation of such shocks in order to keep r0 small. This could, for instance, be the situation in jets with a narrow opening angle, which would cause the shear turbulence and oblique shocks to more easily arise. This is consistent with the assumption that the opening angle is smaller for more luminous bursts (Ghirlanda et al. 2013), since GRB 110721A is a very luminous burst.
Finally, we note that the ϵad(t) behaviour is distinctly different from the evolutions of F and Γ, which are monotonic functions of time. Since rph ∝ F/Γ3, the photospheric radius should be largely independent of the evolution in ϵad.
6.1 Expected deviations
In the above discussions we have made some assumptions, below we list them and the possible deviations from them.
On axis emission: all the above calculations are based on the assumption that the central engine of the burst remains active throughout the burst. Thereby, we neglect any emission from the high latitudes and consider the observed emission to be along the radial direction towards the observer. However, high-latitude emission becomes significant in the scenario discussed in Pe’er (2008), see also Ruffini, Siutsou & Vereshchagin (2011).
Efficiency parameters: the temporal variations in the efficiency parameters (Y and ϵBB) are neglected. Considering the scenario where r0 remains a constant, one can study the variations possible in ϵBBY. However, we find that only for assuming Y = 1 and a varying ϵBB can reproduce the observed behaviour of T.
Adiabatic expansion: we assume that the fireball expands adiabatically from r0 such that Γ ∝ r. However, if there is continuous dissipation of the kinetic energy of the flow throughout the acceleration phase or if the flow is magnetized, then the estimation of rs becomes different depending on the mechanism of dissipation.
Pair photosphere: the calculations presented in the paper are also based on the assumption that we observe the baryonic photosphere as we neglect any subphotospheric dissipation. However, if there is considerable subphotospheric dissipation or dissipation above (but close to) the baryonic photosphere, such that a fraction of the kinetic energy dissipated resulting in pairs is greater than me/mp, then a pair photosphere would be formed. It would lie above the baryonic photosphere, rph (Rees & Mészáros 2005). Further details of such a case are studied in Iyyani et al. (in preparation).
7 CONCLUSION
Using Fermi Gamma-ray Space Telescope observations, we find that the outflow dynamics in GRB 110721A exhibit a strong but smooth evolution: the Lorentz factor, Γ, of the outflow decreases monotonically with time. In contrast, both internal shock models and the isolated magnetar model predict increasing Lorentz factors. We also find that the nozzle radius, r0, of the jet initially increases by more than two orders of magnitude and then breaks and becomes relatively constant. Assuming a moderately magnetized jet we find that r0 evolves from near to the central engine, 106 cm, to 109 cm, which we suggest is the size of the envelope of the core of the progenitor star.
The adiabatic losses that the thermal component suffers also vary though out the burst. The adiabatic loss parameter, ϵad (equation 1), reaches a maximum at ∼2.5 s which causes the peak in the thermal light curve and thereby the break in the temperature evolution. The amount of adiabatic losses is mainly related to the behaviour of the blackbody normalization (|${\cal {R}}$|) and r0; a break in the increasing behaviour of r0 is reflected by the peak of ϵad at ∼2.5 s.
We conclude that three main flow quantities describe the observed spectral behaviour of the outflow of the jet (apart from the efficiency parameter Y, ϵBB and Γ0 and σ). These are (i) the burst luminosity, L0, (ii) the dimensionless entropy of the baryonic flow, η, and (iii) the nozzle radius of the flow, r0 (whose behaviour is reflected in ϵad). The first two quantities give rise to the main pulse structure whereas the minimum in the adiabatic losses result in a photospheric pulse which in the case of GRB 110721A is the second peak observed in the photon light curve.
We thank the referee, Peter Mészáros, and Martin Rees for useful comments on the manuscript. We also thank Asaf Pe’er for useful discussions. We acknowledge support from the Swedish National Space Board. SI is supported by the Erasmus Mundus Joint Doctorate Program by Grant Number 2011-1640 from the EACEA of the European Commission.
Erasmus Mundus Joint Doctorate in Relativistic Astrophysics.
Note that the crosses in the figure are derived data points and are model dependent.
The error bars on all figures presented in the paper represent 1σ.
Note that over the CGRO BATSE energy range the ratio FBB/F was found to be a few 10 s per cent (Ryde & Pe’er 2009). This is an upper limit, since the actual value of F is larger than what was measured over the limited energy range available.
