


Abstract
We study the link between the X-ray emission in radio-quiet active galactic nuclei (AGN) and the accretion rate on the central supermassive black hole using a statistically well-defined and representative sample of 71 type 1 AGN extracted from the XMM–Newton Bright Serendipitous Survey. We search and quantify the statistical correlations between some fundamental parameters that characterize the X-ray emission, i.e. the X-ray spectral slope, Γ, and the X-ray ‘loudness’, and the accretion rate, both absolute (Ṁ) and normalized to the Eddington luminosity (Eddington ratio, λ). We parametrize the X-ray loudness using three different quantities: the bolometric correction Kbol, the two-point spectral index αOX and the disc/corona luminosity ratio. We find that the X-ray spectral index depends on the normalized accretion rate while the ‘X-ray loudness’ depends on both the normalized and the absolute accretion rate. The dependence on the Eddington ratio, in particular, is probably induced by the Γ – λ correlation. The two proxies usually adopted in the literature to quantify the X-ray loudness of an AGN, i.e. Kbol and αOX, behave differently, with Kbol being more sensitive to the Eddington ratio and αOX having a stronger dependence with the absolute accretion. The explanation of this result is likely related to the different sensitivity of the two parameters to the X-ray spectral index.
INTRODUCTION
The engine of active galactic nuclei (AGN) is powered by the accretion of matter on to the supermassive black hole (SMBH), placed in the centre of the host galaxy: the matter is heated (105–106 K) through viscous and magnetic processes and forms an accretion disc around the SMBH emitting in the ultraviolet (UV)–optical region. A fraction of energy is also emitted in the X-ray band with a spectrum that can be represented, at first order, by a power law from 0.1 to 100 keV at rest frame. In the now accepted disc–corona model (Haardt & Maraschi 1991), the X-rays are produced in a hot (T = 108–109 K) corona, reprocessing the primary UV–optical emission of the disc via inverse-Compton mechanism. X-rays are a probe of accretion since they are produced in the very inner part of the nucleus and carry direct information on the physics very close to the SMBH. For instance, the hard X-ray spectral index (Γ) gives direct information about the energy distribution of the electrons in the corona, while the intensity of the X-ray emission with respect to the UV–optical emission quantifies the relative importance between disc and corona. This latter quantity is often parametrized with the X-ray bolometric correction Kbol (e.g. Vasudevan & Fabian 2009), defined as the ratio between bolometric luminosity and 2–10 keV luminosity, or with the two-point spectral index αOX (e.g. Vignali, Brandt & Schneider 2003), defined between 2500 Å and 2 keV. The different values of X-ray spectral index and of the disc/corona luminosity ratio observed from source to source are likely a consequence of fundamental differences in the physical parameters of the central engine.
First studies, essentially based on ROSAT data, suggested correlations between the ‘soft’ spectral index Γ(0.5–2.4) keV and the full width at half-maximum (FWHM) of Hβ emission line coming from the broad line region (BLR; Wang, Brinkmann & Bergeron 1996; Laor et al. 1997; Sulentic, Marziani & Dultzin-Hacyan 2000; Grupe et al. 2004). Assuming that BLR dynamics is directly dependent on the black hole (BH) mass, this correlation was suggesting a direct link between Γ(0.5–2.4) keV and some physical parameters like the BH mass or accretion rate. In particular, it was suggested that the main physical driver of this correlation is the accretion rate normalized to the Eddington luminosity1 (Eddington ratio): sources accreting close to the Eddington limit produce the steepest values of Γ(0.5–2.4) keV (Laor et al. 1997; Sulentic et al. 2000; Grupe et al. 2004; Wang, Watarai & Mineshige 2004). However, since the measured value of Γ0.5–2.4 keV can be significantly contaminated by the presence of a spectral component called ‘soft excess’,2 it was difficult to establish on a firm ground whether it was the slope of the primary emission that correlates with the accretion rate or, instead, it was the intensity of the soft excess.
Using ASCA observations, Brandt, Mathur & Elvis (1997) and Wang et al. (2004) have found that also the ‘hard’ spectral slope (Γ(2–10) keV) has a strong dependence with the FWHM(Hβ). Since the 2–10 keV energy range is not affected by the ‘soft excess’, this result was considered as a compelling indication that the slope of the primary component of the X-ray emission actually correlates with FWHM(Hβ). First studies made with XMM–Newton, Chandra and Swift-X-Ray Telescope (XRT) have further suggested the possible presence of a second trend, i.e. an anticorrelation between Γ(2–10) keV and the BH mass MBH (Porquet et al. 2004; Piconcelli et al. 2005). The availability of hard X-ray data from XMM–Newton and Chandra and of statistical relations that allow the systematic computation of MBH on large numbers of AGN have produced in the very recent years a big leap forward on this kind of study, extending the analysis on significantly larger samples, including up to a few hundreds of sources (Kelly et al. 2008; Shemmer et al. 2008; Gu & Cao 2009; Risaliti, Young & Elvis 2009; Grupe et al. 2010; Zhou & Zhang 2010). These studies seem to confirm the presence of a correlation between the hard Γ and the Eddington ratio (Risaliti et al. 2009; Grupe et al. 2010) with some exceptions (Bianchi et al. 2009). Shemmer et al. (2008) have also demonstrated that the observed strong anticorrelation usually observed between Γ and FWHM(Hβ) is a secondary correlation induced by the dependence between Γ and the Eddington ratio.
Also the bolometric correction is expected to be related to the physical parameters that regulate the accretion mechanism. A possible dependence of the Kbol with the luminosity has been suggested (Marconi et al. 2004; Hopkins, Richards & Herquist 2007), but more recent observations seem to point out that the principal dependence is between Kbol and the Eddington ratio (Vasudevan & Fabian 2007, 2009; Kelly et al. 2008; Lusso et al. 2012). An alternative way to study the relative intensity between disc and corona is through the αOX, defined as the slope between 2500 Å and 2 keV. Past studies generally found a strong correlation between αOX and LUV (e.g. Vignali et al. 2003; Marchese et al. 2012) or Lbol (Kelly et al. 2008; Shemmer et al. 2008) while a dependence of αOX with the Eddington ratio is usually weak or absent (Young, Elvis & Risaliti 2010), contrary to what has been found for Kbol. This is quite surprising since Kbol and αOX are both supposed to be proxies of the disc/corona relative intensity and, therefore, they are somehow expected to behave in a similar way.
In this paper we investigate the link between X-ray properties and the accretion rate by analysing a well-defined sample of type 1 AGN selected from the XMM–Newton Bright Serendipitous Survey (XBS). In particular, we study the spectral index Γ estimated in the energy range 0.5–10 and 2–10 keV and three different parameters that quantify the ‘X-ray loudness’, i.e. the bolometric correction Kbol, the αOX and the disc/corona luminosity ratio (i.e. the ratio between the accretion disc luminosity and the 0.1–100 keV X-ray luminosity). The approach followed in this study is to search for statistically significant correlations between these parameters and the value of accretion rate, both absolute and normalized to Eddington luminosity.
The structure of the paper is the following. In Section 2 we describe the survey, the sample selection and the parameters used for our work. In Section 3 we describe the statistical analysis used to find the correlations between the parameters, taking into account a number of potential biases. In Section 4 we present our results. Finally, in Section 5 we report the summary and conclusions.
We assume here a flat Λ cold dark matter (ΛCDM) cosmology with H0 = 65 km s−1 Mpc−1, |$\Omega _\Lambda = 0.7$| and ΩM = 0.3.
XMM–NEWTON BRIGHT SERENDIPITOUS SURVEY
The XBS is a wide-angle (∼28 deg2) high Galactic latitude (|b| > 20°) survey based on the XMM–Newton archival data. It is composed of two flux-limited samples: the XMM Bright Source Sample (BSS; 0.5–4.5 keV band, 389 sources) and the XMM Hard Bright Source Sample (HBSS; 4.5–7.5 keV band, 67 sources, with 56 sources in common with the BSS sample), having a flux limit of ∼7 × 10⁻¹⁴ erg cm−2 s−1 in both energy selection bands. Selection criteria and properties of these samples are described in Della Ceca et al. (2004). The XBS is composed of sources that are detected serendipitously in the field-of-view of the XMM–Newton pointing, thus excluding the targets of the observations. For this reason the XBS can be considered as representative of the X-ray sky down to its flux limit.
To date, the spectroscopic identification level has reached 98 and 100 per cent in the BSS and the HBSS samples, respectively. Most of the spectroscopic identifications are presented and discussed in Caccianiga et al. (2007, 2008).
The availability of good XMM–Newton data for the sources in the XBS sample, spanning the energy range between ∼0.3 and ∼10 keV, allowed us to perform a reliable X-ray spectral analysis for almost every AGN of the sample (Corral et al. 2011).
The sample
Since the goal of this paper is the study of the possible dependence of Γ, Kbol, αOX and the disc/corona luminosity ratio on the accretion rate, we restrict the analysis to the subsample of radio-quiet 154 type 1 AGN for which all these parameters have been already derived by fitting the UV–optical spectral energy distribution (SEDs) of the sources (Marchese et al. 2012) and by studying the X-ray and optical spectra. The radio-loud AGN of the sample (see Galbiati et al. 2005) were not considered to avoid possible contamination from the relativistic jet to the SED. The analysis of the SEDs was carried out on a subset of objects for which optical and UV data are available (either a detection or an upper limit) from existing catalogues [Sloan Digital Sky Survey (SDSS) and Galaxy Evolution Explorer (GALEX)]. Since the availability of these data depends mainly on the position of the source in the sky and not on its intrinsic properties, this subset can be confidently considered as a representative subsample of the original one (see Marchese et al. 2012). In addition, in order to minimize the uncertainties on the values of Lbol, we have further restricted the analysis on a subsample of objects for which the possible effects of absorption are negligible, i.e. type 1 AGN with an intrinsic absorbing column density, measured from the X-ray spectra, below 5 × 1020 cm−2. Finally, we have excluded from the analysis the small fraction (∼8 per cent) of ‘elusive’ type 1 AGN, i.e. those sources whose optical spectrum is dominated by the host galaxy (see Severgnini 2003; Caccianiga et al. 2007), due to the impossibility of computing the BH mass through the single epoch (SE) spectral method (e.g. see Peterson 2010; Marziani & Sulentic 2012). In total, the final sample contains 71 objects. A Kolmogorov–Smirvov (K–S) test indicates that this subsample is not statistically different (at 95 per cent confidence level) from the original one from what concerns the Eddington ratio (Fig. 1) and the redshift (Fig. 2) distributions. We have also evaluated the possible impact of the exclusion of ‘elusive’ AGN from the analysis (see Section 3). The final sample used in this work consists of type 1 AGN with rest frame 2–10 keV luminosities ranging from 6 × 1041 to 9 × 1046 erg s−1 and redshift from 0.04 to 2.
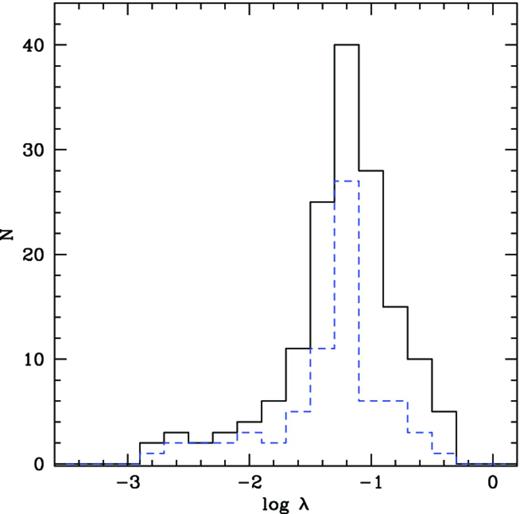
Eddington ratio distribution for the total sample presented in Marchese et al. (2012) (solid black line, 154 AGN) and for the subsample used here (dashed blue line, 71 AGN). The K–S test gives a probability for the null hypothesis (i.e. the two distributions are drawn from the same parent population) of 0.12.
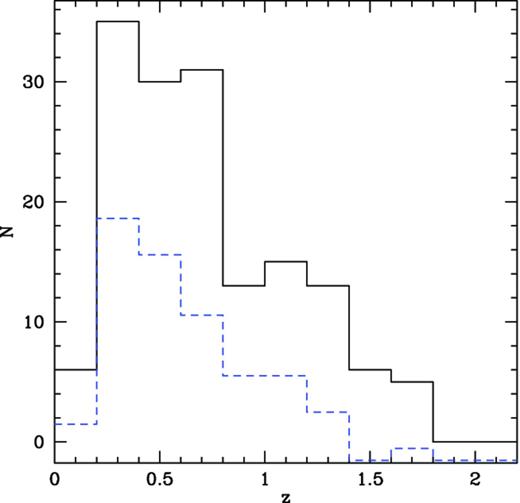
Redshift distribution for the total sample presented in Marchese et al. (2012) (solid black line, 154 AGN) and for the subsample used here (dashed blue line, 71 AGN). The K–S test gives a probability for the null hypothesis (i.e. the two distributions are drawn from the same parent population) of 0.35.
Parameters
In this section, we describe the methods adopted to determine the parameters of interest (all reported in Table C1).
Lbol and |$\dot{M}$|. Bolometric luminosities were obtained as the sum of the accretion disc luminosity (|$L_{\rm {\rm disc}}$|) and the 0.1–100 keV X-ray luminosity. |$L_{\rm {\rm disc}}$| was obtained by fitting the optical–UV data with a disc model (Marchese et al. 2012), while LX was obtained by extrapolating the results obtained in the 2–10 keV energy range analysing the XMM–Newton data (Corral et al. 2011). As described in Marchese et al. (2012), the uncertainties on the bolometric luminosities take into account both the statistical errors on photometry and additional sources of error due to the correction for the intrinsic extinction and the long-term variability (since the used photometric data are not simultaneous).
From bolometric luminosities we estimate the absolute accretion rate, defined aswhere η is the efficiency of the mass to energy conversion, assumed to be 0.1. The uncertainties associated with the values of |$\dot{M}$| in Table C1 are those related to the bolometric luminosity, i.e. we do not assume any error on η. The uncertainty on this value is difficult to assess. Marconi et al. (2004) estimate a range of values for η between 0.04 and 0.16 and, therefore, an additional uncertainty on |$\dot{M}$| up to a factor of ∼2 could be expected, besides that reported in Table C1. We note that, as explained above, the bolometric luminosities include the X-ray emission. Therefore, by using these bolometric luminosities to compute |$\dot{M}$| we are implicitly assuming that the energy budget carried by the X-ray emission is directly related to the accretion process.(1)\begin{equation} \dot{M} = \frac{L_{\rm bol}}{\eta c^2}, \end{equation}- MBH and Eddington ratio λ. Black hole masses of the XBS type 1 AGN are computed in Caccianiga et al. (2013) using the SE method (Peterson 2010; Marziani & Sulentic 2012). This method assumes that the BLR is gravitationally influenced by the SMBH, so the virial theorem can be applied. The velocity dispersion is derived from the broad emission line widths while the BLR size is estimated from the continuum luminosity. The choice of emission lines used for MBH estimate depends on the redshift of the source. In this sample we used Hβ (for 0 < z ≤ 0.8) and Mg ii at 2798 Å lines (for 0.8 < z ≤ 2). In particular, we adopted the relation discussed in Vestergaard & Peterson (2006) for the Hβ:and the relation presented in Shen et al. (2011) for the Mg ii λ2798 Å line:(2)\begin{eqnarray} \mathrm{Log} M_{\rm BH} &=& 6.91 + 2\,\mathrm{Log} \frac{\mathrm{FWHM (H\beta )}}{1000\,\mathrm{km\,s}^{-1}}\nonumber \\ &&+\, 0 .50\,\mathrm{Log} \frac{\lambda L_{\rm 5100\,{A\!\!\!\!\!^{^\circ}}}}{10^{44}\,\mathrm{erg\,s}^{-1}}, \end{eqnarray}the latter equation has been obtained by Shen et al. (2011) in such a way that the zero-order point (the virial factor) is the same as in the Hβ relation presented above so that the masses are consistently derived from these two equations (see the discussion in Shen et al. 2011). In both relations, the line widths refer to the broad component, and it is assumed that a narrow component has been subtracted during the fitting procedure and that the iron emission has been taken into account. All the details on how the FWHM of the emission lines have been computed are given in Caccianiga et al. (2013). The monochromatic luminosities at 5100 Å (L5100 Å) and 3000 Å (L3000 Å), respectively, are derived from the SED fitting presented in Marchese et al. (2012).(3)\begin{eqnarray} \mathrm{Log} M_{\rm BH} &=& 6.74 + 2\,\mathrm{Log} \frac{\mathrm{FWHM (Mg\,\small {II})}}{1000\,\mathrm{km\,s}^{-1}}\nonumber \\ && +\, 0.62 \,\mathrm{Log} \frac{\lambda L_{\rm 3000\,{A\!\!\!\!\!^{^\circ}}}}{10^{44}\,\mathrm{erg\,s}^{-1}}, \end{eqnarray}
The SE method is intrinsically affected by a large uncertainty, usually estimated between 0.35 and 0.46 dex (Park et al. 2012), essentially due to the unknown geometry of the BLR. Since the presence of large uncertainties can reduce significantly the strength of the correlations involving BH masses (and the derived quantities) we have estimated the impact of these errors on the analysis presented here (see Section 3.2).
From the BH masses we can estimate the accretion rate normalized to Eddington luminosity, defined aswhere LEdd is the Eddington luminosity:(4)\begin{equation} \lambda = \frac{L_{\rm bol}}{L_{\rm Edd}}, \end{equation}(5)\begin{equation} L_{\rm Edd} = \frac{4 \pi G c M_{\rm BH} m_{\rm p}}{\sigma _{\rm e}} = 1.26 \times 10^{38} \left(\frac{M_{\rm BH}}{\mathrm{M}_{{\odot }}}\right)\,{\rm erg\,s}^{-1}. \end{equation} - Γ, L(2–10) keV, Kbol, αOX and disc/corona luminosity ratio. The values of Γ(0.5–10) keV and L(2–10) keV are taken from the spectral X-ray analysis presented in Corral et al. (2011). The bolometric corrections and the values of αOX are available from Marchese et al. (2012). In particular, the bolometric correction is defined aswhile αOX is defined as(6)\begin{equation} K_{\rm bol}=\frac{L_{\rm bol}}{L_{\rm (2-10)\,keV}}, \end{equation}where fo and fx are, respectively, the rest-frame monochromatic fluxes at νo = 1.20 × 10¹⁵ Hz (corresponding to λo = 2500 Å) and νx = 4.84 × 10¹⁷ Hz (corresponding to E = 2 keV).(7)\begin{equation} \alpha _{\rm OX} = \frac{\mathrm{Log}(f_{\rm o}/f_{\rm x})}{\mathrm{Log}(\nu _{\rm o}/\nu _{\rm x})}, \end{equation}
Finally, the disc/corona luminosity ratios, defined as the ratio between the accretion disc luminosity, Ldisc, and the 0.1–100 keV X-ray luminosity (LX), are computed on the basis of the luminosities presented, again, in the Marchese et al. (2012) work.
Spearman ‘rank’ correlation coefficients and probabilities for the null hypothesis for the relations discussed in the text.
| Γ | Γ(2–10) keV | Kbol | αOX | Disc/corona | |
|---|---|---|---|---|---|
| |$r_{\rm obs}^{{a}}$|, P | robs, P | robs, P | robs, P | robs, P | |
| |$r_{\rm i}^{{b}}$| | |$r_{\rm i}^{{b}}$| | |$r_{\rm i}^{{b}}$| | |$r_{\rm i}^{{b}}$| | |$r_{\rm i}^{{b}}$| | |
| z | −0.27, 1.64 per cent | −0.13, 28.92 per cent | 0.03, 80.26 per cent | −0.22, 6.29 per cent | 0.18, 11.41 per cent |
| λ | 0.36, 0.10 per cent | 0.24, 4.14 per cent | 0.33, 0.42 per cent | −0.25, 3.32 per cent | 0.28, 1.64 per cent |
| 0.60 | 0.51 | 0.52 | −0.39 | 0.44 | |
| |$\dot{M}$| | 0.17, 15.86 per cent | 0.27, 2.14 per cent | −0.41, <0.10 per cent | 0.37, <0.10 per cent | |
| 0.19 | 0.24 | −0.41 | 0.37 |
aThese values of robs are computed by excluding the dependence on redshift via partial correlation.
bThese values of r are an estimate of the ‘intrinsic’ correlation coefficients computed by taking into account the role of errors (see text for details).
Main properties of the sample of 70 type 1 AGN analysed in this work.
| Name | z | Γ | Γ2–10 | Log Kbol | Log MBH | Log |$\dot{M}$| | Log λ | αOX | Log(Ldisc/Lcorona) |
|---|---|---|---|---|---|---|---|---|---|
| XBS J000027.7−250442 | 0.336 | 1.87|$^{+0.06}_{-0.05}$| | 1.57|$^{+0.27}_{-0.25}$| | 1.32|$^{+0.09}_{-0.11}$| | 8.63|$^{+0.10}_{-0.12}$| | −0.94|$^{+0.09}_{-0.12}$| | −1.93|$^{+0.13}_{-0.17}$| | −1.430 | 0.497 |
| XBS J000031.7−245502 | 0.284 | 2.29|$^{+0.08}_{-0.08}$| | 1.86|$^{+0.42}_{-0.52}$| | 1.48|$^{+0.10}_{-0.34}$| | 8.02|$^{+1.32}_{-0.25}$| | −1.05|$^{+0.11}_{-0.33}$| | −1.43|$^{+1.32}_{-0.41}$| | −1.362 | 0.638 |
| XBS J000102.4−245850 | 0.433 | 2.12|$^{+0.08}_{-0.07}$| | 1.89|$^{+0.28}_{-0.34}$| | 0.94|$^{+0.07}_{-0.06}$| | 8.16|$^{+0.15}_{-0.14}$| | −1.06|$^{+0.07}_{-0.06}$| | −1.58|$^{+0.17}_{-0.15}$| | −1.106 | −0.093 |
| XBS J001831.6+162925 | 0.553 | 2.39|$^{+0.04}_{-0.04}$| | 2.11|$^{+0.14}_{-0.17}$| | 1.69|$^{+0.10}_{-0.08}$| | 8.54|$^{+0.06}_{-0.05}$| | 0.06|$^{+0.10}_{-0.09}$| | −0.84|$^{+0.12}_{-0.10}$| | −1.501 | 0.757 |
| XBS J002618.5+105019 | 0.473 | 2.04|$^{+0.04}_{-0.04}$| | 1.95|$^{+0.16}_{-0.15}$| | 1.50|$^{+0.10}_{-0.08}$| | 9.03|$^{+0.10}_{-0.14}$| | 0.20|$^{+0.10}_{-0.08}$| | −1.19|$^{+0.14}_{-0.16}$| | −1.469 | 0.757 |
| XBS J002637.4+165953 | 0.554 | 2.15|$^{+0.04}_{-0.03}$| | 2.07|$^{+0.13}_{-0.13}$| | 1.26|$^{+0.09}_{-0.11}$| | 8.21|$^{+0.11}_{-0.41}$| | −0.20|$^{+0.08}_{-0.11}$| | −0.77|$^{+0.14}_{-0.42}$| | −1.363 | 0.420 |
| XBS J003418.9−115940 | 0.850 | 2.10|$^{+0.27}_{-0.16}$| | 2.03|$^{+0.43}_{-0.51}$| | 1.32|$^{+0.14}_{-0.16}$| | 8.84|$^{+0.11}_{-0.13}$| | −0.05|$^{+0.14}_{-0.16}$| | −1.25|$^{+0.18}_{-0.21}$| | −1.310 | 0.497 |
| XBS J005009.9−515934 | 0.610 | 2.28|$^{+0.09}_{-0.08}$| | 2.11|$^{+0.44}_{-0.42}$| | 1.22|$^{+0.08}_{-0.06}$| | 8.45|$^{+0.35}_{-0.58}$| | −0.48|$^{+0.08}_{-0.06}$| | −1.29|$^{+0.36}_{-0.58}$| | −1.287 | 0.289 |
| XBS J010432.8−583712 | 1.640 | 1.95|$^{+0.05}_{-0.04}$| | 1.76|$^{n.d.}_{n.d.}$| | 1.18|$^{+0.10}_{-0.10}$| | 9.94|$^{+0.08}_{-0.09}$| | 0.82|$^{+0.10}_{-0.09}$| | −1.48|$^{+0.13}_{-0.13}$| | −1.285 | 0.289 |
| XBS J012025.2−105441 | 1.338 | 2.40|$^{+0.21}_{-0.18}$| | 2.32|$^{+0.36}_{-0.31}$| | 1.90|$^{+0.14}_{-0.14}$| | 9.68|$^{+0.08}_{-0.08}$| | 1.11|$^{+0.14}_{-0.14}$| | −0.93|$^{+0.16}_{-0.16}$| | −1.558 | 1.016 |
| XBS J012119.9−110418 | 0.204 | 2.66|$^{+0.23}_{-0.14}$| | 3.56|$^{+1.54}_{-1.16}$| | 1.69|$^{+0.12}_{-0.12}$| | 8.13|$^{+0.08}_{-0.09}$| | −0.72|$^{+0.12}_{-0.12}$| | −1.21|$^{+0.14}_{-0.15}$| | −1.424 | 0.540 |
| XBS J013204.9−400050 | 0.445 | 2.42|$^{+0.17}_{-0.14}$| | 2.48|$^{+0.52}_{-0.43}$| | 1.63|$^{+0.13}_{-0.13}$| | 8.05|$^{+0.13}_{-0.12}$| | −0.47|$^{+0.13}_{-0.13}$| | −0.88|$^{+0.18}_{-0.18}$| | −1.470 | 0.757 |
| XBS J020029.0+002846 | 0.174 | 2.42|$^{+0.10}_{-0.10}$| | 2.22|$^{+0.66}_{-0.80}$| | 1.13|$^{+0.06}_{-0.05}$| | 7.65|$^{+0.17}_{-0.20}$| | −1.61|$^{+0.06}_{-0.05}$| | −1.62|$^{+0.18}_{-0.21}$| | −1.218 | 0.002 |
| XBS J021808.3−045845 | 0.712 | 1.91|$^{+0.04}_{-0.03}$| | n.d.|$^{ }_{ }$| | 1.46|$^{+0.10}_{-0.08}$| | 9.45|$^{+0.06}_{-0.05}$| | 0.53|$^{+0.09}_{-0.08}$| | −1.28|$^{+0.11}_{-0.09}$| | −1.465 | 0.694 |
| XBS J021817.4−045113 | 1.080 | 1.83|$^{+0.04}_{-0.03}$| | 1.78|$^{+0.08}_{-0.07}$| | 0.98|$^{+0.06}_{-0.07}$| | 9.23|$^{+0.07}_{-0.09}$| | 0.46|$^{+0.05}_{-0.07}$| | −1.13|$^{+0.09}_{-0.11}$| | −1.181 | −0.128 |
| XBS J021820.6−050427 | 0.646 | 1.81|$^{+0.04}_{-0.04}$| | 1.70|$^{+0.14}_{-0.13}$| | 1.40|$^{+0.06}_{-0.12}$| | 8.76|$^{+0.06}_{-0.10}$| | −0.12|$^{+0.06}_{-0.12}$| | −1.24|$^{+0.08}_{-0.16}$| | −1.451 | 0.540 |
| XBS J021923.2−045148 | 0.632 | 2.41|$^{+0.07}_{-0.04}$| | 2.20|$^{+0.23}_{-0.22}$| | 1.63|$^{+0.10}_{-0.08}$| | 8.81|$^{+0.07}_{-0.05}$| | −0.11|$^{+0.10}_{-0.08}$| | −1.28|$^{+0.12}_{-0.09}$| | −1.470 | 0.757 |
| XBS J024200.9+000020 | 1.112 | 2.03|$^{+0.05}_{-0.04}$| | 1.91|$^{+0.13}_{-0.17}$| | 1.38|$^{+0.07}_{-0.04}$| | 9.79|$^{+0.06}_{-0.04}$| | 0.57|$^{+0.07}_{-0.04}$| | −1.58|$^{+0.09}_{-0.06}$| | −1.439 | 0.587 |
| XBS J024207.3+000037 | 0.385 | 2.52|$^{+0.12}_{-0.08}$| | 1.93|$^{+0.31}_{-0.27}$| | 1.52|$^{+0.06}_{-0.07}$| | 8.42|$^{+0.10}_{-0.10}$| | −0.79|$^{+0.06}_{-0.07}$| | −1.57|$^{+0.12}_{-0.12}$| | −1.368 | 0.497 |
| XBS J031015.5−765131 | 1.187 | 1.91|$^{+0.02}_{-0.02}$| | 1.84|$^{+0.06}_{-0.06}$| | 1.26|$^{+0.09}_{-0.12}$| | 10.02|$^{+0.08}_{-0.10}$| | 0.99|$^{+0.09}_{-0.12}$| | −1.39|$^{+0.12}_{-0.16}$| | −1.364 | 0.385 |
| XBS J033208.7−274735 | 0.544 | 1.99|$^{+0.09}_{-0.07}$| | 1.92|$^{+0.19}_{-0.24}$| | 1.37|$^{+0.07}_{-0.13}$| | 9.60|$^{+0.07}_{-0.11}$| | −0.45|$^{+0.07}_{-0.13}$| | −2.41|$^{+0.10}_{-0.17}$| | −1.441 | 0.587 |
| XBS J050446.3−283821 | 0.840 | 1.97|$^{+0.11}_{-0.08}$| | 1.87|$^{+0.46}_{-0.38}$| | 0.97|$^{+0.08}_{-0.07}$| | 8.20|$^{+0.35}_{-0.36}$| | −0.44|$^{+0.08}_{-0.06}$| | −1.00|$^{+0.36}_{-0.36}$| | −1.178 | −0.037 |
| XBS J050501.8−284149 | 0.257 | 2.18|$^{+0.05}_{-0.05}$| | 2.15|$^{+0.39}_{-0.35}$| | 1.29|$^{+0.14}_{-0.11}$| | 7.44|$^{+0.11}_{-0.09}$| | −1.33|$^{+0.14}_{-0.11}$| | −1.13|$^{+0.18}_{-0.14}$| | −1.350 | 0.457 |
| XBS J051955.5−455727 | 0.562 | 2.09|$^{+0.04}_{-0.04}$| | 2.00|$^{+0.38}_{-0.33}$| | 1.21|$^{+0.08}_{-0.10}$| | 8.51|$^{+0.07}_{-0.08}$| | −0.31|$^{+0.08}_{-0.11}$| | −1.18|$^{+0.11}_{-0.14}$| | −1.262 | 0.351 |
| XBS J065400.0+742045 | 0.362 | 2.30|$^{+0.19}_{-0.12}$| | 2.37|$^{+0.60}_{-0.49}$| | 1.56|$^{+0.13}_{-0.13}$| | 8.24|$^{+0.10}_{-0.10}$| | −0.61|$^{+0.12}_{-0.13}$| | −1.21|$^{+0.16}_{-0.16}$| | −1.456 | 0.694 |
| XBS J074352.0+744258 | 0.800 | 2.03|$^{+0.07}_{-0.06}$| | 1.92|$^{+0.20}_{-0.25}$| | 1.39|$^{+0.09}_{-0.12}$| | 9.06|$^{+0.08}_{-0.09}$| | 0.21|$^{+0.10}_{-0.12}$| | −1.21|$^{+0.13}_{-0.15}$| | −1.418 | 0.638 |
| XBS J080504.6+245156 | 0.980 | 2.08|$^{+0.10}_{-0.10}$| | 1.77|$^{+0.32}_{-0.28}$| | 0.96|$^{+0.04}_{-0.04}$| | 8.39|$^{+0.14}_{-0.17}$| | −0.33|$^{+0.03}_{-0.05}$| | −1.08|$^{+0.14}_{-0.18}$| | −1.155 | −0.075 |
| XBS J080608.1+244420 | 0.357 | 2.49|$^{+0.04}_{-0.03}$| | 2.21|$^{+0.18}_{-0.23}$| | 1.53|$^{+0.06}_{-0.07}$| | 8.15|$^{+0.07}_{-0.07}$| | −0.25|$^{+0.06}_{-0.07}$| | −0.76|$^{+0.09}_{-0.10}$| | −1.380 | 0.540 |
| XBS J100100.0+252103 | 0.794 | 2.20|$^{+0.07}_{-0.04}$| | 2.12|$^{+0.17}_{-0.16}$| | 1.25|$^{+0.08}_{-0.07}$| | 8.78|$^{+0.06}_{-0.05}$| | −0.15|$^{+0.08}_{-0.07}$| | −1.29|$^{+0.10}_{-0.09}$| | −1.346 | 0.385 |
| XBS J100309.4+554135 | 0.673 | 2.27|$^{+0.07}_{-0.06}$| | 1.86|$^{+0.35}_{-0.42}$| | 1.61|$^{+0.07}_{-0.08}$| | 8.87|$^{+0.05}_{-0.05}$| | −0.01|$^{+0.08}_{-0.08}$| | −1.23|$^{+0.09}_{-0.09}$| | −1.454 | 0.757 |
| XBS J100828.8+535408 | 0.384 | 2.04|$^{+0.12}_{-0.09}$| | 1.29|$^{+0.64}_{-0.54}$| | 1.49|$^{+0.07}_{-0.08}$| | 8.75|$^{+0.30}_{-0.24}$| | −0.82|$^{+0.07}_{-0.08}$| | −1.93|$^{+0.31}_{-0.25}$| | −1.491 | 0.757 |
| XBS J100921.7+534926 | 0.387 | 2.35|$^{+0.08}_{-0.05}$| | 1.94|$^{+0.35}_{-0.34}$| | 1.28|$^{+0.08}_{-0.10}$| | 8.22|$^{+0.12}_{-0.12}$| | −0.83|$^{+0.08}_{-0.10}$| | −1.41|$^{+0.14}_{-0.16}$| | −1.309 | 0.320 |
| XBS J101838.0+411635 | 0.577 | 2.36|$^{+0.07}_{-0.06}$| | 2.09|$^{+0.30}_{-0.26}$| | 1.45|$^{+0.06}_{-0.07}$| | 8.79|$^{+0.05}_{-0.06}$| | −0.33|$^{+0.07}_{-0.07}$| | −1.48|$^{+0.09}_{-0.09}$| | −1.332 | 0.540 |
| XBS J101850.5+411506 | 0.577 | 2.30|$^{+0.05}_{-0.03}$| | 2.17|$^{+0.15}_{-0.20}$| | 1.38|$^{+0.06}_{-0.07}$| | 8.89|$^{+0.05}_{-0.04}$| | 0.07|$^{+0.07}_{-0.08}$| | −1.18|$^{+0.09}_{-0.08}$| | −1.372 | 0.540 |
| XBS J101922.6+412049 | 0.239 | 2.12|$^{+0.16}_{-0.05}$| | n.d.|$^{ }_{ }$| | 1.04|$^{+0.05}_{-0.04}$| | 8.90|$^{+0.08}_{-0.75}$| | −1.05|$^{+0.05}_{-0.04}$| | −2.31|$^{+0.09}_{-0.75}$| | −1.186 | −0.163 |
| XBS J103120.0+311404 | 1.190 | 1.85|$^{+0.12}_{-0.08}$| | 1.76|$^{+0.20}_{-0.18}$| | 1.09|$^{+0.09}_{-0.05}$| | 9.27|$^{+0.09}_{-0.06}$| | 0.35|$^{+0.09}_{-0.05}$| | −1.28|$^{+0.13}_{-0.08}$| | −1.240 | 0.132 |
| XBS J103154.1+310732 | 0.299 | 1.88|$^{+0.13}_{-0.12}$| | 1.42|$^{+0.84}_{-0.76}$| | 1.20|$^{+0.06}_{-0.07}$| | 9.25|$^{+0.26}_{-0.19}$| | −1.22|$^{+0.06}_{-0.06}$| | −2.83|$^{+0.27}_{-0.20}$| | −1.369 | 0.385 |
| XBS J103932.7+205426 | 0.237 | 1.87|$^{+0.11}_{-0.09}$| | 1.87|$^{+0.63}_{-0.54}$| | 1.04|$^{+0.07}_{-0.05}$| | 8.02|$^{+0.17}_{-0.13}$| | −1.36|$^{+0.07}_{-0.05}$| | −1.74|$^{+0.18}_{-0.14}$| | −1.273 | 0.132 |
| XBS J103935.8+533036 | 0.229 | 2.08|$^{+0.15}_{-0.10}$| | 2.22|$^{+0.56}_{-0.43}$| | 1.34|$^{+0.09}_{-0.12}$| | 8.70|$^{+0.07}_{-0.09}$| | −0.99|$^{+0.09}_{-0.12}$| | −2.05|$^{+0.11}_{-0.15}$| | −1.333 | 0.587 |
| XBS J104026.9+204542 | 0.465 | 1.99|$^{+0.03}_{-0.03}$| | 1.88|$^{+0.13}_{-0.13}$| | 0.97|$^{+0.04}_{-0.05}$| | 8.52|$^{+0.05}_{-0.08}$| | −0.01|$^{+0.04}_{-0.04}$| | −0.89|$^{+0.06}_{-0.09}$| | −1.043 | 0.002 |
| XBS J104509.3−012442 | 0.472 | 2.14|$^{+0.11}_{-0.06}$| | 2.13|$^{+0.29}_{-0.31}$| | 1.19|$^{+0.06}_{-0.06}$| | 8.00|$^{+0.06}_{-0.05}$| | −0.85|$^{+0.05}_{-0.06}$| | −1.21|$^{+0.08}_{-0.08}$| | −1.301 | 0.320 |
| XBS J104912.8+330459 | 0.226 | 1.67|$^{+0.12}_{-0.09}$| | 1.91|$^{+0.46}_{-0.39}$| | 0.86|$^{+0.03}_{-0.03}$| | 8.46|$^{+0.21}_{-0.18}$| | −1.40|$^{+0.02}_{-0.03}$| | −2.22|$^{+0.21}_{-0.18}$| | −1.060 | −0.603 |
| XBS J105014.9+331013 | 1.012 | 2.33|$^{+0.37}_{-0.20}$| | 2.45|$^{+0.95}_{-0.69}$| | 2.01|$^{+0.10}_{-0.13}$| | 9.72|$^{+0.13}_{-0.09}$| | 0.71|$^{+0.10}_{-0.13}$| | −1.37|$^{+0.16}_{-0.16}$| | −1.643 | 1.146 |
| XBS J105239.7+572431 | 1.113 | 2.10|$^{+0.02}_{-0.02}$| | 2.04|$^{+0.12}_{-0.16}$| | 1.71|$^{+0.07}_{-0.09}$| | 9.48|$^{+0.05}_{-0.06}$| | 0.82|$^{+0.07}_{-0.09}$| | −1.02|$^{+0.09}_{-0.11}$| | −1.550 | 0.914 |
| XBS J105316.9+573551 | 1.204 | 1.80|$^{+0.02}_{-0.02}$| | 1.97|$^{+0.14}_{-0.18}$| | 1.11|$^{+0.05}_{-0.05}$| | 8.82|$^{+0.12}_{-0.14}$| | 0.53|$^{+0.05}_{-0.05}$| | −0.65|$^{+0.13}_{-0.15}$| | −1.285 | 0.109 |
| XBS J105624.2−033522 | 0.635 | 2.16|$^{+0.09}_{-0.06}$| | 2.20|$^{+0.26}_{-0.23}$| | 1.44|$^{+0.07}_{-0.08}$| | 8.75|$^{+0.05}_{-0.05}$| | −0.20|$^{+0.07}_{-0.08}$| | −1.31|$^{+0.09}_{-0.09}$| | −1.425 | 0.638 |
| XBS J112022.3+125252 | 0.406 | 2.22|$^{+0.09}_{-0.08}$| | 1.75|$^{+0.38}_{-0.50}$| | 1.26|$^{+0.06}_{-0.07}$| | 8.26|$^{+0.06}_{-0.06}$| | −0.57|$^{+0.06}_{-0.06}$| | −1.19|$^{+0.08}_{-0.08}$| | −1.295 | 0.420 |
| XBS J120359.1+443715 | 0.641 | 2.43|$^{+0.12}_{-0.12}$| | 2.57|$^{+0.40}_{-0.34}$| | 1.37|$^{+0.11}_{-0.10}$| | 8.77|$^{+0.06}_{-0.06}$| | −0.34|$^{+0.11}_{-0.10}$| | −1.47|$^{+0.13}_{-0.12}$| | −1.396 | 1.600 |
| XBS J123116.5+641115 | 0.454 | 1.92|$^{+0.05}_{-0.05}$| | 1.91|$^{+0.25}_{-0.22}$| | 0.98|$^{+0.04}_{-0.04}$| | 9.21|$^{+0.18}_{-0.13}$| | −1.07|$^{+0.05}_{-0.04}$| | −2.64|$^{+0.19}_{-0.14}$| | −1.217 | 0.002 |
| XBS J123759.6+621102 | 0.910 | 2.05|$^{+0.04}_{-0.04}$| | 1.89|$^{+0.12}_{-0.15}$| | 1.45|$^{+0.07}_{-0.08}$| | 9.16|$^{+0.05}_{-0.05}$| | 0.40|$^{+0.06}_{-0.08}$| | −1.12|$^{+0.08}_{-0.09}$| | −1.443 | 0.638 |
| XBS J123800.9+621338 | 0.440 | 2.54|$^{+0.04}_{-0.05}$| | 2.01|$^{+0.26}_{-0.33}$| | 1.91|$^{+0.07}_{-0.09}$| | 8.44|$^{+0.09}_{-0.10}$| | −0.48|$^{+0.07}_{-0.08}$| | −1.28|$^{+0.11}_{-0.13}$| | −1.571 | 1.016 |
| XBS J124214.1−112512 | 0.820 | 1.81|$^{+0.05}_{-0.05}$| | 1.60|$^{+0.16}_{-0.15}$| | 1.32|$^{+0.10}_{-0.08}$| | 8.89|$^{+0.07}_{-0.06}$| | 0.12|$^{+0.09}_{-0.08}$| | −1.13|$^{+0.11}_{-0.10}$| | −1.431 | 0.457 |
| XBS J124607.6+022153 | 0.491 | 2.46|$^{+0.12}_{-0.08}$| | 1.81|$^{+0.57}_{-0.48}$| | 1.42|$^{+0.06}_{-0.07}$| | 8.40|$^{+0.10}_{-0.10}$| | −0.42|$^{+0.06}_{-0.07}$| | −1.18|$^{+0.12}_{-0.12}$| | −1.326 | 0.420 |
| XBS J124641.8+022412 | 0.934 | 2.21|$^{+0.07}_{-0.05}$| | 2.00|$^{+0.19}_{-0.23}$| | 1.54|$^{+0.04}_{-0.08}$| | 9.11|$^{+0.02}_{-0.06}$| | 0.70|$^{+0.03}_{-0.08}$| | −0.77|$^{+0.04}_{-0.10}$| | −1.485 | 0.757 |
| XBS J124949.4−060722 | 1.053 | 2.16|$^{+0.07}_{-0.06}$| | 1.70|$^{+0.31}_{-0.28}$| | 1.44|$^{+0.07}_{-0.08}$| | 8.53|$^{+0.05}_{-0.06}$| | 0.34|$^{+0.06}_{-0.08}$| | −0.55|$^{+0.08}_{-0.10}$| | −1.422 | 0.638 |
| XBS J132101.6+340656 | 0.335 | 2.44|$^{+0.04}_{-0.04}$| | 2.18|$^{+0.18}_{-0.20}$| | 1.68|$^{+0.07}_{-0.08}$| | 8.49|$^{+0.07}_{-0.08}$| | −0.39|$^{+0.06}_{-0.09}$| | −1.24|$^{+0.09}_{-0.12}$| | −1.351 | 0.757 |
| XBS J133807.5+242411 | 0.631 | 2.08|$^{+0.10}_{-0.08}$| | 1.84|$^{+0.32}_{-0.35}$| | 1.82|$^{+0.07}_{-0.09}$| | 8.93|$^{+0.04}_{-0.06}$| | 0.18|$^{+0.07}_{-0.09}$| | −1.11|$^{+0.08}_{-0.11}$| | −1.601 | 1.016 |
| XBS J134749.9+582111 | 0.646 | 2.20|$^{+0.02}_{-0.02}$| | 1.93|$^{+0.06}_{-0.06}$| | 1.51|$^{+0.07}_{-0.08}$| | 9.65|$^{+0.07}_{-0.07}$| | 0.84|$^{+0.06}_{-0.08}$| | −1.17|$^{+0.09}_{-0.11}$| | −1.419 | 0.694 |
| XBS J140102.0−111224a | 0.037 | 1.91|$^{+0.02}_{-0.02}$| | 1.74|$^{+0.12}_{-0.12}$| | 1.40|$^{+0.19}_{-0.35}$| | 7.71|$^{+0.96}_{-0.82}$| | −2.06|$^{+0.07}_{-0.09}$| | −2.13|$^{+0.96}_{-0.82}$| | −1.382 | 0.638 |
| XBS J141531.5+113156 | 0.257 | 1.85|$^{+0.02}_{-0.04}$| | n.d.|$^{ }_{ }$| | 1.01|$^{+0.04}_{-0.05}$| | 9.13|$^{+0.17}_{-0.15}$| | −1.06|$^{+0.05}_{-0.05}$| | −2.55|$^{+0.18}_{-0.16}$| | −1.174 | 0.043 |
| XBS J144937.5+090826 | 1.260 | 1.81|$^{+0.07}_{-0.04}$| | 1.80|$^{+0.11}_{-0.10}$| | 1.19|$^{+0.08}_{-0.06}$| | 9.50|$^{+0.07}_{-0.06}$| | 0.56|$^{+0.08}_{-0.06}$| | −1.30|$^{+0.11}_{-0.08}$| | −1.332 | 0.261 |
| XBS J160706.6+075709 | 0.233 | 2.42|$^{+0.09}_{-0.08}$| | 2.02|$^{+0.62}_{-0.55}$| | 1.40|$^{+0.06}_{-0.07}$| | 7.70|$^{+0.10}_{-0.11}$| | −1.24|$^{+0.06}_{-0.07}$| | −1.30|$^{+0.12}_{-0.13}$| | −1.382 | 0.420 |
| XBS J160731.5+081202 | 0.226 | 2.67|$^{+0.22}_{-0.13}$| | 2.32|$^{+0.72}_{-0.87}$| | 1.74|$^{+0.09}_{-0.08}$| | 6.99|$^{+0.09}_{-0.11}$| | −1.09|$^{+0.09}_{-0.08}$| | −0.44|$^{+0.13}_{-0.14}$| | −1.335 | 0.587 |
| XBS J165406.6+142123 | 0.641 | 1.88|$^{+0.12}_{-0.08}$| | 1.93|$^{+0.39}_{-0.34}$| | 1.61|$^{+0.13}_{-0.13}$| | 8.90|$^{+0.09}_{-0.10}$| | 0.04|$^{+0.13}_{-0.13}$| | −1.22|$^{+0.16}_{-0.16}$| | −1.478 | 0.829 |
| XBS J165425.3+142159 | 0.178 | 2.11|$^{+0.04}_{-0.02}$| | 1.97|$^{+0.13}_{-0.13}$| | 0.89|$^{+0.05}_{-0.04}$| | 7.61|$^{+0.26}_{-0.36}$| | −1.02|$^{+0.04}_{-0.04}$| | −0.99|$^{+0.26}_{-0.36}$| | −1.124 | −0.196 |
| XBS J165448.5+141311 | 0.320 | 1.81|$^{+0.07}_{-0.04}$| | 1.78|$^{+0.20}_{-0.27}$| | 0.81|$^{+0.02}_{-0.02}$| | 8.75|$^{+0.05}_{-0.06}$| | −0.68|$^{+0.02}_{-0.02}$| | −1.79|$^{+0.05}_{-0.06}$| | −1.016 | −0.540 |
| XBS J205635.7−044717 | 0.217 | 2.40|$^{+0.10}_{-0.08}$| | 1.83|$^{+0.52}_{-0.73}$| | 1.43|$^{+0.11}_{-0.11}$| | 7.60|$^{+0.10}_{-0.09}$| | −1.01|$^{+0.11}_{-0.11}$| | −0.97|$^{+0.15}_{-0.14}$| | −1.347 | 0.497 |
| XBS J213002.3−153414 | 0.562 | 2.06|$^{+0.13}_{-0.12}$| | 2.31|$^{+0.33}_{-0.30}$| | 1.68|$^{+0.13}_{-0.14}$| | 8.53|$^{+0.08}_{-0.07}$| | 0.39|$^{+0.14}_{-0.13}$| | −0.50|$^{+0.16}_{-0.15}$| | −1.567 | 1.016 |
| XBS J214041.4−234720 | 0.490 | 2.17|$^{+0.05}_{-0.05}$| | 1.91|$^{+0.19}_{-0.24}$| | 1.46|$^{+0.10}_{-0.08}$| | 9.31|$^{+0.06}_{-0.06}$| | 0.01|$^{+0.10}_{-0.08}$| | −1.66|$^{+0.12}_{-0.10}$| | −1.400 | 0.694 |
| XBS J225050.2−642900 | 1.251 | 2.04|$^{+0.04}_{-0.04}$| | 1.93|$^{+0.12}_{-0.12}$| | 1.26|$^{+0.11}_{-0.11}$| | 9.71|$^{+0.11}_{-0.08}$| | 0.69|$^{+0.11}_{-0.10}$| | −1.38|$^{+0.16}_{-0.13}$| | −1.374 | 0.457 |
| XBS J231342.5−423210 | 0.973 | 2.14|$^{+0.08}_{-0.04}$| | 2.00|$^{+0.16}_{-0.15}$| | 1.21|$^{+0.08}_{-0.06}$| | 9.12|$^{+0.11}_{-0.11}$| | 0.30|$^{+0.08}_{-0.06}$| | −1.18|$^{+0.14}_{-0.13}$| | −1.309 | 0.351 |
Notes. Column 1: source name; column 2: redshift; column 3: X-ray spectral index between 0.5 and 10 keV; column 4: X-ray spectral index between 2 and 10 keV; column 5: logarithm of the bolometric correction; column 6: logarithm of the BH mass in units of solar masses; columns 7: logarithm of the absolute accretion rate in units of solar masses per year; column 8: logarithm of Eddington ratio; column 9: two-point spectral index; column 10: logarithm of the disc/corona luminosity ratio. All errors are at 68 per cent confidence level (please note that in Corral et al. 2011 the reported errors on Γ are at 90 per cent confidence level).
STATISTICAL ANALYSIS
We perform a non parametric Spearman rank test on each correlation between X-ray properties (spectral index Γ, Kbol, αOX, disc/corona luminosity ratio) and accretion rate (absolute |$\dot{M}$| and normalized to Eddington luminosity, λ). When the correlation is statistically significant, we perform a fit to the data [using both the ordinary least-squares (OLS) and the bisector methods; Isobe et al. 1990 to derive the functional dependence. We define a very significant correlation if the probability of null hypothesis (the two quantities are not correlated) is P ≤ 0.10 per cent, a significant correlation if P ≤ 1.00 per cent and a marginal correlation if P ≤ 5.00 per cent. For convenience, the main correlation coefficients and probabilities computed in this paper are summarized in Table 1. During the analysis, we evaluate the impact of some possible biases that we detail in the following subsections.
Flux limited nature of the sample
The XBS is a flux-limited sample. The strong L–z correlation, induced by the presence of a flux limit, may create spurious correlations or cancel real ones. This is not a problem for the correlations involving the X-ray loudness (Kbol, αOX and disc/corona luminosity ratio) since we find that these parameters are not dependent on z (see Table 1). On the contrary, the values of Γ turned out to be marginally dependent on z (see Section 4.1) and, therefore, the correlations involving this quantity are potentially affected by the aforementioned problem. To exclude this possible effect, we use the partial correlation analysis (Kendall & Stuart 1979, see also Appendix) which allows us to evaluate the correlation between two parameters excluding a third variable on which both parameters depend (in this case, the redshift). As further check of the effect of z on the correlations, we analyse the correlations involving Γ in a relatively narrow bin of z (0 ≤ z < 0.4).
Error impact on correlation coefficient
The relation (8) can be derived from linear correlation coefficient, assuming independent errors on variables. Using Monte Carlo simulations we have verified that it can be also applied to Spearman coefficients in the case of a non-linear relation (Appendix A).
The correction presented above is particularly important for the correlations involving the Eddington ratio, since its computation is based on the highly uncertain BH mass estimate. In this work we assume an intrinsic uncertainty on the BH mass of 0.40 dex which corresponds to a correction factor for the Eddington ratio of about ∼1.57.
We note that the correction discussed above can be used only to have an estimate of the intrinsic strength of the correlation under study. The probability associated with the correlation coefficient (to assess the actual presence of a correlation), instead, is still the one associated with the value of robs. Therefore, we will apply this correction only to the correlations that have been established to be statistically significant on the basis of the probabilities associated with the values of robs.
Induced correlations
|$\dot{M}$| and λ are interrelated quantities since they both depend on bolometric luminosity. A possible correlation, e.g. between Γ and λ, can create an unreal correlation between Γ and |$\dot{M}$|. To verify this situation, we use partial correlation analysis which allows us to calculate the correlation degree between the parameters of X-ray emission and λ, excluding the dependence on |$\dot{M}$| and vice versa. If the correlation disappears by excluding the dependence on the other variable, it is possible that the observed correlation is just induced by the other variable. Conversely, if the correlation remains, then both the observed correlations are likely to be real and not induced by the other variable.
Elusive AGN
RESULTS
Spectral index Γ
The spectral index Γ is found to marginally correlate with the Eddington ratio (|${\boldsymbol r}_{\rm obs} = 0.27$|, P = 1.64 per cent, Fig. 3) while the correlation between Γ and |$\dot{M}$| is not significant (|${\boldsymbol r}_{\rm obs} = 0.17$|, P = 15.86 per cent). Since Γ marginally depends also on z (robs = −0.27, P = 1.64 per cent) it is important to verify whether the observed Γ – λ correlation is in some way influenced by the luminosity–z correlation induced by the flux-limited nature of the sample (see discussion in Section 3.1). In Fig. 4 we present the Γ – λ correlation for sources in the range 0 ≤ z < 0.4. This is the range that contains the greatest number of object and offers the widest coverage of Γ – λ plane at the same time. The correlation in this bin of z is highly significant (|${\boldsymbol r}_{\rm obs} = 0.71$|, P < 0.10 per cent).
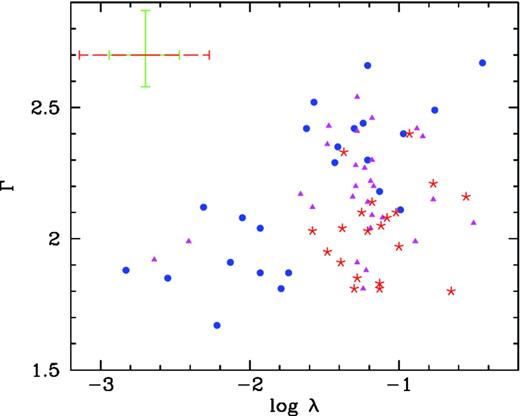
Plot of Γ against λ. A typical error is shown in the upper left-hand corner: the green solid error bar is the statistical error, the red dashed one corresponds to the total error on λ (which includes the uncertainty related to the virial method used to estimate the BH masses). The filled points (blue in the colour version) are sources with 0 ≤ z < 0.4, triangles (magenta in the colour version) are sources with 0.4 ≤ z < 0.8 and the stars (red in the colour version) are sources with 0.8 ≤ z < 2.
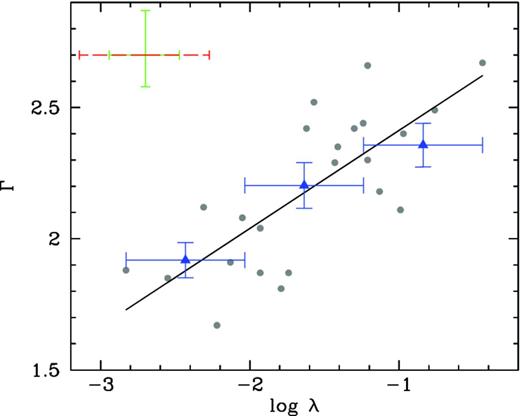
Plot of Γ against λ in the range 0 ≤ z < 0.4. A typical error is shown in the upper left-hand corner: the green solid error bar is the statistical error, the red dashed one corresponds to the total error on λ (which includes the uncertainty related to the virial method used to estimate the BH masses). The solid line represents the OLS best-fitting relation. Blue triangles are the binned data.
To further check this correlation, we have used the partial correlation method to exclude the dependence on z from the analysis on the total sample of 71 AGN. Again, we find a significant correlation with |${\boldsymbol r}_{\rm obs} = 0.36$| (P = 0.10 per cent). We conclude that the Γ – λ correlation is not induced by z. Rather, the effect of z is to weaken the correlation (see Fig. 3).
It is interesting to establish the origin of the Γ – z dependence. The spectral index Γ was computed using data in the range between 0.5 and 10 keV at rest frame. In this energy range the X-ray spectrum could be contaminated by the presence of the soft excess component. The origin of this component is still unclear. The classical interpretation of the soft excess is represented by the high-energy tail of blackbody emission of the disc accretion (Czerny & Elvis 1987; Grupe et al. 2010). However, this interpretation was questioned when several studies showed that the observed temperature of resulting blackbody is remarkably constant across orders of magnitude of luminosities and BH masses (Gierliński & Done 2004; Crummy et al. 2006). In the spectral analysis discussed in Corral et al. (2011) the soft excess component has been included in the model only if statistically required by the fit. This means that, if the number of counts is not large enough, the presence of the soft excess could be undetected and, thus, not included as additional component in the fitting procedure. In these cases the fit is expected to produce a steeper value of Γ. Notably, the influence of this component depends on z: with increasing z, the soft excess is confined to lower energies and it becomes negligible for z > 1 – 2 (Mateos et al. 2010; Scott et al. 2011). Therefore, the presence of the soft excess can produce a spurious anticorrelation between Γ and z making steeper values of Γ at low redshifts. In order to test whether the soft excess is at the origin of the observed Γ – z dependence, we have re-computed the values of Γ by restricting the data to energies above 2 keV (rest frame) in order to exclude the possible contamination due to the soft excess. The resulting values of Γ(2–10) keV are poorly determined due to the low statistics in the hard part of the spectrum. Nevertheless, they can be used as an independent test of our conclusions. We find that the values of Γ(2–10) keV do not depend on z (|${\boldsymbol r}_{\rm obs} = -0.13$|, P = 28.92 per cent), while they depend on λ, although with a lower significance (|${\boldsymbol r}_{\rm obs} = 0.24$|, P = 4.14 per cent) when compared to Γ. In principle, given the larger errors on Γ(2–10) keV if compared to Γ, we do expect any correlation to be weaker when considering this parameter. Using equation (8) discussed in Section 3.2, it is possible to have an estimate of the impact of the larger errors on the correlations. Since the average error on Γ(2–10) keV (ϵ ∼ 0.20) is a factor ∼2.5 larger than the average error on Γ (ϵ ∼ 0.08) we expect a decrease by a factor of ∼1.3 of the correlation coefficient just due to the increased errors. Thus, if Γ(2–10) keV had the same dependence on z and λ as Γ (robs = −0.27 and 0.36, respectively) we should expect to observe correlation coefficients reduced by a factor of 1.3, i.e. robs = −0.21 and 0.28, respectively. While the observed coefficient for the Γ(2–10) keV – λ correlation (0.24) is quite close to the expected one (0.28), the Γ(2–10) keV – z correlation coefficient (−0.13) is nearly half than the expected one (−0.21). We consider this as an indication that the Γ(0.5–10 keV) – λ and Γ – λ correlation has probably a similar strength while the dependence of the hard spectral index with redshift is much weaker (if any). These results support both the idea that the dependence between Γ and z is (mainly) induced by the presence of the soft excess and the idea that it is the spectral index of the primary X-ray component, and not the soft excess intensity, that correlates with the Eddington ratio. Clearly, better quality spectra, in particular at energies above 2 keV, are required to put these conclusions on a firmer ground.
Both Γ and, in particular, λ are characterized by uncertainties that are on average large with respect to the variance of the parameters. As explained in Section 3.2, the presence of such large errors reduces significantly the measured strength of the correlation, i.e. the value of r. In order to have a better estimate of the actual level of correlation between Γ and λ, we have thus applied the corrections described in Section 3.2 finding a corrected value of |${\boldsymbol r}_{\rm i}$| of 0.6. In the case of linear correlation, the square of |${\boldsymbol r}_{\rm i}$| gives an indication of how much of the observed variance on Γ is regulated by the value of λ. We thus conclude that about 40 per cent of the variance on the spectral index is explained by λ. This is the strongest correlation found in the sample. We have evaluated the impact of the elusive AGN (Section 3.4) by adding these objects to the sample. We find that their addition improves the Γ – λ correlation while the |$\Gamma -\dot{M}$| correlation remains not significant. We conclude that the observed Γ – λ correlation is not due to the exclusion of the elusive AGN.
Bolometric correction |$\boldsymbol {K_{\rm bol}}$|
We find a significant correlation between Kbol and λ (|${\boldsymbol r}_{\rm obs} = 0.33$|, P = 0.42 per cent, Fig. 5), while the correlation between Kbol and |$\dot{M}$| is only marginally significant (|${\boldsymbol r}_{\rm obs} = 0.27$|, P = 2.14 per cent).
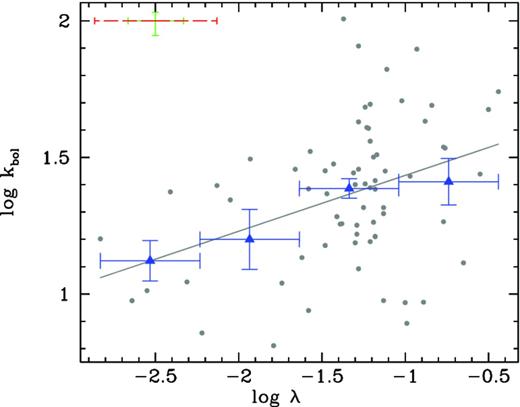
Plot of Kbol against λ. A typical error is shown in the upper left-hand corner: the green solid error bar is the statistical error, the red dashed one corresponds to the total error on λ (which includes the uncertainty related to the virial method used to estimate the BH masses). The solid line represents the OLS best-fitting relation. Blue triangles are the binned data.
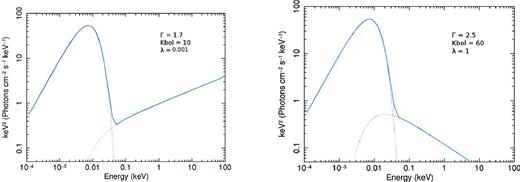
SEDs obtained using the results of the Γ – λ and Kbol – λ best fits. The SED on the left represents the case of low accretion (λ ∼ 10−3): the Kbol value is low and Γ is flat. The SED on the right represents instead the case of high accretion rate (λ ∼ 1): in this case Kbol is high and Γ is steep.
The slope obtained using the bisector method (0.72 ± 0.05) is in good agreement with that presented in Lusso et al. (2012) (0.75 ± 0.04) while the OLS slope is significantly (∼2.5σ) flatter (0.18 versus 0.39). The discrepancy is slightly reduced if we fit the data on the same range of Kbol observed in Lusso et al. (2012) (we find 0.24 ± 0.11). Again, we have verified that the observed correlations are not due to the exclusion of the elusive AGN.
In conclusion, the results show that both the spectral index Γ and the bolometric correction Kbol depend significantly on λ: steep Γ (∼2.5) and high Kbol (∼30–60) values correspond to higher λ (∼1), flat Γ (∼1.7) and low Kbol values (∼10) correspond to lower λ (∼10−2). Since Kbol depends also on Γ it is possible that the Kbol – λ correlation is induced by the (stronger) Γ – λ correlation. Again, we have verified this hypothesis using the partial correlation analysis and found that the dependence between Kbol and λ can indeed be explained as induced to the Γ – λ correlation.
In order to visualize these dependences we show in Fig. 6 two theoretical SEDs representing two extreme cases of low (λ ∼ 10−3, left-hand panel) and high (λ ∼ 1, right-hand panel) accretion rate. We have built these SEDs using a Shakura–Sunyaev disc model with a maximum temperature of 3 eV (corresponding to the average temperature of the sample sources) and a power law in the range between ∼0.01 and 100 keV with a cut-off at 0.1 keV. The values of the spectral index of the X-ray power law and the relative normalizations between the disc and the X-ray component are obtained from our Γ – λ and Kbol – λ fits, i.e. from (10) and (12). In this way the two SEDs of Fig. 6 can be considered as a visual representation of the correlation analysis discussed in the previous sections. To simplify the comparison between the two SEDs, we assumed the same disc emission in both cases. It is clear from the comparison of the two SEDs that the variation of Kbol with λ can be simply explained as due to a change of Γ, as suggested by the partial correlation analysis. We stress that the point where the disc emission intersects the corona emission is not fixed ‘a priori’ but it comes from the values of Γ and Kbol obtained from the fits.
|$\boldsymbol {\alpha _{\rm OX}}$|
Contrary to what is observed for the Kbol, we find a marginally significant anticorrelation between |$\alpha \rm _{\rm OX}$| and λ (|${\boldsymbol r}_{\rm obs} = -0.25$|, P = 3.32 per cent) while we find a significant anticorrelation between αOX and |$\dot{M}$| (|${\boldsymbol r}_{\rm obs} = -0.41$|, P < 0.10 per cent, Fig. 7). Even if we weight the correlation coefficients for the errors the dependence between αOX and |$\dot{M}$| remains the strongest one (|${\boldsymbol r}_{\rm i} = -0.41$| versus −0.39). This result confirms what is usually found in the literature, i.e. that the value of αOX anticorrelates with the bolometric/UV luminosity while it has weaker dependence with the Eddington ratio. The inclusion of the elusive AGN improves the significance of both αOX – λ and |$\alpha _{\rm OX}\,-\,\dot{M}$| correlations.
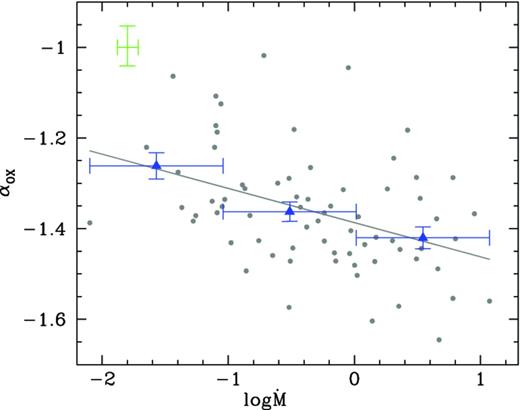
Plot of αOX against |$\dot{M}$|. A typical error is shown in the upper left-hand corner and it is the average statistical error on αOX and |$\dot{M}$|. The solid line represents the OLS best-fitting relation. Blue triangles are the binned data.
Since both Kbol and αOX are expected to be in some way proxies of the disc/corona relative intensity, the fact of finding two different dependences for these two quantities, one (Kbol) on the relative accretion rate and the other (αOX) on the absolute accretion, seems difficult to reconcile. However, these two observational parameters are clearly related but not identical. The major difference is the fact that αOX is defined at given monochromatic frequencies while Kbol is the ratio of two integrated quantities. For a fixed value of Kbol we can measure different values of αOX depending on the actual spectral shape and vice versa. In particular, the value of αOX is less sensitive to the slope of the X-ray emission if compared to Kbol (|${\boldsymbol r}_{\rm obs} = -0.24$|, P = 4.04 per cent for αOX – Γ, and |${\boldsymbol r}_{\rm obs} = 0.53$|, P < 0.1 per cent for Kbol – Γ). As shown in the previous section, the dependence of Kbol to the Eddington ratio is probably induced by a change of Γ so it is probable that the weaker dependence of αOX on λ is a consequence of the weaker dependence of αOX on Γ.
On the other hand, the significant dependence of αOX with |$\dot{M}$| suggests that the disc/corona relative intensity depends also on the absolute accretion rate. We test this hypothesis in the next section by studying directly the disc/corona luminosity ratio.
Disc–corona luminosity ratio
The dependences of Kbol and αOX discussed in the previous sections seem to suggest a complex relationship between the disc/corona luminosity ratio and the accretion. From the one hand, there is a significant dependence on the Eddington ratio, probably related to a change of X-ray slope with λ. On the other hand, there could be also a dependence of the disc/corona luminosity ratio on the absolute level of accretion rate. We now want to study directly the dependence of the disc/corona luminosity ratio with accretion. As expected, the situation in this case is more complex than the Kbol and αOX case. We find significant correlation with |$\dot{M}$| (|${\boldsymbol r}_{\rm obs} = 0.37$|, P < 0.10 per cent, Fig. 8) and a marginally significant correlation with λ (|${\boldsymbol r}_{\rm obs} = 0.28$|, P = 1.64 per cent, Fig. 9). We find a similar result if we add the elusive AGN into the analysis. The strength of the two correlations, once corrected for the errors, is quite similar (|${\boldsymbol r}_{\rm i} \sim 0.4$|) so it is difficult to establish if there is a dominant correlation that explains also the other one. It is thus possible that both correlations are in fact present, i.e. that the disc/corona relative intensity depends both on λ and |$\dot{M}$|, as expected from the combination of the results obtained for Kbol and αOX.
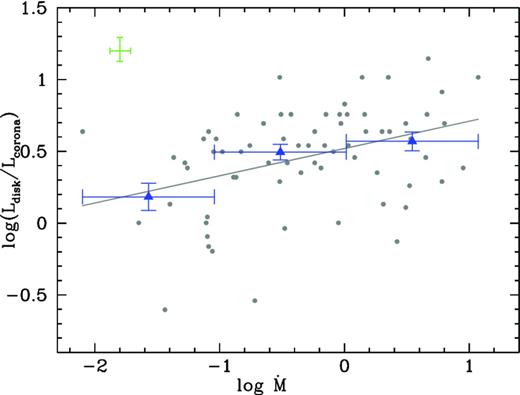
Plot of disc–corona luminosity ratio against |$\dot{M}$|. A typical error is shown in the upper left-hand corner and it is the average statistical error on disc–corona luminosity ratio and |$\dot{M}$|. The solid line represents the OLS best-fitting relation. Blue triangles are the binned data.
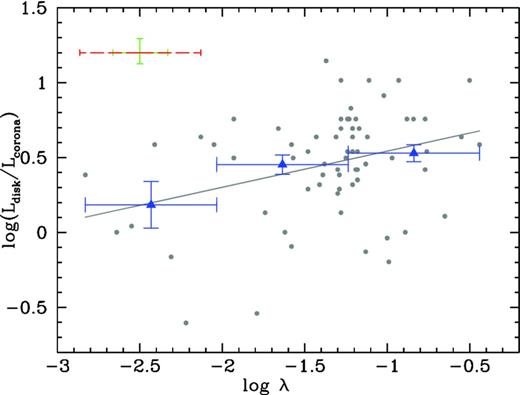
Plot of disc–corona ratio against λ. A typical error is shown in the upper left-hand corner: the green solid error bar is the statistical error, the red dashed one corresponds to the total error on λ (which includes the uncertainty related to the virial method used to estimate the BH masses). The solid line represents the OLS best-fitting relation. Blue triangles are the binned data.
DISCUSSION AND CONCLUSIONS
In this paper we studied the link between X-ray emission and accretion rate in a statistically well-defined and complete sample of 71 type 1 AGN extracted from the XBS. The X-ray properties analysed here are the spectral index Γ in the range 0.5–10 and 2–10 keV band and the X-ray ‘loudness’ parametrized with both the bolometric correction Kbol (defined as the ratio between bolometric luminosity and 2–10 keV luminosity) and the two-points spectral index αOX. We have also directly analysed the disc/corona luminosity ratio. The spectral index gives direct information about the energy distribution of the electrons in the corona, while the other three parameters quantify, in different ways, the relative importance between disc and corona.
We have considered different possible biases which can influence final results, such as
soft excess contamination;
redshift-induced correlations (important in flux-limited samples);
impact of errors on correlation coefficients (especially on MBH estimate);
interconnected dependences due to the fact that the parameters considered in the analysis are not all independent;
the impact of the exclusion of ‘elusive’ AGN from the analysis on the final results.
The results can be summarized as follows.
The spectral index Γ depends significantly on accretion rate normalized to Eddington luminosity; in particular, ∼40 per cent of Γ variance could be explained by λ. This correlation is not due to the soft excess contamination, but it probably reflects a true dependence of the slope of the primary X-emission with λ. The Γ – λ dependence can be speculatively attributed to the effect of cooling of the electrons in the corona: for high values of λ, a large number of photons comes from the accretion disc and cools corona electrons rapidly, thus producing steep X-ray spectra while for low values of λ, less photons are available and this makes electron cooling inefficient, thus producing flat X-ray spectra (see for instance Cao 2009).
The ‘X-ray loudness’ depends both on λ and |$\dot{M}$| but the dependence with λ is probably just the consequence of the (stronger) Γ – λ dependence.
The strength of the dependence between the ‘X-ray loudness’ and λ or |$\dot{M}$| is different depending on whether we parametrize the X-ray loudness using the Kbol or the αOX: while Kbol seems to depend mainly on λ, the values of αOX show a stronger dependence with |$\dot{M}$|. The explanation is likely connected to the different sensitivity of these two parameters to the X-ray spectral index.
We thank the referee for useful comments that improved the paper. We acknowledge Massimo Dotti, Francesco Haardt, Monica Colpi and Valentina Braito for useful discussions and Laura Maraschi and Tommaso Maccacaro for the precious comments. The authors acknowledge financial support from ASI (grant n. I/088/06/0), from the Italian Ministry of Education, Universities and Research (PRIN2010-2011, grant n. 2010NHBSBE) and from the Spanish Ministry of Economy and Competitiveness through grant AYA2012-31447.
The Eddington luminosity is a theoretical limit beyond which the accretion process stops for effect of radiation pressure.
The ‘soft excess’ is an excess of counts, at energies below 2 keV, with respect to the power-law component fitted at higher energies (typically between 2 and 10 keV).
REFERENCES
APPENDIX A: ERROR IMPACT ON CORRELATION COEFFICIENT
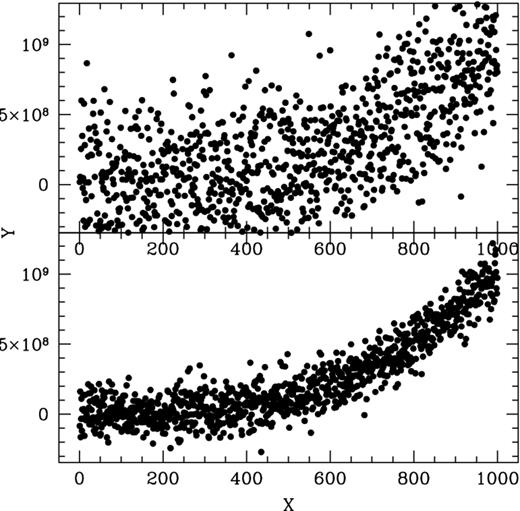
Numerical simulation (∼1000 points) that shows the impact of a big error (comparable with the variance of the variable, in this example Y) on the Y – X correlation. In this example we assume a correlation coefficient r ∼ 0.87 (lower panel) and we add an error on Y comparable with the intrinsic variance on Y. The resulting correlation (upper panel) is significantly reduced (r ∼ 0.62).
We repeated these simulations for different values of errors and the trend of the observed robs is shown in Fig. A2 (blue stars). In Fig. A2 we also report the values of ri estimated according to equation (A1) (red points). The starting value of ri ∼ 0.9 is reasonably recovered.
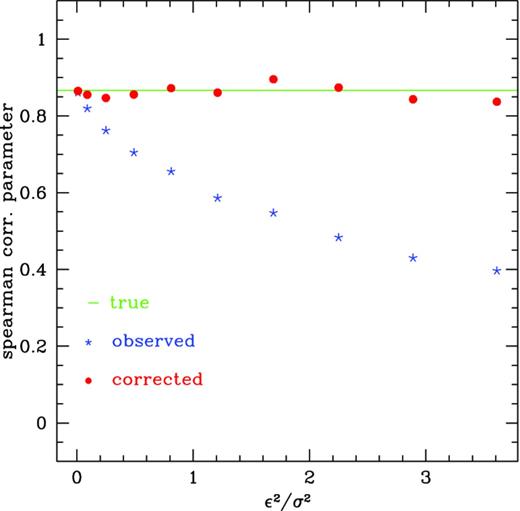
Results of numerical simulations that show the variation of the observed correlation coefficient (blue stars) with respect to the error2/variance ratio, assuming a starting value of r ∼ 0.87. The red points represent corrected r values.
APPENDIX B: PARTIAL CORRELATIONS
APPENDIX C: THE SAMPLE
In this section we present the table (Table C1) including all the quantities used in the analysis discussed in the text.
