


Abstract
We present results of a multisite photometric campaign on the high-amplitude δ Scuti star KIC 6382916 in the Kepler field. The star was observed over a 85-d interval at five different sites in North America and Europe during 2011. Kepler photometry and ground-based multicolour light curves of KIC 6382916 are used to investigate the pulsational content and to identify the principal modes. High-dispersion spectroscopy was also obtained in order to derive the stellar parameters and projected rotational velocity. From an analysis of the Kepler time series, three independent frequencies and a few hundred combination frequencies are found. The light curve is dominated by two modes with frequencies f1 = 4.9107 and f2 = 6.4314 d−1. The third mode with f3 = 8.0350 d−1 has a much lower amplitude. We attempt mode identification by examining the amplitude ratios and phase differences in different wavebands from multicolour photometry and comparing them to calculations for different spherical harmonic degree, l. We find that the theoretical models for f1 and f2 are in a best agreement with the observations and lead to value of l = 1 modes, but the mode identification of f3 is uncertain due to its low amplitude. Non-adiabatic pulsation models show that frequencies below 6 d−1 are stable, which means that the low frequency of f1 cannot be reproduced. This is a further confirmation that current models predict a narrower pulsation frequency range than actually observed.
INTRODUCTION
The high-amplitude δ Sct (HADS) stars are defined as a Population I subgroup of δ Sct type variables. They are located in the central part of the instability strip (McNamara 2000) in the core or shell hydrogen burning stage of stellar evolution and appear to be intermediate between normal δ Scuti stars and classical Cepheids. However, the distinction between HADS and other δ Sct stars is still rather arbitrary (Soszynski et al. 2008). Their large amplitude, which typically exceeds 0.3 mag, and the presence of many combination frequencies caused by non-linear coupling between the principal modes are the defining characteristics (Breger & Pamyatnykh 1998). In general, the HADS appear to pulsate mostly in the fundamental and first overtone radial modes (Balona et al. 2012). However, they need not to be purely radial pulsators, since recent studies have shown that some high-amplitude modes are non-radial (McNamara 2000; Poretti 2003; Poretti et al. 2011).
KIC 6382916 (ASAS 194803+4146.9, V = 10.79) was first monitored during the ASAS-3 North station observations and reported as a double-mode HADS star with a period ratio P1/P0 = 0.763 by Pigulski et al. (2009). The star has also been observed by the Kepler satellite in short-cadence (SC, 1-min exposures) and long-cadence (LC, 30-min exposures) modes (Gilliland et al. 2010; Jenkins et al. 2010). The Kepler observations are very important as they allow us to fix the frequencies with great precision. We can use these frequencies to fit the multicolour ground-based observations and to determine the amplitudes and phases for the purpose of mode identification.
In this paper, we present results of a multisite photometric and spectroscopic campaign on the HADS star KIC 6382916 in order to identify the modes of pulsation. Mode identification is the first step in using the frequencies to determine the stellar parameters (asteroseismology). The paper is structured as follows: we first present a detailed description of the ground- and space-based observations including method of data reduction and frequency analyses. Mode identification, which is the main purpose of this study, is presented in Section 6. Finally, we discuss these results.
SPECTROSCOPY
Spectroscopic observations were obtained at two different sites. The first set of spectra were obtained with the 2-m Ritchey-Chretien-Coude (RCC) telescope of the Bulgarian National Astronomical Observatory, Rozhen. We observed the star during two nights (2011 July 8 and 9) and in three spectral regions 4800–4910 Å (Hβ), 4500–4610 Å (Si lines) and 6390–6500 Å (Fe lines). A Photometrics AT200 camera with a SITe SI003AB 1024 × 1024 CCD chip (24 μm pixel size) was used in the third camera of the Coudé spectrograph to provide spectra with a typical resolution of R = 32 000 and a signal-to-noise (S/N) ratio of about 50. The exposure times were 1800 s. The intrinsic spectral line profile, whose half-width gave about 9 km s−1near 6500 Å, was determined from the arc spectrum. Standard iraf procedures were used for bias subtraction, flat-fielding and wavelength calibration.
We also obtained spectra of KIC 6382916 using the Wyoming InfraRed Observatory (WIRO) long-slit spectrograph with an E2V 2048 × 2048 CCD as detector. An 1800 l mm−1 grating in first order yielded a spectral resolution of 1.5 Å near 5800 Å with a 1.2 arcsec × 100 arcsec slit. The spectral coverage was 5250–6750 Å. Individual exposure time was 600 s. Reductions followed standard long-slit techniques. Each spectrum was shifted by a small amount in velocity so that the Na i D λλ 5890, 5996 lines were registered with the mean Na i line wavelength across the ensemble of observations. This zero-point correction to each observation is needed to account for the effects of image wander in the dispersion direction when the stellar full width at half-maximum (FWHM) of the point spread function is appreciably less than the slit width. Multiple exposures were then combined, yielding a final S/N ratio typically in excess of 60 near 5800 Å.
ATMOSPHERIC PARAMETERS
Model atmospheres were calculated using the atlas 12 code. The Vienna Atomic Line Data Base atomic line data base (Kupka et al. 1999), which also contains Kurucz (1993) data, was used to create a line list for the synthetic spectra. The synspec code (Hubeny, Lanz & Jeffery 1994; Krtička 1998) was used to generate synthetic spectra adopting a microturbulence of 2 km s−1. The computed spectra were convolved with the instrumental profile (a Gaussian of 0.2 Å FWHM for the Coudè spectra and 1.5 Å FWHM for the WIRO spectra) and rotationally broadened to fit the observed spectrum.
The best fit for the Hβ and Hα lines was obtained for Teff = 6950 ± 100 K and log g = 3.7 ± 0.1. We used the Mg ii λ 4481 Å line for the determination of projected rotational velocity. The match between the synthetic and observed profile resulted in vsin i = 50 ± 10 km s−1. In Fig. 1, we show the best fit for Hβ together with a fit using two other effective temperatures for comparison.
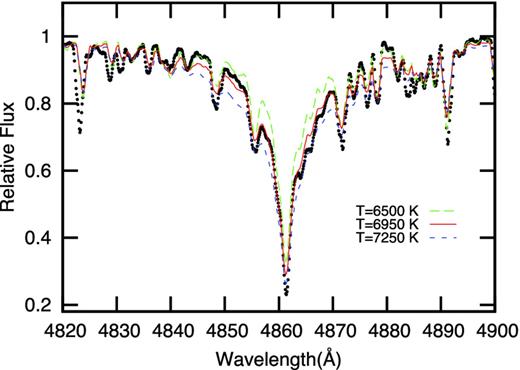
Hβ line (dots) fitted with a model with Teff = 6950 K, log g = 3.7 (cgs) (solid line). Two other models – Teff = 6500 K (long dashed line) and Teff = 7250 K (dashed line) are given for comparison.
THE Kepler PHOTOMETRY
Kepler data were used to derive the frequency content of KIC 6382916. The Kepler mission, designed to detect Earth-like planets using the transit method (Koch et al. 2010), was launched on 2009 March 6. Kepler has observed, and is continuing to observe, about 150 000 stars in a fixed field of view. The superb photometric precision and the almost continuous data coverage is of great advantage in determining the pulsational frequencies which can then be used to fit the ground-based data. Kepler observations consist mostly of LC exposures of 30-min duration, but a few thousand stars, in-cluding KIC 6382916, were observed using 1-min (SC) exposures.
The LC data are of limited value since the maximum frequency that can be extracted is about 24 d−1. We therefore used only the SC data which consists of 38 314 points between JD 245 5064.38 and JD 245 5091.48 (27.1 d) taken at Kepler quarter 2.3 (Q2.3). With SC data frequencies as high as 700 d−1 can be detected if they are present. The data were prepared for analysis by cotrending and detrending the Simple Aperture Photometry (SAP) fluxes. The cotrending process was applied to the Q2.3 data using Cotrending Basis Vector files which help to remove instrumental systematics from the light curve (Christiansen et al. 2012; Fraquelli & Thompson 2012). kepcotrend1 package that is provided by NASA Kepler Science Center is used during cotrending process. All data points were converted to magnitudes (mi) using the formula mi = −2.5 log Fi, where Fi is the raw SAP flux. A linear trend to mi as a function of time was removed so that the final magnitudes have zero mean.
We used period04 (Lenz & Breger 2005) to perform the frequency extraction. Frequencies were extracted by successive pre-whitening until the S/N threshold S/N = 3.5 was reached. All peaks with S/N ratio greater than this value were deemed significant (Breger et al. 2011). We found that the light curve can be described by two independent frequencies, f1 = 4.9107 and f2 = 6.4314 d−1, together with their harmonics and a few hundred combination terms. A third independent frequency, f3 = 8.0350 d−1, is also present but has a much lower amplitude. The amplitude spectrum is shown in Fig. 2. Apart from f1 and f2, the peaks of highest amplitude are the combination terms f1 + f2 and f2 − f1 and the harmonics 2f1 and 2f2. The lowest frequency that appears significant is f2 − f1 = 1.520 d−1. For the calculation of phase differences and amplitude ratios at different wavebands, we only considered the first seven frequencies of highest amplitude. These frequencies and their amplitudes and phases are listed in Table 1.
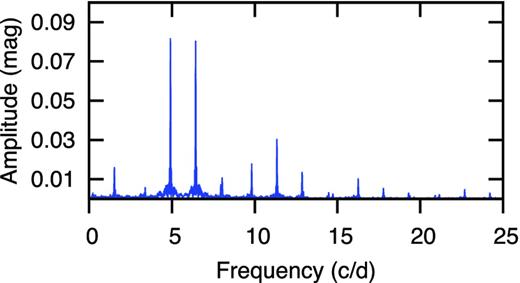
Fourier spectrum of KIC 6382916 for SC Kepler data.
Modes of highest amplitude in KIC 6382916 extracted from Kepler photometry. The first column is the name of the mode. The frequencies f (d−1), amplitudes A (mag) and phases ϕ (radian) and the S/N ratio are listed. The standard deviation in the last digits is given. The epoch of phase zero is BJD 245 4833.00.
| Name | f (d−1) | A (mag) | ϕ | S/N |
|---|---|---|---|---|
| f1 | 4.910 722(8) | 0.080 67(3) | 0.266 26(6) | 1406 |
| f2 | 6.431 366(9) | 0.078 52(3) | 0.396 24(7) | 1107 |
| f3 | 8.035 055(54) | 0.012 33(3) | 0.589 71(42) | 158 |
| f4 (f1 + f2) | 11.342 088(22) | 0.030 77(3) | 0.619 26(17) | 325 |
| f5 (2f1) | 9.819 598(39) | 0.017 34(3) | 0.938 93(30) | 209 |
| f6 (f2 − f1) | 1.522 490(34) | 0.016 24(3) | 0.923 59(27) | 250 |
| f7 (2f2) | 12.863 552(50) | 0.013 37(3) | 0.230 45(39) | 144 |
GROUND-BASED PHOTOMETRY
Photometric observations of KIC 6382916 were obtained at five different observatories located in North America and Europe. A total of 288 h of observation was accumulated over 53 nights within the 85-d duration of the campaign. The campaign began in 2011 June and ended in 2011 September (JD 245 5719.29–245 5804.48). All data were obtained with either CCD or Photomultiplier Tube (PMT) detectors attached to five different telescopes in the UBVRI photometric bands. A detailed description of the observations is given in Table 2.
Information on the photometric multisite campaign. BNAO-Rozhen: Bulgarian National Astronomical Observatory-Rozhen; OAVdA: The Astronomical Observatory of the Autonomous Region of the Aosta Valley; SPM: Observatorio de San Pedro Mártír; RBO: Red Butte Observatory; CrAO: Crimean Astrophysical Observatory. The telescope apertures are in metre. The total number of nights observed and the starting and ending Julian dates of the observations relative to JD 244 55000 are given.
| Obs. | Site | Tel. | CCD–PMT |
|---|---|---|---|
| BNAO-Rozhen | Bulgaria | 0.60–0.70 | FLI PL9000–16803 |
| OAVdA | Italy | 0.81 | FLI PL3041-1-BB |
| SPM | Mexico | 0.84 | FLI Fairchild F3041 |
| RBO | USA | 0.60 | Apogee Alta E47-UV |
| CrAO | Ukraine | 1.25 | FLI PL1001E-1 |
| CrAO | Ukraine | 1.25 | 5 channel UBVRI |
| photometer-polarimeter | |||
| Obs. | Filters | Dates | Nights |
| BNAO-Rozhen | BVRI | 3 | 735.35–782.56 |
| OAVdA | BVRI | 17 | 740.38–782.62 |
| SPM | UBVRcIc | 14 | 724.74–802.67 |
| RBO | UBVRI | 6 | 767.71–791.96 |
| CrAO | UBVRcIc | 13 | 719.29–804.48 |
The PMT data were only obtained using the 1.25-m telescope equipped with a five-channel photometer/polarimeter at CrAO. Since no U filter was available at BNAO-Rozhen and OAVdA, CCD measurements were obtained only in BVRI. Furthermore, the U data from WIRO and CrAO suffer from instabilities due to the poor quality of the data. As a result, the frequencies in the U band could not be properly resolved and therefore we decided to omit the U observations for the purpose of mode identification. All the data sets from different sites were checked carefully and prepared for Fourier analysis by removing outliers caused by bad weather conditions or some other reason. The R and I filters are all of the Johnson/Bessel type except for SPM (Mexico) and CrAO (Ukraine) which are of the Cousins/Kron type. These filter differences have a negligible effect on the resulting amplitude ratios and the phase differences, and no specific correction was applied.
Data reduction was performed by following the standard procedures. For the CCD observations, the data were reduced with standard iraf routines including dark frame, bias subtraction and flat-field corrections for each CCD frame. Data taken with the different instruments were reduced with respect to only one comparison star, GSC 3144 0053, which could be observed in the CCD field at all sites. Instrumental magnitudes were obtained with the daophot ii package (Stetson 1987) for aperture photometry. The PMT data from CrAO were reduced by following the traditional steps of obtaining differential magnitudes, sky subtraction and differential atmospheric extinction corrections using the same comparison star. Finally, the times were converted to Heliocentric Julian Date (HJD).
Since the telescopes and instruments used at the observing stations were not exactly the same, measurements from different sites have different zero-points. In order to determine the zero-point differences in each filter for each site, we assume that the light curve is well represented by a truncated Fourier series using frequencies derived from the Kepler photometry (Ulusoy et al. 2013). The Fourier spectrum of the data before pre-whitening can be seen in Fig. 3. Using the first seven frequencies of highest amplitude extracted from the SC Kepler data, the individual zero-points for the different sites together with the number of observations are shown in Table 3. The amplitudes and phases were determined by least-square fitting with the three independent frequencies: f1 = 4.9107, f2 = 6.4314 and f3 = 8.0350 d−1, the harmonics of f1 and f2 (2f1, 2f2) and the combination frequencies are listed in Table 4. The uncertainties were calculated as the standard deviations of each fitted parameter. The observed light variation of the star in the V filter together with the fitted Fourier series is shown in Fig. 4.
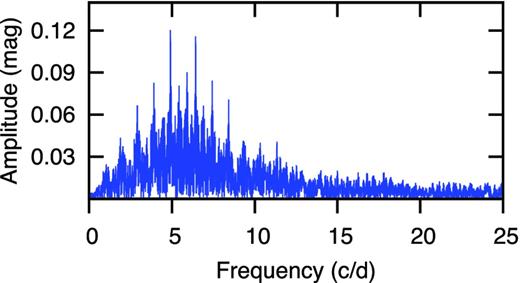
Fourier spectrum of ground-based data before pre-whitening.
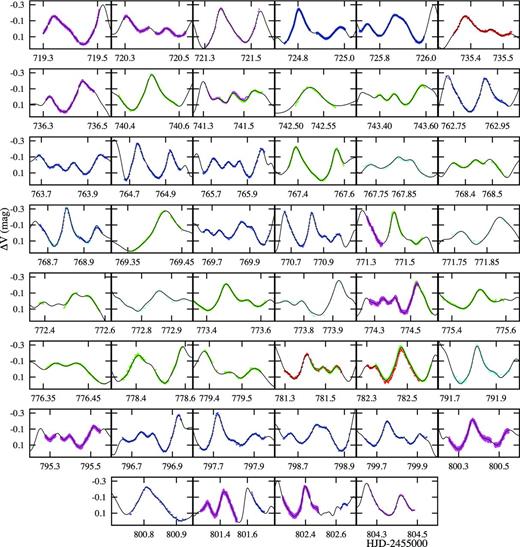
V filter light curves corrected for zero-points showing fitted Fourier curve.
Zero points in the UBVRI filters for various sites and the number of observations, N.
| Site | U | N | ||
|---|---|---|---|---|
| Mexico | −2.863 ± 0.001 | 1395 | ||
| Site | B | N | V | N |
| Bulgaria | −1.446 ± 0.002 | 373 | −0.276 ± 0.001 | 379 |
| Italy | −1.118 ± 0.001 | 3474 | −0.237 ± 0.001 | 3209 |
| Mexico | −1.289 ± 0.001 | 1435 | −0.288 ± 0.001 | 2814 |
| Ukraine | −1.255 ± 0.001 | 11795 | −0.213 ± 0.001 | 9985 |
| USA | −1.211 ± 0.002 | 278 | −0.267 ± 0.002 | 275 |
| Site | R | N | I | N |
| Bulgaria | 0.312 ± 0.001 | 372 | 0.919 ± 0.001 | 372 |
| Italy | 0.389 ± 0.001 | 2922 | 0.966 ± 0.001 | 2618 |
| Mexico | 0.317 ± 0.001 | 1420 | 0.942 ± 0.001 | 1390 |
| Ukraine | 0.395 ± 0.001 | 10587 | 1.039 ± 0.001 | 9423 |
| USA | 0.361 ± 0.002 | 273 | 0.987 ± 0.001 | 255 |
Amplitudes, A (mag) and phases (radian) for the three frequencies of highest amplitude: f1 = 4.9107, f2 = 6.4314 and f3 = 8.0350 d−1, their harmonics and linear combinations of f1 and f2. The epoch of phase zero is JD 245 5700.000.
| ID | AB | ϕB |
| f1 | 0.1281 ± 0.0005 | 0.2668 ± 0.0006 |
| f2 | 0.1263 ± 0.0005 | 0.1294 ± 0.0006 |
| f3 | 0.0145 ± 0.0005 | 0.4718 ± 0.0056 |
| f1 + f2 | 0.0469 ± 0.0005 | 0.1292 ± 0.0017 |
| 2f1 | 0.0186 ± 0.0005 | 0.3068 ± 0.0043 |
| f2 − f1 | 0.0139 ± 0.0005 | 0.2081 ± 0.0056 |
| 2f2 | 0.0226 ± 0.0005 | −0.3858 ± 0.0036 |
| ID | AV | ϕV |
| f1 | 0.0929 ± 0.0003 | 0.2779 ± 0.0006 |
| f2 | 0.0925 ± 0.0003 | 0.1228 ± 0.0006 |
| f3 | 0.0141 ± 0.0003 | −0.4650 ± 0.0037 |
| f1 + f2 | 0.0335 ± 0.0003 | 0.1219 ± 0.0015 |
| 2f1 | 0.0158 ± 0.0003 | 0.3565 ± 0.0033 |
| f2 − f1 | 0.0150 ± 0.0003 | 0.2216 ± 0.0033 |
| 2f2 | 0.0144 ± 0.0003 | −0.3996 ± 0.0036 |
| ID | AR | ϕR |
| f1 | 0.0696 ± 0.0003 | 0.2675 ± 0.0006 |
| f2 | 0.0683 ± 0.0003 | 0.1157 ± 0.0006 |
| f3 | 0.0109 ± 0.0003 | −0.4611 ± 0.0041 |
| f1 + f2 | 0.0234 ± 0.0003 | 0.1134 ± 0.0019 |
| 2f1 | 0.0123 ± 0.0003 | 0.3460 ± 0.0036 |
| f2 − f1 | 0.0086 ± 0.0003 | 0.1979 ± 0.0050 |
| 2f2 | 0.0118 ± 0.0003 | −0.4180 ± 0.0038 |
| ID | AI | ϕI |
| f1 | 0.0487 ± 0.0003 | 0.2578 ± 0.0009 |
| f2 | 0.0488 ± 0.0003 | 0.1115 ± 0.0009 |
| f3 | 0.0089 ± 0.0003 | −0.4289 ± 0.0048 |
| f1 + f2 | 0.0169 ± 0.0003 | 0.1091 ± 0.0025 |
| 2f1 | 0.0089 ± 0.0003 | 0.3375 ± 0.0047 |
| f2 − f1 | 0.0040 ± 0.0003 | 0.1372 ± 0.0105 |
| 2f2 | 0.0082 ± 0.0003 | −0.3968 ± 0.0052 |
MODE IDENTIFICATION
Photometric mode identification is based on a comparison of observed amplitude ratios or phase differences with the computed values at different wavelengths. These differences are small and require photometry of high accuracy. The best results are obtained with pulsations of high amplitude since the relative errors are smaller. With this in mind, we only considered the three independent modes with highest amplitudes in KIC 6382916. The method followed here is described in a previous multisite campaign reported by Ulusoy et al. (2013). In order to calculate the amplitude ratios and phase differences in the Johnson/Cousins BVRI system for a given spherical harmonic degree, l, we made use of the famias software package (Zima 2008). This program uses pre-computed grids of non-adiabatic stellar models. The calculations need to be restricted to models in the appropriate range of Teff, log g, stellar mass and metallicity.
For KIC 6382916, we computed the amplitude ratios and phase differences in the BVRI bands for spherical harmonic degrees 0 ≤ l ≤ 3. We adopted the stellar parameters Teff = 6950 ± 100 K, log g = 3.7 ± 0.1 and microturbulent velocity ξ = 2 km s−1. Using these parameters, the mass of KIC 6382916 is estimated to be M = 1.93 ± 0.27 M⊙ from the empirical relations in Torres, Andersen & Giménez (2010). The amplitude ratios and phase differences depend on the stellar parameters. Since the estimated stellar parameters are not very precise, we decided to calculate these values over the range 6800 < Teff < 7200 K and 3.5 < log g < 3.9.
In famias, theoretical calculations are performed adopting a grid for δ Scuti stars computed with the aton (Ventura, D'Antona & Mazzitelli 2008) and mad (Montalbán & Dupret 2007) codes. The uncertainty in the theoretical prediction of the amplitude ratios comes from the uncertainties of the parameters, amplitude, phase, effective temperature and log g (Zima 2008). The observed amplitude ratios and phase differences for f1, f2 and f3 normalized to the B filter are listed in Table 5. Comparison with the calculated values is shown in Fig. 5. Also, the relationship between the amplitude ratios, phases and these frequencies is shown in Fig. 6.
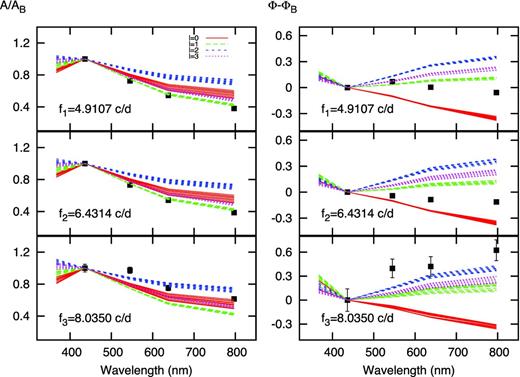
Amplitude ratios (left-hand panels) and phase differences (radian, right-hand panels) for f1, f2 and f3. The curves are from models with a range of stellar parameters of the best estimated values with a range of stellar parameters of 6800 < Teff < 7200 K and 3.5 < log g < 3.9, and for different spherical harmonic degrees, l (0 ≤ l ≤ 3). The red (solid) lines indicate l = 0, the green (long dashed) l = 1, the dark blue (dashed) l = 2 the purple (dotted) l = 3. The models computed for M = 1.90 M⊙. The black squares represent the observed values with their standard deviations for f1, f2 and f3.
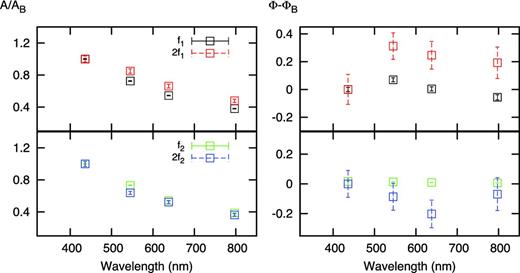
Amplitude ratios (left-hand panel) and phase differences (radian, right-hand panel) for f1, f2 and its harmonics, 2f1, 2f2.
Amplitude ratios, A/AB, and phase differences, ϕ − ϕB, (radian) for the seven frequencies of highest amplitude.
| Filters | A/AB | ϕ − ϕB | |
|---|---|---|---|
| f1 | |||
| B | 1.0000 ± 0.0055 | 0.0000 ± 0.0151 | |
| V | 0.7252 ± 0.0037 | 0.0697 ± 0.0151 | |
| R | 0.5433 ± 0.0031 | 0.0044 ± 0.0151 | |
| I | 0.3802 ± 0.0028 | −0.0565 ± 0.0188 | |
| 2f1 | |||
| B | 1.0000 ± 0.0380 | 0.0000 ± 0.1081 | |
| V | 0.8495 ± 0.0280 | 0.3123 ± 0.0955 | |
| R | 0.6613 ± 0.0240 | 0.2463 ± 0.0993 | |
| I | 0.4785 ± 0.0206 | 0.1929 ± 0.1131 | |
| f2 | |||
| B | 1.0000 ± 0.0056 | 0.0000 ± 0.0151 | |
| V | 0.7324 ± 0.0037 | −0.0415 ± 0.0151 | |
| R | 0.5408 ± 0.0032 | −0.0861 ± 0.0151 | |
| I | 0.3864 ± 0.0028 | −0.1125 ± 0.0188 | |
| 2f2 | |||
| B | 1.0000 ± 0.0313 | 0.0000 ± 0.0905 | |
| V | 0.6372 ± 0.0194 | −0.0867 ± 0.0905 | |
| R | 0.5221 ± 0.0176 | −0.2023 ± 0.0930 | |
| I | 0.3628 ± 0.0155 | −0.0691 ± 0.1106 | |
| f3 | |||
| B | 1.0000 ± 0.0488 | 0.0000 ± 0.1407 | |
| V | 0.9724 ± 0.0394 | 0.3971 ± 0.1169 | |
| R | 0.7517 ± 0.0332 | 0.4216 ± 0.1219 | |
| I | 0.6138 ± 0.0296 | 0.6239 ± 0.1307 |
As can be seen from Fig. 5, the observed amplitude ratios for f1 and f2 agree quite well if l = 1 for both modes. We could not obtain a reliable mode identification for f3 because of its low amplitude, but it appears to be either l = 0 or 2. The phase differences f1 agree quite well for l = 1, though for f2 they are intermediate between l = 1 and 0. Overall, it seems as if f1 and f2 are both dipole modes. The radial mode seems to be ruled out for both modes.
CONCLUSIONS
Analysis of SC Kepler photometry was used to determine the pulsation frequencies in KIC 6382916. We find two large-amplitude independent modes with frequencies f1 = 4.9107 and f2 = 6.43137 d−1 as previously reported by Pigulski et al. (2009) from ground-based observations. We found a third independent frequency at f3 = 8.03506 d−1 which has a much lower amplitude. The frequency spectrum is dominated by f1 and f2, and their harmonics and combination frequencies.
In HADS stars the modes of highest amplitude are generally radial modes since in many stars the period ratio P1/P0 of first overtone to fundamental radial modes is close to the expected value 0.77 < P1/P0 < 0.78. The stars lie on a curve defined by P1/P0 as a function of log P0 which is called the Petersen diagram (Petersen 1973). The period ratio depends on metallicity, rotation and chemical abundance (Suárez, Garrido & Moya 2007; Lenz et al. 2008). In KIC 6382916 the period ratio for the two modes of highest amplitude is f1/f2 = 0.763, which differs significantly from the expected period ratio for fundamental and first overtone radial modes. It therefore seems that at least one of the two modes is probably a non-radial mode. This may not be too surprising since recent studies suggest that the radial mode need not be present in all HADS stars (Poretti et al. 2011).
To determine the spherical harmonic degree of the three independent modes in KIC 6382916 we first of all need to know the stellar parameters as accurately as possible. For this purpose, we obtained high-dispersion spectra and estimated an effective temperature Teff = 6950 ± 100 K and log g = 3.7 ± 0.1 by matching the Balmer line profiles with profiles calculated from synthetic spectra. From the effective temperature and surface gravity, we estimate the mass as M = 1.93 ± 0.27 M⊙.
Mode identification is best done by comparing the relative amplitude ratios and/or phase differences in different photometric wavebands for the required mode with the calculated values. For this purpose, we initiated a multisite photometric campaign to observe KIC 6382916 in the BVRI bands. We used the frequencies derived from the Kepler data as fixed values and fitted a truncated Fourier series to the data from each waveband using the seven frequencies of highest amplitude. The resulting amplitude and phases were used to construct the relative amplitudes and phase differences, normalized to the B band, for f1, f2 and f3. We then used the famias software package (Zima 2008) to calculate amplitude ratios and phase differences for models with stellar parameters approximately corresponding to the spectroscopic values mentioned above. It turns out that f1 and f2 are both dipole (l = 1) modes and that f3 is either l = 0 or l = 2.
If the identification for both f1 and f2 is correct, it calls to mind the case of 1 Mon (Balona & Stobie 1980; Balona et al. 2001). In this star there are three modes: a central radial mode flanked by two l = 1 modes. In any case, it seems that we need to be cautious in attributing the high-amplitude modes in HADS stars as radial modes, though this is probably true in the majority of cases.
It is important to compare the observed frequencies of f1 and f2 with model frequencies for l = 1. However, we are faced with the problem that rotation strongly modifies the frequencies of the l = 1 modes. We therefore need to estimate the possible frequency shift owing to this effect which requires knowledge of the rotation frequency. In some δ Sct stars, it is possible to detect the rotational frequency directly from the periodogram of the Kepler data by looking for the presence of a low-frequency peak and its harmonic. The presence of a harmonic is an indicator that the peak is due to a star spot and hence the frequency is the rotational frequency (Balona 2013). Unfortunately, no such peak is visible in KIC 6382916.
The alternative is to estimate the rotational frequency from the projected rotational velocity vsin i = 50 ± 10 km s−1 and the stellar radius. The stellar radius is estimated to be about 3.69 ± 0.14 R⊙ using the relationships by Torres et al. (2010). If we assume that the star is roughly equator-on, the equatorial rotational velocity will probably be about 50 km s−1 and the rotation frequency around 0.27 d−1. If the star is equator-on, only sectorial modes will be visible and the frequency shift will roughly be the same as the rotation frequency. Thus, we may expect the frequencies in the non-rotating frame to be in the range 4.6 < f1 < 5.2 and 6.1 < f2 < 6.7.
We can compare these frequencies with frequencies calculated from non-rotating models. For this purpose, models of δ Scuti stars with masses in the range 1.3 < M/M⊙ < 2.5 were constructed using the Warsaw–New Jersey code (Paczynski 1970). These models use opal opacities, no core overshoot and a mixing length, α = 1.0. Pulsation frequencies for each model were obtained using the nadrot code (Dziembowski 1977). It turns out that all modes with frequencies less than about 6.1 d−1 are stable. One may argue that the rotation frequency is much larger and that the rotation correction would then bring f1 closer to this value. This argument cannot be correct since this would imply a nearly pole-on orientation, in which case sectorial modes are no longer visible. We are thus faced with the problem that current models are unable to account for driving at the low frequency of f1. Models where f1 and f2 are both present (but with f1 stable) all have 6800 < Teff < 7200 K and 3.78 < log g < 3.88 which is roughly in the range of the values determined from spectroscopy. In the model, frequencies in the range of f1 to f2 are mixed p and g modes of high radial order, but this does not mean that the observed modes are also of this kind since no model is capable of driving these frequencies. The lowest frequency of a p mode for models in the above parameter range is about 8.6 d−1. They all appear to be g modes of high order. The lowest frequency of a p mode for models in the above parameter range is about 8.6 d−1.
In conclusion, we find that the two modes of highest amplitude in KIC 6382916 are not only dipole modes, contrary to expectation, but are high-order g modes which are predicted to be stable in the models. Unless the derived stellar parameters are grossly in error, this would imply a problem in our understanding of pulsational driving in δ Scuti stars. We know that there is a problem with the models in that the observed range of instability is wider than the calculated range for δ Sct stars (Balona & Dziembowski 2011). It appears that the presence of two high-amplitude g modes in KIC 6382916 is further confirmation of this problem.
The authors acknowledge the whole Kepler team for providing the unprecedented data sets that make these results possible. This paper includes data collected by the Kepler mission. Funding for the Kepler mission is provided by the NASA Science Mission directorate. CU sincerely thanks the South African National Research Foundation (NRF) for the award of innovation post-doctoral fellowship, grant no. 73446. BU is supported by the project numbered HDYF-051. TG would like to thank NRF Equipment-Related Mobility Grant-2011 for travelling to carry out the photometric observations. LAB thanks the South African National Research Foundation and the South African Astronomical Observatory for generous financial support. IS and II gratefully acknowledge the partial support from Bulgarian NSF under grant DO 02-85. DD acknowledges for the support of grants DO 02-362 and DDVU 02/40-2010 of Bulgarian NSF. HAK acknowledges Carlos Vargas-Alvarez, Michael J. Lundquist, Garrett Long, Jessie C. Runnoe, Earl S. Wood and Michael J. Alexander for helping with the observations at WIRO. LFM acknowledges financial support from the UNAM under grant PAPIIT 104612 and from CONACYT by the way of grant 118611. MD, AC and DC are supported by grants provided by the European Union, the Autonomous Region of the Aosta Valley and the Italian Department for Work, Health and Pensions. The OAVdA is supported by the Regional Government of the Aosta Valley, the Town Municipality of Nus and the Mont Emilius Community. TEP acknowledges support from the National Research Foundation of South Africa. This study made use of iraf Data Reduction and Analysis System and the Vienna Atomic Line Data Base (VALD) services. The authors thank Dr Zima for providing the famias code.
