


Abstract
We introduce the ‘Bluedisk’ project, a large programme at the Westerbork Synthesis Radio Telescope that has mapped the H i in a sample of 23 nearby galaxies with unusually high H i mass fractions, along with a similar-sized sample of control galaxies. This paper presents the sample selection, observational set-up, data reduction strategy and a first analysis of the sizes and structural properties of the H i discs. We find that the H i-rich galaxies lie on the same H i mass versus H i size relation as normal spiral galaxies, extending it to total H i masses of 2 × 10¹⁰ M⊙ and radii R1 of ∼100 kpc. The H i-rich galaxies have significantly larger values of H i-to-optical size ratio and more clumpy H i discs than those of normal spirals. There is no evidence that the discs of H i-rich galaxies are more disturbed. In fact, the centre of the H i distribution corresponds more closely with the centre of the optical light in the H i-rich galaxies than in the controls. All these results argue against a scenario in which new gas has been brought in by mergers. It is possible that they may be more consistent with cooling from a surrounding quasi-static halo of warm/hot gas.
INTRODUCTION
The mechanisms by which galaxies acquire their gas remain one of the key unsolved problems in galaxy formation. Only ∼20 per cent of the available baryons in dark matter haloes surrounding present-day L* spiral galaxies have cooled and been transformed into stars. The star formation rates (SFRs) in these galaxies imply that their atomic and molecular gas reservoirs will be used up on time-scales of a few Gyr (Kennicutt 1983; Fraternali & Tomassetti 2012). In order to maintain star formation at its observed level over long time-scales, it is often assumed that gas must accrete from the external environment. Additional indirect evidence for gas infall comes from the fact that the metallicity distribution of main-sequence stars in the solar neighbourhood is incompatible with a closed-box scenario (‘The G-dwarf problem’, van den Bergh 1962; Pagel & Patchett 1975), implying early inflow of metal-poor gas on to the Milky Way.
Estimates of the total mass in cold gas clouds infalling on to the Milky Way yield ∼109 M⊙ within 150 kpc and ∼5 × 10⁸ M⊙ within 60 kpc (Putman 2006). These estimates assume that the fraction of a cloud that is detectable as neutral hydrogen is around 10 per cent of the total mass of the cloud. Nevertheless, these numbers are an order of magnitude smaller than predicted by simple models that attempt to calculate the rate at which gas would be cooling and fragmenting into clouds in a typical dark matter halo in a Λ cold dark matter (ΛCDM) universe (e.g. Maller & Bullock 2004). An independent analysis by Richter (2012) yields an estimate of the neutral gas accretion rate on to M31/Milky Way-type galaxies of 0.7 M⊙ yr−1, a factor of |${\sim } 3-5$| less than the observed SFRs in these systems.
In external galaxies, H i-rich companions, warped or lopsided H i discs are often cited as evidence of ongoing cold gas accretion in local spiral galaxies. In addition, there is evidence for large quantities of extra-planar gas around a few nearby spirals (Fraternali et al. 2002; Oosterloo, Fraternali & Sancisi 2007b). The kinematical structure of this gas indicates their (partially) extragalactic origin (e.g. Benjamin 2000; Collins, Benjamin & Rand 2002; Fraternali & Binney 2006, 2008; Heald et al. 2007; Kamphuis et al. 2007; Marinacci et al. 2011).
The other way in which galaxies may be ‘refuelled’ is via cooling from a hot halo of gas that is in virial equilibrium with the dark matter (White & Rees 1978). Studies of the hot gas around galaxies have been hampered by the fact that X-ray haloes that are not directly associated with galactic winds from an ongoing starburst, are only detected individually around the very most luminous spirals (Anderson & Bregman 2011; Dai et al. 2012). Recent attempts to get around this problem by analysing the X-ray emission around stacked samples of nearby spirals have clarified that hot gas not associated with present-day galactic winds is present around these systems, but estimates of cooling rates are still a factor of ∼2 too low to explain the observed star formation in these systems (Anderson, Bregman & Dai 2013). On the other hand, Marinacci et al. (2012) estimated a higher ‘fountain’-driven accretion rate from the galactic halo around the Milky Way (see also Fraternali et al. 2013).
At this point, it is still difficult to assess what the dominant gas fuelling mechanism is in the local Universe. Deep H i observations of nearby galaxies have so far been restricted to a few ‘promising cases’ (Fraternali et al. 2002; Oosterloo et al. 2007a; Boomsma et al. 2008). The Hydrogen Accretion in LOcal GAlaxieS survey (HALOGAS; Heald et al. 2011, 2012) aims to detect and characterize the extended, low-column density gas in a sample of 22 nearby galaxies. So far, mass fractions of the extraplanar H i comparable to the cases of NGC 891 (30 per cent, Oosterloo et al. 2007b) or NGC 2403 (10 per cent, Fraternali, Oosterloo & Sancisi 2004) have not been reported from HALOGAS (Heald et al. 2011; Zschaechner et al. 2011, 2012).
Single-dish H i surveys of atomic gas in complete, stellar mass-limited galaxy samples reveal that the majority of disc galaxies lie on a tight plane that links their atomic gas content with their UV/optical colours and their stellar surface mass densities (Catinella et al. 2010, hereafter C10), in line with the fact that H i-rich galaxies are systematically bluer and late-type (e.g. Roberts & Haynes 1994). Around 10 per cent of the disc galaxy population is significantly displaced from this plane in the sense of having significantly more atomic gas than would be predicted from their colours and densities. These galaxies have outer discs that are bluer (Wang et al. 2011) and younger (higher ratio of present-to-past averaged star formation). In addition, the ionized gas in these outer discs is metal-poor (Moran et al. 2012). Analysis of the star formation histories of such galaxies indicate that stars did not form continuously in these systems – an elevated rate of star formation in the past 2 Gyr is required to explain the strong Balmer absorption seen in the spectra of the outer disc stellar populations (Huang et al. 2013). All these results provide indirect evidence that such galaxies may have recently accreted cold gas in their outer regions. Although these galaxies have unusually high H i content, their molecular gas masses are normal, suggesting that the excess atomic gas exists as a largely inert reservoir in the outer regions of these galaxies (Saintonge et al. 2011).
The next step in understanding the nature of these H i-rich galaxies with young, star-forming outer discs is to investigate how the morphology, density profiles and kinematics of the gas differ from that of normal spirals. If the H i gas was accreted recently, one might expect the H i disc to be significantly more extended than the stellar disc (see Fu et al. 2010). We might also see more frequent kinematic signatures of recent accretion in the form of warps, misaligned or counter-rotating H i components in the disc, or associated gas clouds.
To this end, we undertook the ‘Bluedisk project’, a long-term large programme at the Westerbork Synthesis Radio Telescope (WSRT). Uniform, blind H i surveys covering large areas of the sky such as the Arecibo Legacy Fast ALFA (Giovanelli05 et al. 2005) survey do not extend as far north as declinations greater than 38°, where the H i maps produced by Westerbork have optimal resolution (beam size of ∼20 × 15 arcsec2). However, these surveys have taught us that selection based on optical properties is an efficient means of targeting H i-rich galaxies (Zhang et al. 2009, C10, Li et al. 2012). We used the technique outlined in Li et al. (2012) to select a sample of 25 galaxies predicted to be H i-rich, as well as a sample of 25 control galaxies matched in stellar mass, stellar mass surface density, redshift and inclination. These galaxies were observed at Westerbork over the period from 2011 December to 2012 May.
Our paper is structured as follows: in Section 2, we discuss the sample selection procedure, describe the observational set-up and data reduction strategy, provide catalogues of H i parameters, and discuss our final scheme for classifying the galaxies in our sample into those that are ‘H i-rich’ and ‘H i-normal’. In Section 3, we present total intensity H i maps for these two sub-sets. In Section 4, we discuss how we measure H i sizes and morphological parameters. In Section 5, we compare these parameters for H i-rich and H i-normal galaxies. We also examine correlations between H i sizes and morphological parameters and those measured for the UV and optical light. Our findings are summarized and discussed in Section 6. We assume H0 = 70 km s−1 Mpc−1 throughout the paper.
DATA
Sample selection
We first selected all galaxies from the DR7 MPA/JHU catalogue (http://www.mpa-garching.mpg.de/SDSS/DR7/), which is based on galaxy spectra from the Data Release 7 (DR7) of the Sloan Digital Sky Survey ( SDSS;Abazajian et al. 2009) using the following criteria: 11 > log M* > 10, 0.01 < z < 0.03, Declination > 30° and with high signal-to-noise ratio (S/N) near-ultraviolet (NUV) detection in theGalaxy Evolution Explorer (GALEX) imaging survey (Martin et al. 2010). This yields a sample of 1900 galaxies, which we use as our parent sample. Most of these galaxies have optical diameters of 50 arcsec or greater, so that the H i will be well resolved by the Westerbork synthesized beam [the minimum half-power beam width (HPBW) is 13 arcsec]. From the parent sample, we selected a sub-sample of 123 galaxies with predicted H i mass fractions 0.6 dex higher in |$\log M(\mathrm{H\,\small{I}})/M_*$| than the median relation between H i mass fraction and stellar mass found in C10. This threshold was chosen because the estimate of |$\log M(\mathrm{H\,\small{I}})/M_*$| given in equation (1) has a scatter of ∼0.3 dex, so this cut should generate a reasonably pure sample of true H i-rich galaxies. 25 targets were selected at random for Westerbork observations.
In addition, we selected a sample of 25 ‘control galaxies’ that were closely matched in M*, μ* (mass surface density, calculated as 0.5 × M*/(πr(50, z)2), where r(50,z) (in unit of kpc) is the half-light radius in z band), z and inclination, but with predicted H i fractions between 1 and 1.5 times the median value at the same value of M* and μ*. The cut was chosen to exclude gas-deficient galaxies, such as those found in rich groups or clusters. The matching tolerances are around 0.1 in log M*, log μ* and b/a and 0.001 in redshift. The control galaxies have both redder global colours and weaker colour gradients in comparison to the targets. Table 1 lists the optical/UV selection parameters of the 50 galaxies. We also derive SFRs using the spectral energy distribution fitting technique described in Wang et al. (2011); Saintonge et al. (2011). SFR surface densities are calculated as 0.5 SFR/πRNUV(50)2), where RNUV(50) (in unit of kpc) is the NUV half-light radius.
The optical/UV properties of the Bluedisk galaxies, including the galaxy ID used in this project, Right ascension, declination, redshift, stellar mass, NUV−r colour which are corrected for Galactic extinction only, g−i colour gradients, the g-band diameter at 25 mag/arcsec−2, the axis ratio in r-band, the concentration index in r band and the predicted H i mass fraction. The first 25 galaxies were originally selected as H i-rich and the others as control galaxies. The last column, flag|$_{\text{ana}}$| marks the galaxies according to their classification in Section 3: 1 for H i-rich galaxies, 2 for control galaxies and 0 for the galaxies excluded from analysis.
| ID | RA | Dec. | z | |$\log M_*/\text{M}_{{\odot }}$| | NUV−r | |$\Delta _{\text{o}-\text{i}}(g-i)$| | |$D_{25}/\text{arcsec}$| | b/a | R90/R50 | |$\log M(\mathrm{H\,\small{I}})/M_*(\text{predicted})$| | flag|$_{\text{ana}}$| |
|---|---|---|---|---|---|---|---|---|---|---|---|
| 1 | 123.591 766 | 39.251 354 | 0.0277 | 10.43 | 2.37 | −0.21 | 75.96 | 0.83 | 2.70 | −0.37 | 1 |
| 2 | 127.194 809 | 40.665 886 | 0.0245 | 10.62 | 3.02 | −0.27 | 81.30 | 0.41 | 2.15 | −0.62 | 1 |
| 3 | 129.277 161 | 41.456 322 | 0.0291 | 10.42 | 2.44 | −0.25 | 49.08 | 0.80 | 2.15 | −0.38 | 1 |
| 4 | 129.641 663 | 30.798 681 | 0.0256 | 10.57 | 2.36 | −0.29 | 88.61 | 0.47 | 2.19 | −0.40 | 1 |
| 5 | 132.318 298 | 36.119 797 | 0.0252 | 10.32 | 2.01 | −0.12 | 65.27 | 0.93 | 2.06 | −0.32 | 1 |
| 6 | 132.344 025 | 36.710 327 | 0.0251 | 10.84 | 2.94 | −0.23 | 103.79 | 0.62 | 2.38 | −0.77 | 1 |
| 7 | 132.356 155 | 41.771 252 | 0.0289 | 10.37 | 2.57 | −0.23 | 69.28 | 0.26 | 2.44 | −0.40 | 0 |
| 8 | 137.177 567 | 44.810 658 | 0.0267 | 10.28 | 2.19 | −0.27 | 66.18 | 0.67 | 2.10 | −0.25 | 1 |
| 9 | 138.742 996 | 51.361 061 | 0.0275 | 10.76 | 2.93 | −0.17 | 73.23 | 0.46 | 2.35 | −0.70 | 2 |
| 10 | 143.104 355 | 57.482 899 | 0.0294 | 10.91 | 2.43 | −0.21 | 60.12 | 0.80 | 2.00 | −0.62 | 2 |
| 11 | 152.726 593 | 45.950 371 | 0.0240 | 10.64 | 2.74 | −0.18 | 73.74 | 0.56 | 2.07 | −0.60 | 2 |
| 12 | 154.042 709 | 58.427 002 | 0.0255 | 10.63 | 2.68 | −0.29 | 82.89 | 0.36 | 2.64 | −0.58 | 1 |
| 13 | 166.995 911 | 35.463 264 | 0.0287 | 10.84 | 2.74 | −0.28 | 83.31 | 0.46 | 2.74 | −0.78 | 0 |
| 14 | 176.739 746 | 50.702 133 | 0.0238 | 10.79 | 3.25 | −0.20 | 87.33 | 0.49 | 2.58 | −0.86 | 1 |
| 15 | 177.247 757 | 35.016 048 | 0.0213 | 10.82 | 2.43 | −0.21 | 111.76 | 0.63 | 2.71 | −0.65 | 1 |
| 16 | 193.014 786 | 51.680 046 | 0.0272 | 10.31 | 2.01 | −0.22 | 54.06 | 0.76 | 1.94 | −0.21 | 1 |
| 17 | 196.806 625 | 58.135 014 | 0.0275 | 10.69 | 2.85 | −0.25 | 61.00 | 0.71 | 2.46 | −0.68 | 1 |
| 18 | 199.015 060 | 35.043 518 | 0.0232 | 10.34 | 2.28 | −0.33 | 71.17 | 0.57 | 2.25 | −0.33 | 1 |
| 19 | 212.631 851 | 38.893 559 | 0.0256 | 10.25 | 2.15 | −0.27 | 57.90 | 0.69 | 2.16 | −0.27 | 1 |
| 20 | 219.499 756 | 40.106 197 | 0.0261 | 10.21 | 1.55 | −0.39 | 77.39 | 0.62 | 2.26 | −0.02 | 1 |
| 21 | 241.892 578 | 36.484 032 | 0.0298 | 10.41 | 2.70 | −0.33 | 46.28 | 0.63 | 2.17 | −0.38 | 1 |
| 22 | 250.793 503 | 42.192 783 | 0.0284 | 10.82 | 3.07 | −0.29 | 86.07 | 0.28 | 2.76 | −0.79 | 1 |
| 23 | 251.811 615 | 40.245 079 | 0.0295 | 10.75 | 2.91 | −0.27 | 79.17 | 0.45 | 2.50 | −0.68 | 2 |
| 24 | 259.156 036 | 58.411 900 | 0.0296 | 10.71 | 2.72 | −0.21 | 80.72 | 0.53 | 2.26 | −0.66 | 1 |
| 25 | 262.156 342 | 57.145 065 | 0.0275 | 10.54 | 2.50 | −0.36 | 58.66 | 0.77 | 2.52 | −0.52 | 2 |
| 26 | 111.938 042 | 42.180 717 | 0.0231 | 10.31 | 3.81 | −0.17 | 52.96 | 0.48 | 2.56 | −0.78 | 1 |
| 27 | 120.669 388 | 34.521 431 | 0.0288 | 10.30 | 2.90 | −0.14 | 36.99 | 0.78 | 1.93 | −0.49 | 2 |
| 28 | 123.309 128 | 52.458 736 | 0.0183 | 10.54 | 3.69 | −0.16 | 61.86 | 0.84 | 2.21 | −0.87 | 2 |
| 29 | 127.312 149 | 55.522 991 | 0.0257 | 10.52 | 2.90 | −0.25 | 74.80 | 0.44 | 2.17 | −0.56 | 0 |
| 30 | 138.603 149 | 40.777 924 | 0.0280 | 10.39 | 2.92 | −0.22 | 70.32 | 0.28 | 2.43 | −0.48 | 1 |
| 31 | 139.190 598 | 45.812 244 | 0.0262 | 10.18 | 2.68 | 0.04 | 44.73 | 0.61 | 2.18 | −0.51 | 0 |
| 32 | 139.646 255 | 32.270 008 | 0.0269 | 10.29 | 2.93 | −0.12 | 53.68 | 0.67 | 1.98 | −0.44 | 2 |
| 33 | 141.539 307 | 49.310 204 | 0.0269 | 10.74 | 3.99 | −0.11 | 66.92 | 0.53 | 2.86 | −1.02 | 2 |
| 34 | 147.539 001 | 33.569 332 | 0.0270 | 10.61 | 4.40 | −0.13 | 50.40 | 0.68 | 2.81 | −1.14 | 0 |
| 35 | 149.420 227 | 45.258 678 | 0.0242 | 10.61 | 3.32 | −0.14 | 76.99 | 0.32 | 2.66 | −0.77 | 1 |
| 36 | 149.454 529 | 51.821 190 | 0.0249 | 10.34 | 2.77 | −0.14 | 46.80 | 0.67 | 1.97 | −0.48 | 2 |
| 37 | 153.797 638 | 56.672 085 | 0.0260 | 10.39 | 2.81 | −0.13 | 62.86 | 0.86 | 1.98 | −0.46 | 2 |
| 38 | 153.926 071 | 55.667 500 | 0.0244 | 10.75 | 3.52 | −0.18 | 57.91 | 0.71 | 2.12 | −0.86 | 2 |
| 39 | 162.530 365 | 36.341 831 | 0.0239 | 10.84 | 4.31 | −0.15 | 83.13 | 0.77 | 2.15 | −1.14 | 2 |
| 40 | 168.563 553 | 34.154 381 | 0.0272 | 10.36 | 2.83 | −0.15 | 44.02 | 0.78 | 1.98 | −0.48 | 2 |
| 41 | 197.879 166 | 46.341 774 | 0.0297 | 10.79 | 3.45 | −0.20 | 54.62 | 0.85 | 2.05 | −0.87 | 0 |
| 42 | 198.236 252 | 47.456 657 | 0.0281 | 10.80 | 3.72 | −0.13 | 65.32 | 0.52 | 2.69 | −1.00 | 2 |
| 43 | 203.374 603 | 40.529 671 | 0.0269 | 10.26 | 2.74 | −0.18 | 45.31 | 0.67 | 2.03 | −0.37 | 2 |
| 44 | 205.251 038 | 42.431 423 | 0.0279 | 10.78 | 3.34 | −0.16 | 61.53 | 0.63 | 2.20 | −0.85 | 2 |
| 45 | 222.988 846 | 51.264 881 | 0.0259 | 10.68 | 3.40 | −0.17 | 68.83 | 0.41 | 2.20 | −0.80 | 2 |
| 46 | 241.528 976 | 35.981 434 | 0.0305 | 10.68 | 3.68 | −0.20 | 58.79 | 0.44 | 2.45 | −0.87 | 0 |
| 47 | 244.382 523 | 31.194 477 | 0.0240 | 10.53 | 2.91 | −0.17 | 65.82 | 0.58 | 2.28 | −0.62 | 1 |
| 48 | 246.259 842 | 40.946 644 | 0.0287 | 10.75 | 3.69 | −0.13 | 56.45 | 0.52 | 2.38 | −0.93 | 0 |
| 49 | 258.650 208 | 30.733 536 | 0.0296 | 10.42 | 2.82 | −0.17 | 54.64 | 0.54 | 2.09 | −0.48 | 2 |
| 50 | 261.557 251 | 62.149 483 | 0.0278 | 10.87 | 4.27 | −0.11 | 82.39 | 0.27 | 2.57 | −1.10 | 1 |
Observations and data reduction
Our target galaxies were observed with the WSRT between 2011 December and 2012 June, with an on-source integration time of 12 h per galaxy. Part of the sample was observed in (non-guaranteed) backup time, resulting in the loss of one target. The correlator set-up was chosen to cover the H i line while at the same time covering a large portion of the bandpass to obtain sensitive continuum data. One band was reserved for the line observation using a total bandwidth of 10 MHz and 1024 channels with two parallel polarization products (corresponding to a minimum possible channel width of 2.06 km s−1), while seven remaining bands with 20 MHz each and 128 channels and two parallel polarization products were observed in parallel, centred around a frequency of 1.4 GHz. The telescope performance was variable, and some observations do not have all antennas operational. Some observations were affected by radio interference, including terrestrial radio-frequency interference (RFI). Most notably, observations performed during the day time were partly affected by solar interference on the shorter baselines. This resulted in a quite variable rms noise across our observations, as listed in Table 2. Exploitation of the continuum observations is the topic of a forthcoming paper. Here, we describe the reduction of the H i data.
H i derived data products: the galaxy ID, observational date, rms noise per channel (24.9 km s−2), beam size, H i mass, total H i image S/N > 2 threshold, R1, H i half-light radius, H i 90-per cent-light radius and averaged surface H i density within R25.
| ID | Date | Noise | Beam | |$\log M(\mathrm{H\,\small{I}})$| | |$\log M(\mathrm{H\,\small{I}})/M_*$| | Threshold (mom-0) | R1 | R50 | R90 | |$\mu _{\rm H\,{\small I},25}$| |
|---|---|---|---|---|---|---|---|---|---|---|
| (mJy beam−1) | (arcsec2) | (M⊙) | (1020 atoms cm−2) | (arcsec) | (arcsec) | (arcsec) | (M⊙ kpc−2) | |||
| 1 | 2012 Feb 24 | 0.28 | 26.9 × 17.0 | 10.09 | −0.34 | 0.44 | 64 | 32 | 57 | 6.59 |
| 2 | 2011 Dec 23 | 0.28 | 25.9 × 17.2 | 9.94 | −0.68 | 0.53 | 52 | 23 | 47 | 6.70 |
| 3 | 2012 Jan 09 | 0.29 | 25.8 × 17.2 | 9.89 | −0.53 | 0.49 | 45 | 21 | 40 | 6.76 |
| 4 | 2012 Jan 04 | 0.32 | 31.4 × 16.4 | 10.26 | −0.31 | 0.64 | 67 | 28 | 54 | 6.85 |
| 5 | 2011 Dec 20 | 0.31 | 27.2 × 17.5 | 10.20 | −0.12 | 0.39 | 80 | 40 | 75 | 6.80 |
| 6 | 2012 Jan 12 | 0.28 | 28.1 × 17.0 | 10.31 | −0.53 | 0.40 | 87 | 44 | 76 | 6.65 |
| 7 | 2012 Jan 13 | 0.29 | 25.5 × 17.3 | 10.00 | −0.37 | 0.53 | 41 | 26 | 86 | 6.63 |
| 8 | 2012 Jan 15 | 0.28 | 23.9 × 17.8 | 10.20 | −0.08 | 0.47 | 69 | 36 | 64 | 6.76 |
| 9 | 2012 Jan 20 | 0.32 | 22.5 × 15.1 | 9.91 | −0.85 | 0.60 | 45 | 20 | 38 | 6.70 |
| 10 | 2012 Jan 22 | 0.29 | 20.5 × 17.7 | 10.02 | −0.89 | 0.56 | 45 | 28 | 56 | 6.78 |
| 11 | 2012 May 10 | 0.29 | 21.9 × 16.3 | 9.71 | −0.93 | 0.51 | 40 | 21 | 36 | 6.67 |
| 12 | 2012 Mar 04 | 0.31 | 19.0 × 16.3 | 10.12 | −0.51 | 0.62 | 67 | 33 | 66 | 6.72 |
| 13 | 2012 Jan 16 | 0.29 | 28.7 × 17.0 | 10.23 | −0.61 | 0.45 | 64 | 34 | 80 | 6.69 |
| 14 | 2012 Feb 11 | 0.26 | 22.0 × 17.5 | 10.14 | −0.65 | 0.48 | 69 | 38 | 83 | 6.70 |
| 15 | 2012 Mar 10 | 0.29 | 29.2 × 16.9 | 10.39 | −0.43 | 0.41 | 119 | 60 | 110 | 6.73 |
| 16 | 2012 Mar 26 | 0.27 | 21.7 × 17.6 | 10.00 | −0.31 | 0.87 | 44 | 22 | 45 | 6.96 |
| 17 | 2012 Apr 18 | 0.35 | 21.3 × 18.5 | 10.34 | −0.35 | 0.65 | 96 | 57 | 98 | 6.67 |
| 18 | 2012 Apr 19 | 0.32 | 25.3 × 20.0 | 10.07 | −0.27 | 0.51 | 57 | 27 | 51 | 6.95 |
| 19 | 2012 Apr 10 | 0.41 | 25.5 × 16.0 | 10.17 | −0.08 | 0.60 | 65 | 36 | 70 | 6.81 |
| 20 | 2012 June 15 | 0.30 | 25.2 × 16.1 | 10.21 | 0.00 | 0.63 | 58 | 28 | 52 | 6.97 |
| 21 | 2012 Feb 20 | 0.32 | 26.7 × 16.5 | 9.88 | −0.53 | 0.42 | 49 | 31 | 54 | 6.50 |
| 22 | 2012 Apr 29 | 0.32 | 26.6 × 15.9 | 10.00 | −0.82 | 0.60 | 52 | 24 | 46 | 6.62 |
| 23 | 2012 May 13 | 0.36 | 23.5 × 15.0 | 9.94 | −0.81 | 0.56 | 48 | 23 | 39 | 6.61 |
| 24 | 2012 Jan 21 | 0.30 | 20.0 × 17.6 | 10.21 | −0.50 | 0.52 | 70 | 36 | 61 | 6.56 |
| 25 | 2012 Apr 22 | 0.28 | 20.0 × 17.0 | 9.76 | −0.78 | 0.46 | 40 | 21 | 40 | 6.69 |
| 26 | 2011 Dec 21 | 0.32 | 25.3 × 17.3 | 9.50 | −0.81 | 0.49 | 33 | 15 | 28 | 6.72 |
| 27 | 2011 Dec 11 | 0.32 | 28.5 × 16.0 | 9.27 | −1.03 | 0.31 | 24 | 14 | 25 | 6.46 |
| 28 | 2011 Dec 13 | 0.29 | 22.2 × 17.0 | 9.12 | −1.42 | 0.26 | 35 | 23 | 36 | 6.36 |
| 29 | 2012 Jan 27 | 0.27 | 21.9 × 18.3 | 10.37 | −0.15 | 0.55 | 75 | 45 | 103 | 6.83 |
| 30 | 2011 Dec 07 | 0.32 | 26.5 × 16.5 | 10.07 | −0.32 | 0.56 | 55 | 25 | 53 | 6.75 |
| 31 | 2012 Jan 27 | 0.27 | 23.5 × 17.7 | 10.06 | −0.12 | 0.34 | 46 | 33 | 163 | 6.96 |
| 32 | 2011 Dec 09 | 0.33 | 29.4 × 16.3 | 9.56 | −0.73 | 0.35 | 40 | 23 | 40 | 6.41 |
| 33 | 2012 Jan 31 | 0.27 | 22.6 × 17.9 | 9.20 | −1.54 | 0.09 | 29 | 17 | 29 | 6.17 |
| 34 | 2012 Feb 22 | 0.31 | 28.9 × 15.9 | 0.00 | – | – | – | – | – | −- |
| 35 | 2012 Feb 07 | 0.26 | 24.0 × 17.6 | 9.93 | −0.68 | 0.44 | 61 | 33 | 73 | 6.55 |
| 36 | 2011 Dec 25 | 0.28 | 21.2 × 17.5 | 9.39 | −0.95 | 0.44 | 29 | 16 | 28 | 6.65 |
| 37 | 2012 Jan 07 | 0.28 | 20.5 × 17.6 | 9.70 | −0.69 | 0.55 | 37 | 19 | 32 | 6.68 |
| 38 | 2012 Jan 10 | 0.27 | 20.3 × 17.9 | 8.75 | −2.00 | 0.12 | 18 | 15 | 26 | 5.90 |
| 39 | 2012 Mar 01 | 0.31 | 27.0 × 16.1 | 9.14 | −1.70 | 0.29 | 31 | 28 | 44 | 5.99 |
| 40 | 2012 Jan 06 | 0.29 | 29.4 × 17.0 | 9.65 | −0.71 | 0.39 | 38 | 24 | 46 | 6.55 |
| 41 | Not observed | – | – | – | – | – | – | – | – | −- |
| 42 | 2011 Dec 05 | 0.31 | 22.6 × 17.8 | 9.57 | −1.23 | 0.28 | 38 | 23 | 43 | 6.36 |
| 43 | 2011 Dec 17 | 0.29 | 25.8 × 17.1 | 9.59 | −0.67 | 0.31 | 38 | 22 | 39 | 6.58 |
| 44 | 2011 Dec 08 | 0.31 | 24.0 × 16.5 | 9.28 | −1.50 | 0.21 | 27 | 16 | 25 | 6.30 |
| 45 | 2011 Dec 26 | 0.29 | 21.3 × 17.2 | 9.61 | −1.07 | 0.32 | 36 | 19 | 34 | 6.54 |
| 46 | 2012 Mar 11 | 0.31 | 28.1 × 16.7 | 10.11 | −0.57 | 0.56 | 43 | 29 | 74 | 6.74 |
| 47 | 2012 Mar 03 | 0.32 | 29.7 × 15.3 | 10.01 | −0.52 | 0.39 | 66 | 41 | 75 | 6.60 |
| 48 | 2012 Mar 04 | 0.37 | 25.3 × 16.1 | 8.25 | −2.50 | 0.44 | 13 | 15 | 25 | 5.85 |
| 49 | 2011 Dec 10 | 0.31 | 31.9 × 16.8 | 9.74 | −0.68 | 0.40 | 42 | 23 | 41 | 6.48 |
| 50 | 2012 Mar 01 | 0.28 | 19.6 × 16.9 | 9.80 | −1.07 | 0.60 | 45 | 20 | 37 | 6.50 |
The WSRT H i data were reduced using a pipeline originally developed by Serra et al. (2012), which is based on the miriad reduction package (Sault, Teuben & Wright 1995). The pipeline automates the basic standard data reduction steps from the H i raw data sets as delivered by the WSRT to the final data cubes used for this work.
After reading and converting the UVFITS data into miriad format, the system temperature as tracked by the WSRT is used to perform a relative amplitude calibration, the data are Hanning smoothed and then flagged to exclude radio interference using a set of clipping algorithms. The absolute bandpass calibration and a continuum calibration is performed by applying a calibration on standard calibration sources, which are observed before and after the target observation. The resulting complex bandpass and continuum gain solutions are then copied to the target data set.
The continuum phase calibration is adjusted by means of a self-calibration process using the target data themselves. The averaged continuum data are inverted (employing uniform weighting) and cleaned using a clean mask in an iterative process, in which the threshold level to determine the clean mask and the clean cutoff level are decreased until convergence is reached (the mask threshold reaches 5 σrms and the clean cutoff reaches 1 σrms). At the same time, the clean components are used to adjust the phase calibration of the visibilities by performing several self-calibration steps.
The final self-calibration solution is then copied to the line data and a continuum subtraction is performed on the visibilities by subtracting the visibilities corresponding to the brightest sources in the field (as determined in the selfcal loop) and then performing a polynomial continuum subtraction of first or second order (the order being increased from first to second order if the data inspection indicates the need to increase the fitting order). After this step, the line data are averaged, Hanning smoothed, and inverted using several weighting schemes, to then be iteratively cleaned, again successively decreasing the clean mask threshold and the clean cutoff parameter. Other than for the continuum data, the clean regions were determined using smoothed data cubes, accounting for the fact that the H i line emission is mostly extended.
We produced data cubes using five different weighting schemes: (a) robust weighting (Briggs 1995) of 0, 0.4, and 6 without tapering, (b) robust weighting of 0 and 6 and an additional 30 arcsec tapering (i.e. uv data are multiplied with a Gaussian tapering function equivalent to a convolution with a symmetric Gaussian of HPBW of |$30\,\text{arcsec}$| in the image domain). All cubes have velocity resolution of 24.8 km s−1 after Hanning smoothing. The quantitative analysis of the H i properties in this paper (e.g. mass, morphology) was made using the cubes built with a robust weighting of 0.4 and no tapering. This was the most suitable compromise between sensitivity and resolution. The angular resolution of the cubes is ∼15–20 × 15–20/sin (δ) arcsec2, where δ is the declination. The noise ranges between 0.26 and 0.42 mJy beam−1 and the median value is 0.3 mJy beam−1 (90 per cent of the cubes have noise below 0.34 mJy beam−1). If the resulting data cubes are used without further smoothing, the 5σ column density threshold within one velocity resolution element is 8 − 14 × 1019 × sin (δ) cm−2.
We look for H i emission in the cubes using the source finder developed by Serra et al. (2012). The finder is based on a smooth-and-clip algorithm, with additional size-filtering to reject noise peaks. We refer to Serra et al. (2012), for a more complete description of the finder. In this work, we use a set of Gaussian convolution kernels with full width at half-maximum (FWHM) of 0, 48, 96, 144 and 192 arcsec in the spatial domain combined with a set of convolution kernels with FWHM of 24.7, 49.5, 98.9, 197.9, 395.7 km s−1 in the velocity domain, using a clip level of 4σrms. The output of the finder is a binary mask where pixels containing emission are set to 1 and pixels with no emission are set to 0.
Moment-0 images and error estimation
In this section, we describe how we extract two-dimensional maps of the overall gas distribution (moment-0 maps) for each of our targeted galaxies. We work with the masked H i cubes, i.e. cubes for which pixels where no H i emission is detected are set to 0. The value of a given pixel P1 in the two-dimensional H i map is calculated as the sum over velocity channels that contain detected H i flux.
To calculate the error on the calculated flux for pixel P1, we define a set of ‘sky pixels’ where the mask values are 0 over the same range of channels that contribute to the flux calculated for pixel P1. We sum over the channels to produce a distribution function of ‘sky flux values’ from these empty regions. The negative part of this distribution is very well fit by a Gaussian function (Fig. 1) and can be used to estimate the error on the flux in P1. From the width of the Gaussian, we calculate σ, the error on pixel P1. We repeat the above process for all non-zero pixels in the total H i image and the end product of this process is the error image.
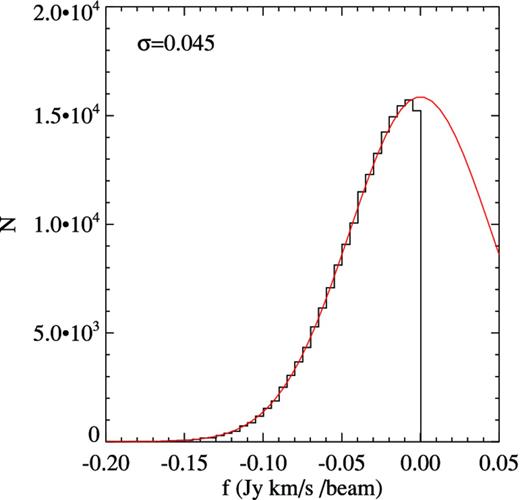
An example of the distribution of the negative pixels used to estimate the error on the flux at a given sky position. The red line shows the best-fitting Gaussian function and the width σ is denoted in the top-left corner.
We make contour maps from the total H i image with a smoothing width of 3 pixels. We truncate the image at the contour where the median S/N of the pixels along the contour reaches 2. This corresponds to a median threshold of 0.46 × 10²⁰ atoms cm−2; all of the images reach below column densities of 0.7 × 10²⁰ atoms cm−2 except galaxy 16 which reaches a column of 0.87 × 10²⁰ atoms cm−2 (Table 2).
In Fig. 2, we show how the H i mass of the Bluedisk galaxies varies as a function of the column density limit if all H i emission below the limit is excluded. The ‘true’ total H i mass is defined from summing flux from all pixels set to 1 in the mask created by the source finder. We can see that at least 97 per cent of the total H i mass is included within our adopted S/N > 2 contour level threshold. We note that the morphological analysis in the following sections is applied to pixels in the 2D map that lie above this threshold. Table 2 lists the total H i mass as well as the S/N > 2 column density threshold for all the galaxies in our sample.
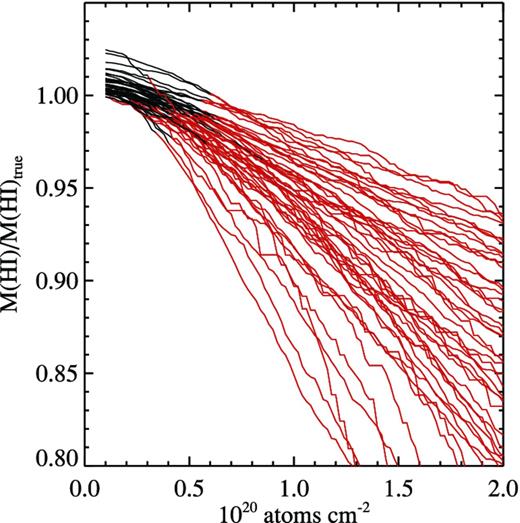
The fraction of ‘true’ H i mass of the Bluedisk galaxies detected above a given column density limit as a function of the column density limit. The red parts of the lines are where the column density limits are above our adopted S/N > 2 threshold (see Section 2.3).
Predicted and observed H i mass fractions
Our sample consists of 25 ‘H i-rich’ galaxies and 25 ‘control’ galaxies selected using the H i mass fraction predicted using UV/optical photometry. Some of the discs turn out to be very extended and to overlap (both spatially and in velocity) with one or more neighbouring galaxies identified in the SDSS and GALEX images (for example galaxy 7). If rneighbour < rtarget + 3 mag, the galaxy is flagged as a ‘multisource’ system; these include galaxies 7, 13, 29, 31 and 46 (see Fig. A3 is the Appendix).
In the top-left panel of Fig. 3, we compare the H i mass fraction predicted by our UV/optical photometry-based estimator with the actual H i mass fraction measured using our data. The galaxies predicted to be gas-rich are plotted as black dots and the control galaxies are plotted as orange dots. The multisource systems are plotted as diamonds. As can be seen, the estimator works very well for the ‘H i-rich’ galaxies – there is a scatter of only 0.15 dex between the predicted and observed values of |$\log M(\mathrm{H\,\small{I}})/M_*$|. The estimator works considerably less well for the ‘control’ sample. The observed H i mass fraction is generally lower than the predicted one. In fact all galaxies with predicted H i mass fractions |$\log M(\mathrm{H\,\small{I}})/M_* < -0.85$| lie systematically below the predicted value, with the difference reaching more than a factor of 10 in two extreme cases. In the top-right panel, the observed H i mass fractions are plotted as a function of the stellar mass of the galaxy. We see that all the strongly outlying points (those with |$\log M(\mathrm{H\,\small{I}})/M_* < -1.5$| in the top-left panel) are galaxies with high stellar masses.
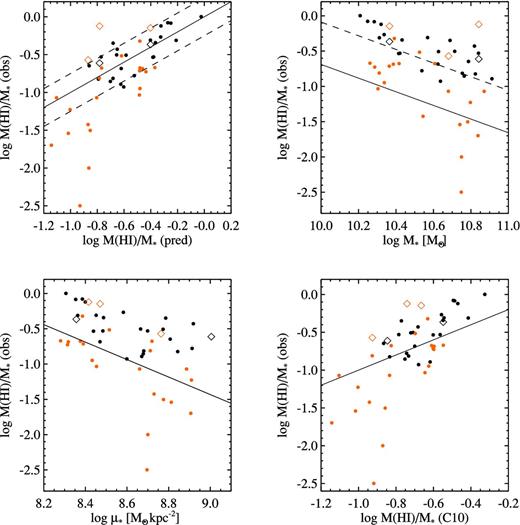
Relation between the observed H i mass fraction and predicted H i mass fraction, stellar mass, mass surface density and C10 H i mass fraction. The black symbols are the ‘H i-rich’ galaxies, the orange symbols are the ‘control’ galaxies and the diamonds mark the ‘multisource’ systems. In the top-left panel, the solid line is the y = x line and the dashed lines are vertically 0.25 dex away from the y = x line. In the top-right panel, the solid line shows the median relation between H i mass fraction and stellar mass found by C10, and the dashed line is vertically 0.6 dex above the solid line. In the bottom-left panel, the solid line shows the median relation between H i mass fraction and mass surface density found by C10. In the bottom-right panel, the solid line is the y = x line.
Although the scatter in H i mass fraction in the control sample is larger than envisaged, the control sample is systematically gas-poor compared to the H i-rich sample at fixed stellar mass and at fixed stellar surface mass density. The solid lines in the top-right and bottom-left panels show the median relation between H i mass fraction and stellar mass and stellar surface density from C10. Consistent with their definition, the H i-rich galaxies lie ∼0.6 dex above these relations on average, while the control galaxies lie much closer to the median. Finally, the bottom-right panel compared the observed H i mass fraction to that predicted by the ‘plane’ relating H i mass fraction with the stellar surface mass density μ* and NUV−r colour discussed in C10. As can be seen, most of the ‘H i-rich’ galaxies lie above the plane, demonstrating that our criterion of requiring a galaxy to have an unusually blue outer disc has selected unusually H i-rich galaxies by this metric as well. The majority of galaxies in the control sample lie below the plane.
Finally, we note that two of the ‘multisource’ systems fall in the ‘H i-rich’ category and for these, the H i fractions are consistent with predictions. However, three control galaxies are also multisource systems and all of these have observed H i mass fractions that are larger than the predictions by 0.3–0.5 dex.
SAMPLE DEFINITIONS AND VISUAL INSPECTION OF THE H I INTENSITY MAPS
Since this paper deals with H i sizes and morphologies, we will exclude the multisource systems from the analysis. In addition, galaxy 48 has a very complicated offset H i cloud that is kinematically connected only on one side of the galaxy (see gallery in the Appendix), and is also excluded from the current study. No observations exist for galaxy 41; galaxy 34 is not detected in H i (we have confirmed this non-detection using the Arecibo telescope). In total, we are left with a sample of 42 galaxies, which we separate into two parts according to whether they lie above or below the H i plane defined in C10. Hereafter, the galaxies which have |$\Delta f(\mathrm{H\,\small{I}})>0$| are referred to as H i-rich galaxies and the rest of the sample are referred as control galaxies. This definition is different to that adopted when we designed the observational sample, but it now properly reflects the actual measured H i content of each system. In summary, our sample consists of 23 H i-rich galaxies and 19 control galaxies.
An atlas containing H i contour maps overlaid with the optical images is presented in the Appendix. The outermost contour corresponds to the S/N = 2 threshold column density (see Section 2.3). The H i-rich galaxy sample is shown in Fig. A1, while the control sample is shown in Fig. A2. Comparison of the two figures shows that the H i-rich galaxies tend to have H i discs that are very extended compared to their optical discs. Most of the H i-rich galaxies have low column density outer contours that are irregular. In some cases, the H i appears to be very clumpy (galaxies 15, 17, 20, 47), but there are also H i-rich galaxies with smooth and symmetric H i discs (galaxies 1, 6, 22, 26). In contrast, the control galaxies have much smaller H i discs; the H i discs of some of the control galaxies (galaxies 33, 38, 39 and 44) even end within the optical disc. The smallest H i discs also tend to be misaligned with respect to the optical discs. Galaxies 38, 39 and 42 have highly asymmetric H i distributions. The outer contours of the H i discs of most of the control galaxies are smooth compared to the H i-rich galaxies, but there are also clearly disturbed systems (galaxies 9, 10, 39 and 42).
In the next section, we will attempt to put these ‘visual impressions’ on more quantitative footing.
QUANTITATIVE ANALYSIS OF THE H I IMAGES
All the H i parameters studied in the following sections are measured using the high-resolution H i total intensity maps. The typical beam has a major axis of 22 arcsec and a minor axis of 16 arcsec (∼12.0 and 8.5 kpc).
Size measurements
We quantify the size of the H i discs using three different measures: R50(H i), R90(H i) and R1. R50(H i) is the radius enclosing half of the total H i flux, R90(H i) is the radius enclosing 90 per cent of the H i flux. R1 is the radius where the face-on corrected angular averaged H i column density reaches 1 M⊙ pc−2 (corresponding to 1.25 × 10²⁰ atoms cm−2). Column densities are measured along elliptical rings, with the position angle (PA) and ellipticity determined from the r-band image, and are corrected to be face-on by scaling the column density in each pixel by cos θ ∼ b/a, where b/a is the axis ratio of the galaxy measured in the r band, and θ is the corresponding inclination angle. We note that there could be differences between the inclination of the optical and the H i discs, but visual inspection shows that the differences are usually small. In future work, we will fit tilted-disc models to the velocity fields in order to derive the inclination of the H i disc.
One might worry that H i-sizes of Bluedisk galaxies will be overestimated with respect to their optical sizes, because of resolution effects. In order to quantify this for our Bluedisk sample, we have transformed the images of nearby, large angular size galaxies by placing them at the same redshift as the Bluedisk galaxies and convolving them with the WSRT beam. We selected 51 galaxies from the Westerbork observations of neutral Hydrogen in Irregular and SPiral galaxies survey (WHISP; van der Hulst, van Albada & Sancisi 2001; Swaters et al. 2002) with optical images available from the SDSS and with stellar masses above 109.8 M⊙. The WHISP galaxies have a median distance of z ∼ 0.008 and a median apparent size of 2.3 arcmin. We make use of the full resolution total intensity maps, which were obtained with a typical beam of 16 × 10 arcsec2. Since the H i disc sizes are much larger than the beam size, the sizes measured from the original WHISP maps can be viewed as intrinsic sizes. Then the WHISP galaxies are shifted to the median redshift of the Bluedisk galaxies (0.026) by rebinning the pixels, and convolved with a Gaussian kernel so that they end up with a point spread function (PSF) of 22 × 16 arcsec2. We measure the apparent sizes R50, R90 and R1 from the shifted WHISP galaxies [size(shift)], and compare them with the apparent sizes that are expected at the redshift of 0.026 from the intrinsic values measured from the original WHISP images [size(expected)]. We can see from (the black dots in) Fig. 4 that size(shift) correlates tightly with size(expected), and that for most galaxies, size(shift) is larger than size(expected) by <0.1 dex. At the smaller size end where R90 < 101.4 arcsec or R50 < 101.2 arcsec, the overestimation can be as large as 0.2 dex, but almost all the Bluedisk galaxies have an apparent size larger than that. We thus conclude that we can robustly measure the sizes R50, R90 and R1 from the Bluedisk total intensity maps.
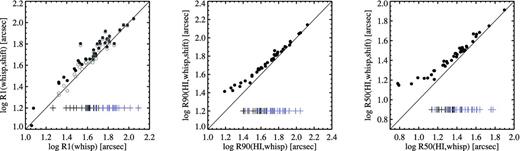
WHISP galaxies are shifted and convolved with the WSRT beam to have similar appearance to the Bluedisk galaxies. R(shift) are the sizes measured from the shifted and convolved images, and R(expected) are the intrinsic sizes expected at the redshifts of the Bluedisk galaxies. The crosses show the sizes of the Bluedisk galaxies. The grey circles in the left-hand panel show the resolution corrected R(shift).
Morphology measurements
CAS parameters
Gini, M20 and A are traditional morphological parameters based on the concentration–asymmetry–smoothness (CAS) system (Conselice 2003; Lotz, Primack & Madau 2004), which have been widely applied in optical studies of galaxies. Gini is defined as the mean of the absolute difference between the values of all pixels (the final value of Gini is normalized by the mean of values over all pixels). M20 is defined as the normalized second-order moment of the pixels that contribute to the brightest 20 per cent of the total flux of the galaxy. A is defined as the difference between a given image and the image rotated by 180° about the object centre (the centre is determined by minimizing A, and the final value of A is normalized by the total flux of the galaxy).
The Gini parameter measures the concentration and smoothness of the light, M20 measures the central concentration of the light and A measures the central asymmetry. Individually, or in combination, these parameters have been demonstrated to be effective in detecting signatures of galactic mergers or interactions.
In this paper, we measure Gini, M20 and A using the H i total intensity maps. Most of the calculation steps are similar to Lotz et al. (2004), with the following adaptations: (1) we use a lower limit of 0.7 × 10²⁰ atoms cm−2 to select the pixels used in the calculation. As described in the previous section, 0.7 × 10²⁰ atoms cm−2 is a safe lower limit for all the images with a robust weighting of 0.4 and no tapering; (2) we do not apply a background correction to A (while the optical analysis does) because the background noise is a channel-dependent term. We note that the optical criteria used to identify interactions/mergers will not be directly applicable here. Our intention is to carry out a relative comparison between H i-rich Bluedisk galaxies and the control sample.
Morphological parameters that are sensitive to lower column-density gas
Gini, M20 and A are mainly sensitive to the regions of the galaxies containing high column-density gas, and thus may not be sensitive diagnostics of recent accretion events. We quantify the irregularity of the low column-density outer discs by defining three new parameters: ΔCentre, ΔPA and ΔArea, which are all measured from the 0.7 × 10²⁰ surface density contour of the H i maps. For each galaxy, we fit an ellipse to the 0.7 × 10²⁰ contour by using the uniformly weighted second-order moment of the pixel positions inside the contour (see the left-top panel of Fig. 5).
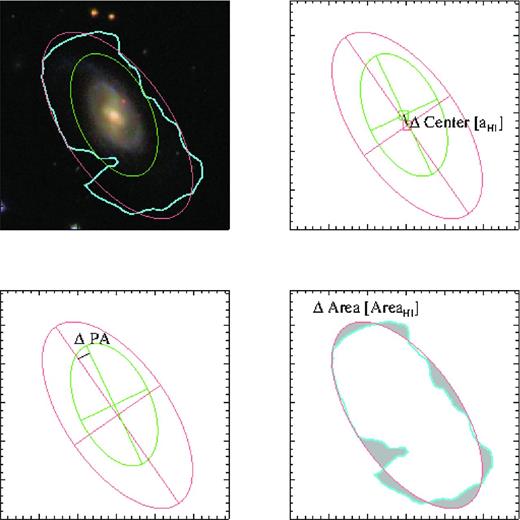
An illustration of how ΔCentre, ΔPA and ΔArea are measured for one galaxy. The left-top panel displays the optical image overlaid with the 0.7 × 10²⁰ atoms cm−2 H i contour (cyan line). The pink ellipse is the best-fitting ellipse for the region enclosed by the cyan contour and the green ellipse indicates the ellipse-fit to the r-band image from which we measure the centre, PA and ellipticity of the optical disc. The top-right panel illustrates how ΔCentre is measured as the distance between the centres of the pink and the green ellipses, normalized by the semi-major axis of the pink ellipse. The bottom-left panels shows how ΔPA is measured as the difference between the major axis orientations of the pink and green ellipses. The bottom-right panels show how ΔArea is measured as the area of the grey regions, normalized by the area enclosed by the cyan line.
Optical centres, PA and ellipticities are measured from the SDSS r-band images using SExtractor1, using the standard method of measuring the flux weighted second-order moments of the spatial distribution of the flux (Bertin & Arnouts 1996). Our new morphological parameters are defined as follows.
ΔCentre is calculated as the distance between the centre of the H i ellipse and the centre of the r-band ellipse, normalized by the semimajor axis of the H i ellipse (see the right-top panel of Fig. 5).
ΔPA is calculated as the difference between the PA of the H i ellipse and the PA of the r-band ellipse (see the left-bottom panel of Fig. 5). The PA of face-on discs cannot be accurately estimated from images alone, so galaxies which have the minor-to-major axis ratio larger than 0.85 either in the optical or in the H i are excluded. This affects two galaxies from the H i rich sample and two galaxies from the control sample.
ΔArea is calculated as the difference in area enclosed by the 0.7 × 10²⁰ H i contour and the best-fitting ellipse, normalized by the total area inside the contour (see the right-bottom panel of Fig. 5).
ΔPA and ΔCentre both measure the misalignment of the H i disc with respect to the stellar disc. The misalignment could be due to clumpiness in the H i distribution. When the H i disc is more extended than the optical disc, the misalignment is very likely to be caused by a warp (Józsa 2007). Specifically, a significant ΔCentre would be indicative of an asymmetric warp, and a large ΔPA would be indicative of a symmetric, S-shaped warp. There have been studies showing that large H i warps are more frequently found in galaxies in rich environments (García-Ruiz, Sancisi & Kuijken 2002).
Finally, ΔArea measures the distortion of the outermost part of a disc from a symmetric elliptical shape, i.e. the clumpiness of the outer H i disc.
Error estimation for size and morphological measurements
We estimate the errors on the H i size/morphological parameters by means of Monte Carlo simulations. We construct a set of ‘perturbed’ cubes and then calculate the variation of the size/morphological parameters. The rms value of the noise for each cube is listed in Table 2, but we must take into account the fact that the pixels in the data cube are not independent. We simulate the noise by assuming that it has a Gaussian distribution with |$\sigma _{\rm \text{G}auss}$| approximately equal to the rms of the data cube. We construct 200 noise cubes and then convolve them with the WSRT beam in the spatial domain and a Gaussian with FWHM of 2.2 pixels in the velocity domain.2 We create 200 ‘perturbed’ data cubes by adding each noise cube to the real data cube. So the perturbed data cube has a noise that is |${\sim} \sqrt{2}$| times the noise in the actual data cube. We then project the 200 ‘perturbed’ data cubes to form 200 H i images, using the same masks as for the original data cube.3 We measure sizes and morphological parameters for these 200 perturbed H i images. We find that the mean of the 200 measurements does not vary much (smaller than the errors shown below) from the parameters measured from true data cubes, suggesting no significant systematical effect caused by noise. The standard deviation around the mean is adopted as the error on each parameter. The perturbed data cube has a larger noise than the actual data cube, so the estimated error can be viewed as a lower limit of the true error. This is confirmed by enlarging the noise in the noise cube, and we find that the errors of parameters increase nearly linearly with the noise of the perturbed cube.
The Bluedisk galaxies have typical 1 σ error of 0.24 arcsec in R50, 0.55 arcsec in R90, 0.86 arcsec in R1, 0.042 in M20, 0.007 in Gini, 0.017 in A, 0.013 in ΔArea, 1.4 deg in ΔPA and 0.006 in ΔCentre.
RESULTS
The H i mass–size relation
It is well known that there is a tight correlation between D1, the diameter of the H i disc, and the total mass in atomic gas |$(M(\mathrm{H\,\small{I}}))$| in the galaxy. The relation changes very little from normal spiral galaxies (Broeils & Rhee 1997), cluster spiral galaxies (Verheijen & Sancisi 2001), late-type dwarf galaxies (Swaters et al. 2002) to early-type disc galaxies (Noordermeer et al. 2005).
In the left-hand panel of Fig. 6, the solid line shows the best-fitting relation between D1 and |$M(\mathrm{H\,\small{I}})$| from Broeils & Rhee (1997), and the resolution corrected D1 (see Section 4.1) of our Bluedisk galaxies are plotted on top. Both the H i-rich and control galaxies in our sample lie exactly on the same D1–|$M(\mathrm{H\,\small{I}})$| relation as normal spiral galaxies, though offset to higher H i mass and larger H i size compared to the control sample. We note that five out of the six galaxies with the lowest values of |$M(H\,\small{I})$| lie far below the C10 H i plane |$(\Delta f(\mathrm{H\,\small{I}})<-0.48)$|. The only exception, galaxy 27, has an H i distribution that is strongly off-centre compared to the optical disc (see Section 3).
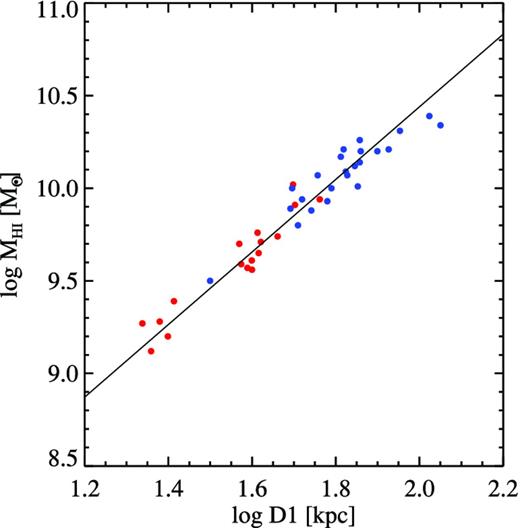
The |$M(\mathrm{H\,\small{I}})$|–D1 relation. The values of D1 are corrected for resolution (see Section 4.1). The solid line is from Broeils & Rhee (1997). The blue dots are the H i rich galaxies and the red dots are the control galaxies. The typical 1σ error for D1 is 0.86 arcsec (Section 4.3).
In Fig. 7, we plot the ratio of H i and optical sizes (R1/R25) as a function of the stellar mass of the galaxy, stellar surface mass density and concentration index of the r-band light. We can see that R1/R25 does not correlate with stellar concentration, which is related to the bulge-to-disc ratio of the galaxy. R1/R25 is only weakly correlated with stellar mass and mass surface density. At fixed stellar mass, surface density and concentration, the H i rich galaxies have larger R1/R25 than the control galaxies. The difference is about 0.2 dex in log(R1/R25) on average.

The relation between the size ratio R1/R25 and stellar mass (M*), stellar mass surface density (μ*) and concentration (R90/R50). The blue dots are the H i rich galaxies and the red dots are the control galaxies. The correlation coefficients for the whole sample are indicated at the top of each panel. The typical 1σ error bar for R1/R25 is plotted at the corner of the first panel.
Comparison of disc structure in H i, UV and optical
In this section, we compare structural parameters derived for the H i distribution, including size, concentration, surface density and asymmetry index with those derived from the UV and optical light. As we progress to longer wavelengths, we investigate the structure of progressively older stellar populations. The goal of this exercise is to investigate the degree to which the structure of the H i is correlated with the structure of the old stars.
We compare the size R90(H i) with R90 measured from the NUV, g-, i- and z-band images in the top row of Fig. 8. In the top-left panel, we see that R90(H i) correlates well with R90(NUV), with a correlation coefficient of ∼0.7. The H i-rich galaxies are offset from the control galaxies both in H i size and in UV size. In the next three panels, we see that the correlation between R90(H i) and R90(optical) becomes progressively worse towards longer wavelengths and H i-rich galaxies are no longer significantly offset along the x-axis. The second row of the figure repeats the same progression for the concentration index R90/R50. The correlation between H i concentration and UV/optical concentration is significantly weaker than that for size. The progression from the UV to the z-band in terms of the strength of the correlations is not seen.
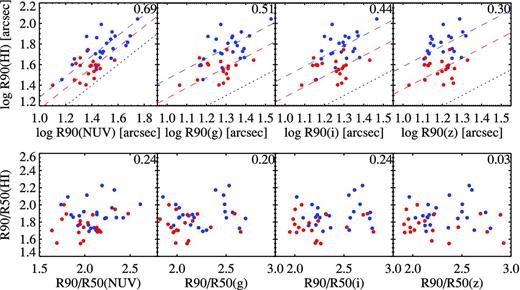
Correlations between H i, NUV, g-, i- and z-band sizes. The blue dots are the H i-rich galaxies and the red dots are the control sample. The dotted line is the x = y line and the dashed lines indicate the median ratio of H i-to-optical/NUV size. The numbers on the top-right corners of each panel are the correlation coefficients for the whole sample. The typical 1σ error bars for R90(H i) and R90/R50(H i) are 0.005 dex and 0.003.
The top row of Fig. 9 shows how the average H i surface density within R25 are correlated with average UV surface density, SFR surface density and stellar surface mass density. The right-hand panel shows that there is an overall anticorrelation between |$\mu _{\rm H\,{\small{I}}}$| and stellar mass surface density. There is a suggestion of a ‘break’ in the relation between |$\mu _{\rm H\,{\small{I}}}$| and μ* at log μ* ∼ 8.6, but the sample size is too small to confirm this for sure. We note that log μ* ∼ 8.6 corresponds to the stellar surface mass density where C10, Saintonge et al. (2011) and Kauffmann et al. (2012) identified a sharp transition to a population of ‘quenched’ galaxies. Below this surface mass density threshold, the H i and stellar surface densities do not appear to correlate with each other. Above this threshold, there is an apparent anticorrelation. We caution, however, that the stellar surface density includes the contribution of both the bulge and the disc in this regime.
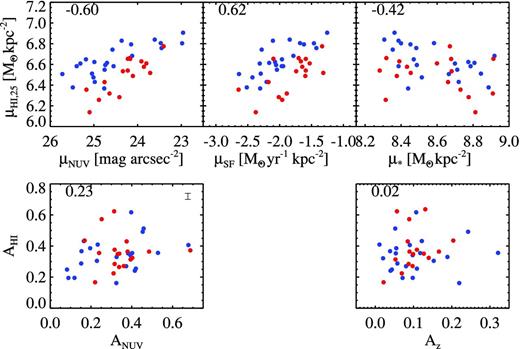
Comparison of the surface density and asymmetry between H i, NUV (left-hand panel), star formation (middle panel) and optical z band/stellar mass (right-hand panel). The H i surface density here is measured as the averaged surface density within the optical R25. The blue dots are the H i rich galaxies and the black dots are the control galaxies. The numbers on the left-top corner is the correlation coefficient for the whole Bluedisk sample. The typical 1σ error bar for |$A(\mathrm{H\,\small{I}})$| is plotted at the corner of the left-bottom panel.
|$\mu _{\rm H\,{\small{I}}}$| correlates with both |$\mu _{\text{NUV}}$| and |$\mu _{\text{SF}}$|. Interestingly, the H i-rich galaxies have similar SFR surface density as the control sample.
In the bottom panels, we look at the correlations between the H i asymmetry index A and the asymmetry index measured from the GALEX UV images and the SDSS z-band images. The correlation index hints at a potential correlation between A|$_{\rm H\,{\small{I}}}$| and A|$_{\text{NUV}}$|, though this is difficult to substantiate in our data. A|$_{\rm H\,{\small{I}}}$| is not correlated with Az.
In summary, therefore, H i-rich galaxies lie on the same scaling relation between H i disc size and H i mass found for normal spirals. However, they are significantly displaced with respect to the control sample in relations that link optical and H i quantities. At fixed stellar mass, optical concentration index, stellar surface density and SFR surface density, H i-rich galaxies have significantly more extended H i discs than the control galaxies. The size of the H i disc only correlate with that of the optical disc for galaxies with stellar surface mass densities less than ∼3 × 10⁸ M⊙ kpc−2. The radial extent of the UV light is found to be the best proxy for the radial extent of the H i disc. Other structural properties derived from the UV images, such as concentration and asymmetry, correlate only weakly with those derived from the H i maps.
Analysis of morphological parameters
Fig. 10 presents distributions of the six morphological parameters discussed in Section 4. The blue histograms show results for the H i-rich galaxies, while the red histograms show results for the control sample. The Kolmogorov–Smirnov (KS) test probability that the blue and red histograms are drawn from the same underlying distribution is indicated in the top-right corner of each panel.

Histograms showing the distributions of six different morphological parameters. H i-rich galaxies are shown in blue and control galaxies in red. KS test probabilities that the red and blue histograms are drawn from the same underlying distribution are indicated in each panel. The typical 1σ error bars for the morphological parameters are also plotted in the top-right corners.
We see that H i-rich galaxies do not differ from the control sample in their distribution of H i asymmetry or concentration indices. There is no evidence that the PA of the H i disc is more offset with respect to the optical disc for the H i-rich sample.
The morphological parameters that differs most significantly between the H i-rich and control samples is the Gini coefficient. The median value of Gini is offset to significantly higher values in the H i-rich sample, indicating that the H i distribution is more clumpy. There is also a significant difference between ΔCentre for the two samples. The control sample exhibits a tail of galaxies where the centre of the H i distribution and the centre of the optical light distribution are significantly offset from each other. This tail is missing in the H i-rich sample, and corresponds to the small H i discs (see Section 3). If we only compare the distributions when ΔCentre < 0.15, the KS test probability for similarity between the two samples is still 0.03. Finally, there is weak evidence from differences in the ΔArea histograms, that H i-rich galaxies may have more irregular outer contours on average than the control galaxies.
In Fig. 11, we show a variety of scatter-plots of one morphological quantity as a function of another one. The panel that shows the most striking separation between H i-rich galaxies and the control sample is the middle-left one where Δ(Centre) is plotted as a function of Gini coefficient. The segregation of the H i-rich population to a very narrow region of parameter space enclosing high Gini and low Δ Centre values is very striking. The H i-rich galaxies have a median ΔCentre of 0.032 with a scatter of 0.030, while the control galaxies have a median ΔCentre of 0.072, with a scatter of 0.11 The H i-rich galaxies are also more frequently scattered to larger values of ΔArea at a fixed asymmetry than the control galaxies. We conclude that gas-rich galaxies have extended and clumpy discs, which are positioned almost exactly on the centre-of-stellar mass of the system.
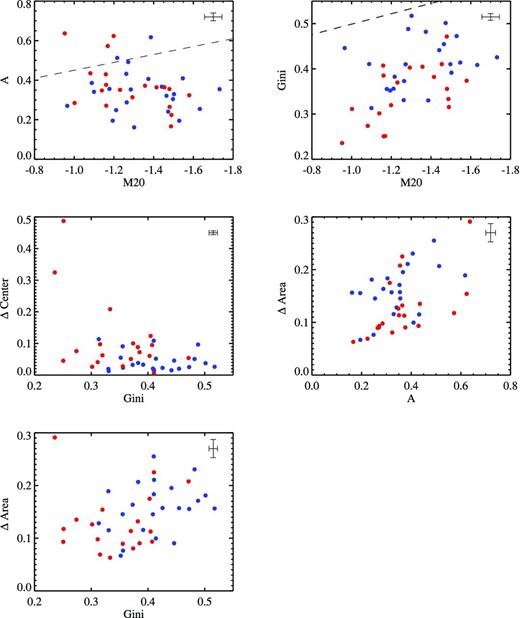
Scatter plots showing H i-rich (blue) and control (red) galaxies in two-dimensional morphological parameter spaces. The dashed line is taken from Holwerda et al. (2011c); most of the prominently interacting galaxies in the WHISP sample lie above this line. The typical 1σ error bars for the morphological parameters are plotted in the top-right corners.
In contrast, the top-right panel shows that H i-rich and control galaxies do not segregate at all the plane of Gini versus M20. This is the diagram traditionally used by optical astronomers to identify galaxies that are interacting with a companion (Lotz et al. 2004). To assess whether the H i-rich galaxies have large value of Gini because of clumpy light distribution or high central concentration), we measure M20 and Gini for both H i-rich and control samples within 3 × R25, 2 × R25 and R25. The KS test probabilities for the two samples to have the same M20 from these three measurements are 0.29, 0.92 and 0.42, and the KS test probabilities for Gini are 0.02, 0.13 and 0.1. Within 2 × R25, the H i-rich and control galaxies have the same central concentration (M20), but very different Gini. The light between R25 and 2 × R25 shows the most striking difference between the H i-rich and control galaxies.
In a series of papers, Holwerda et al. (2001a,b,c,d) applied the CAS morphological parameter system to H i maps of nearby galaxies. In particular, he investigated whether these parameters could distinguish galaxies that were visually identified as actively interacting in H i images. The combination of asymmetry and M20 was found to be an efficient diagnostic of mergers. One advantage of applying the analysis to H i rather than optical images, is that a major merger event is predicted from simulations to be visible for a longer time-scale Holwerda et al. (2011c). The criterion that Holwerda et al. adopted to identify interacting H i discs in the Asymmetry versus M20 plane is plotted in the top-left panel of Fig. 11 as a dashed line; galaxies above the line are identified as interacting. Two H i-rich galaxies and three control galaxies meet that criteria (galaxies 15, 17, 38, 39 and 42), which is comparable to the interaction fraction of 13 per cent in the WHISP sample calculated by Holwerda et al. (2011d).
SUMMARY AND DISCUSSION
This paper presents the sample selection, observational set-up, data reduction strategy and a first comparison of the sizes and structural properties of the atomic gas discs for a sample of 25 unusually H i-rich galaxies and a control sample matched in stellar mass, stellar mass surface density, inclination and redshift.
Our main results may be summarized as follows.
H i-rich galaxies lie on a direct extrapolation of the H i mass versus H i size relation exhibited by normal spirals, extending it H i masses of ∼2 × 10¹⁰ M⊙ and radii of ∼100 kpc. The scatter about this relation for the H i-rich and control samples is about the same.
H i-rich galaxies have H i-to-optical size ratios that are displaced to significantly larger values at fixed stellar mass, concentration index, stellar surface mass density and SFR surface mass density.
The sizes and structural parameters of H i discs correlate very weakly with those of the optical disc, particularly for galaxies with high stellar surface mass densities. The tightest correlations are found at ultraviolet wavelengths. between H i sizes/surface mass densities an UV sizes/surface brightnesses. This is true both for the H i-rich and the control samples.
Of the six morphological parameters investigated in this paper, the Gini coefficient proved to be the best discriminator of the H i-rich population.
In H i-rich galaxies, the centre of the H i disc tends to correspond more closely with the centre of the optical disc than in the control sample.
There is no evidence that the atomic gas discs of H i-rich galaxies are more asymmetric than in the control sample, though the outermost regions tend to be more irregular.
One of the key goals of the Bluedisk project was to study the morphological and dynamical evidence of recent gas accretion for galaxies with excess H i gas. Our results argue against a picture where gas-rich galaxies have experienced recent major interactions. The most striking difference between the H i-rich galaxies and the control sample are their clumpy H i discs that are generally very precisely centred on the central peak of stellar mass distribution and that are more extended with respect to the optical light compared to the control galaxies. However, these extended H i discs lie on a direct extrapolation of the H i size versus mass relation for ‘normal’ spirals.
The similarity of the H i discs suggests that the excess gas must come in with a broad range of angular momentum and in a relatively well-ordered way. It is possible that the ‘order results from the gas being initially in equilibrium with the dark matter halo. However, we also have to consider whether gas-rich satellites accreted in a misaligned configuration will be tidally disrupted and settle relatively quickly on the plane, without causing detectable perturbations to the existing disc. These questions need to be investigated with hydrodynamical simulations in a cosmological context.
These results suggest that galactic discs grow in a roughly ‘self-similar’ manner at late times, such that their outer H i profiles always have roughly the same shape. The weak connection between H i properties and the properties of the older stellar population can arise if stellar components grow through stellar accretion in addition to gas accretion, as might be expected to be the case in high stellar surface density, bulge-dominated galaxies.
A more detailed investigation of the H i profile shapes of the galaxies in our sample will be the subject of an upcoming paper (Wang et al., in preparation), as will be a detailed comparison with existing semi-analytic models of galaxy formation that predict the gas and stellar surface density profiles of ensembles of galaxies in a ΛCDM Universe (Fu et al., in preparation). In these models, the growth of low-redshift galactic discs is predicted to be fuelled by accretion of gas in the halo that was previously heated and ejected by supernova-driven winds (Weinmann et al. 2010).
We also plan to search for/rule out kinematic evidence of gas accretion in the forms of warps, misaligned or counter rotating H i components in the disc and associated gas clouds and to study the gas distribution in and around neighbouring galaxies around the H i-rich and control samples. The multisource H i systems will be included in this analysis. The reader is referred to one extraordinary galaxy (galaxy 48) with extremely wide-ranging H i clouds connected to one side of the galaxy; such systems may provide snapshots of the most prominent accretion events. The hope is that the results of this analysis can feed into preparations for future large-scale H i surveys with wide-field instruments like Apertif (Verheijen et al. 2008).
Finally, we would like to note that this analysis excluded 7 out of 50 (i.e. 14 per cent) of the targeted galaxies, because they were interacting with companions, undetected, unobserved or otherwise disturbed. This is a substantial fraction of the original sample and we note that some of our conclusions about the ‘quiesence’ of the gas-rich population may change once we come up with ways to parametrize the full population in a fair way. This will be the subject of future investigation.
We thank L. Shao, B. Catinella, R. Reyes, E. Elson for useful discussions. We are grateful to the editor and anonymous referee for helpful suggestions.
MDH was supported for this research through a stipend from the International Max Planck Research School (IMPRS) for Astronomy and Astrophysics at the Universities of Bonn and Cologne GALEX is a NASA Small Explorer, launched in 2003 April, developed in cooperation with the Centre National d’Etudes Spatiales of France and the Korean Ministry of Science and Technology.
Funding for the SDSS and SDSS-II has been provided by the Alfred P. Sloan Foundation, the Participating Institutions, the National Science Foundation, the US Department of Energy, the National Aeronautics and Space Administration, the Japanese Monbukagakusho, the Max Planck Society, and the Higher Education Funding Council for England. The SDSS web site is http://www.sdss.org/.
Member of the International Max Planck Research School (IMPRS) for Astronomy and Astrophysics at the Universities of Bonn and Cologne.
In practice, we tune the value of |$\sigma _{\rm \text{G}auss}$| until the rms of the convolved noise cubes matches that of the actual data cube.
We have tested that rerunning the mask finding routine on each of the perturbed data cubes makes essentially no difference to final result, because we are not working in the limit of very noisy data.
REFERENCES
APPENDIX A: ATLAS OF THE BLUEDISK GALAXIES
To get a visual impression of the difference between the H i-rich and control samples, we display the H i surface density maps overlaid on the SDSS optical images (obtained from the SDSS DR7 CAS visual tools4) for the two samples separately in Figs A1 and A2. All the maps have the same size of 140 kpc. The outmost contour has a level of the estimated detection threshold of the total H i image (see Section 2.3). The galaxies that are excluded from analysis in this work are also displayed in Fig. A3.
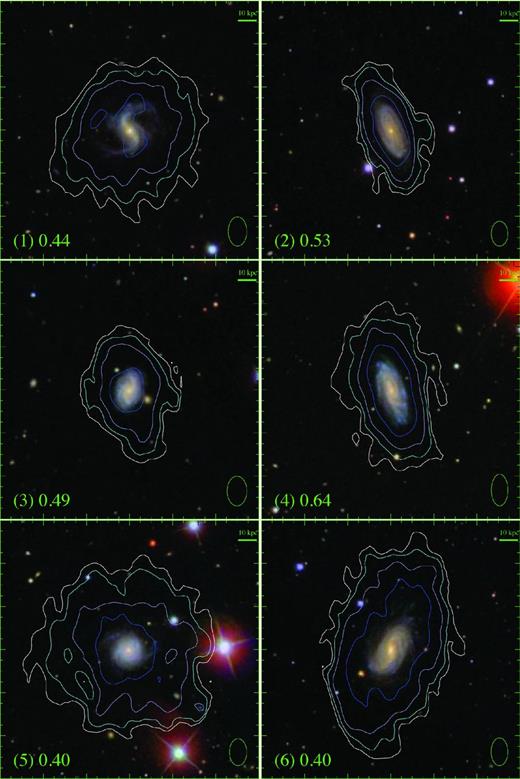
H i column density contours on the optical images for the H i-rich galaxies. All the maps have a size of 140 kpc, and the length of 10 kpc is displayed at the top-right corner. The galaxy ID is denoted in brackets at bottom-left corner of each map. The outmost contour has a column density equivalent to the estimated detection threshold of the total H i image (see Section 2.2) and is denoted in unit of 1020 atoms cm−1 in the bottom-left corner of each map. The contour levels increase with a step of 2.5 times. The shape of the beam is plotted at the bottom-right corner of each map. All the maps are displayed as north up and east left.
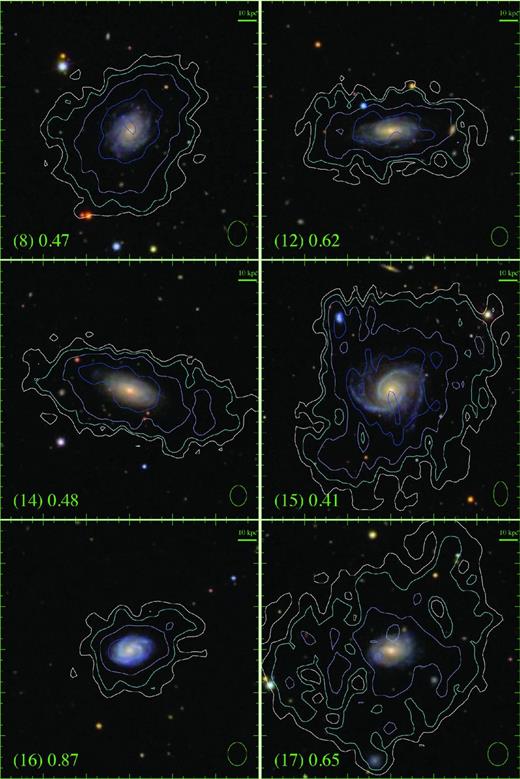
– continued
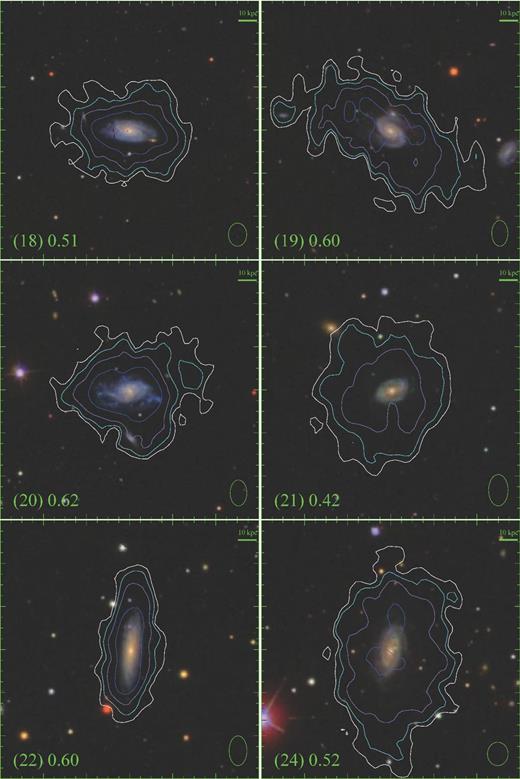
– continued
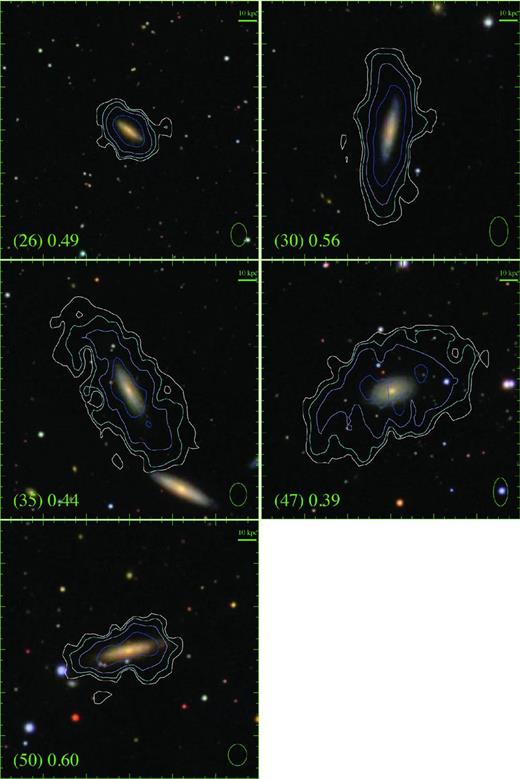
– continued
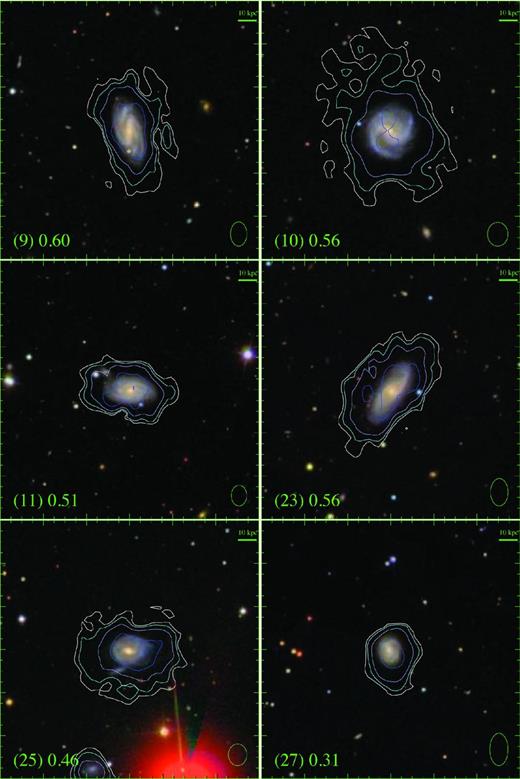
H i column density contours on the optical images for the control galaxies. See caption of Fig. A1.
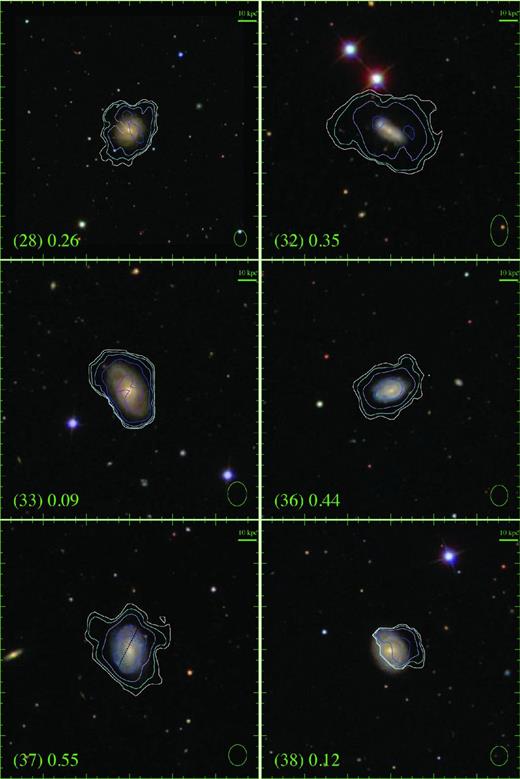
– continued
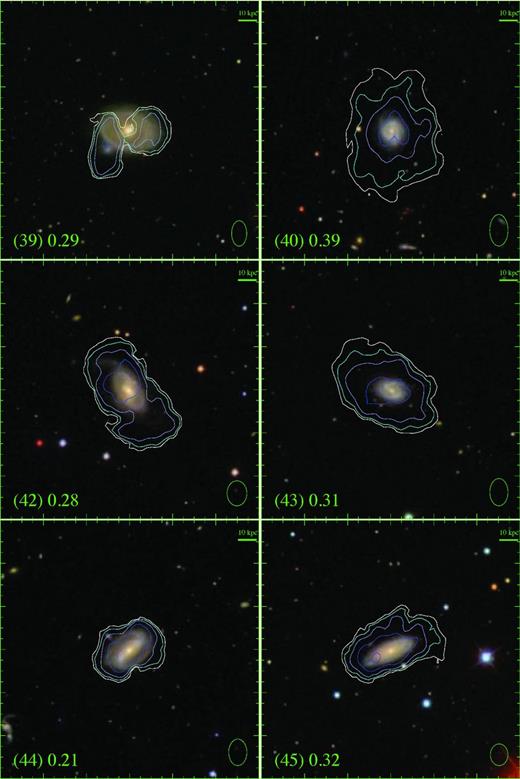
– continued
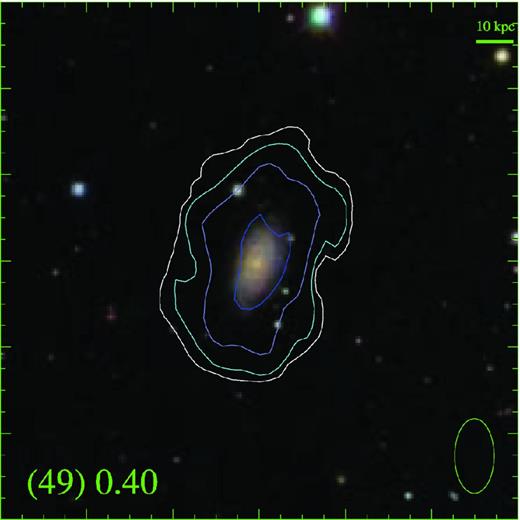
– continued
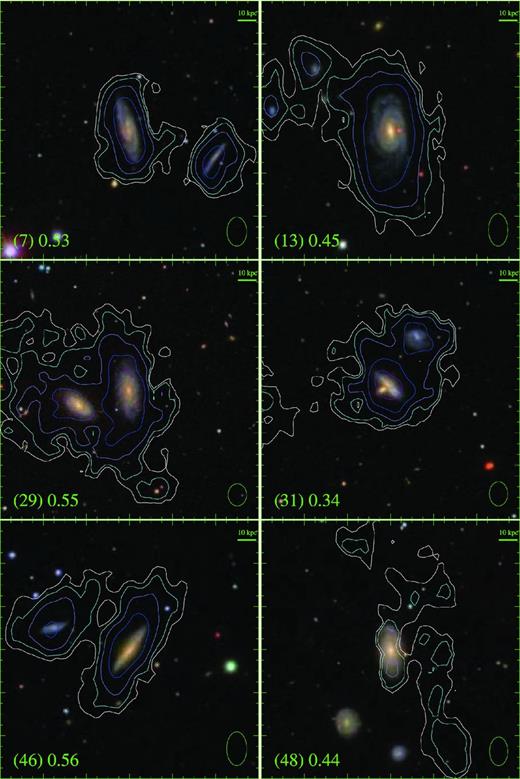
H i column density contours on the optical images for the excluded galaxies. See caption of Fig. A1.

– continued
