


Abstract
Understanding whether the bulge or the halo provides the primary link to the growth of supermassive black holes has strong implications for galaxy evolution and supermassive black hole formation itself. In this paper, we approach this issue by investigating extragalactic globular cluster (GC) systems, which can be used to probe the physics of both the bulge and the halo of the host galaxy. We study the relation between the supermassive black hole masses (MBH) and the GC system velocity dispersions (σGC) using an updated and improved sample of 21 galaxies. We exploit the dichotomy of GC system colours, to test if the blue and red GCs correlate differently with black hole mass. This may be expected if they trace the potentially different formation history of the halo and of the bulge of the host galaxy, respectively. We find that MBH correlates with the total GC system velocity dispersion, although not as strongly as claimed by recent work of Sadoun & Colin. We also examine the MBH-σGC relation for barred/barless and core/non-core galaxies, finding no significant difference, and for the first time we quantify the impact of radial gradients in the GC system velocity dispersion profile on the MBH-σGC relation. We additionally predict MBH in 13 galaxies, including dwarf elliptical galaxies and the cD galaxy NGC 3311. We conclude that our current results cannot discriminate between the bulge/halo scenarios. Although there is a hint that the red GC velocity dispersion might correlate better with MBH than the blue GC velocity dispersion, the number statistics are still too low to be certain.
INTRODUCTION
Extragalactic globular clusters (GCs) may provide key insight into the connection between galaxies and supermassive black holes (SMBHs). GCs are typically old (>10 Gyr; Brodie & Strader 2006) and may have witnessed the events which formed the SMBH in the first place. Moreover, GC systems usually come in two subpopulations, thought to be the result of different formation mechanisms (e.g. Ashman & Zepf 1992; Forbes, Brodie & Grillmair 1997; Côté, Marzke & West 1998). The blue (metal-poor) subpopulation has been associated with galaxy haloes (Forte, Faifer & Geisler 2005; Moore et al. 2006; Forbes, Ponman & O’Sullivan 2012a; Spitler et al. 2012). It may have originated in metal-poor dwarf galaxies at high redshift consequently accreted into the halo of larger systems (Elmegreen, Malhotra & Rhoads 2012). The properties of the red (metal-rich) GCs are similar to those of the galaxy bulge (Strader et al. 2011; Forbes et al. 2012b), perhaps because of a coeval formation, such as in a turbulent disc (Shapiro, Genzel & Förster Schreiber 2010) or in a merger (Kruijssen et al. 2012). Therefore, if the growth of SMBHs is primarily driven by recent merger events, one might expect a stronger correlation between red GCs and SMBHs. Conversely, if the properties of SMBHs were set during the primordial formation of their host galaxies, we might expect a stronger correlation with blue GCs (Omukai, Schneider & Haiman 2008; Mayer et al. 2010; Debattista, Kazantzidis & van den Bosch 2013).
There exists a surprisingly good correlation between the total number of GCs (both blue and red) per galaxy (NGC) and the black hole mass of galaxies (MBH). However, this does not necessarily imply a primary correlation between GCs and SMBHs (Jahnke & Macciò 2011). In fact, Snyder, Hopkins & Hernquist (2011) argued this correlation to be indirect as expected if it was a consequence of the debated black hole Fundamental Plane (Hopkins et al. 2007; Graham 2008). Nevertheless, the MBH-NGC relation has been shown to have an intriguingly small scatter at fixed MBH (Burkert & Tremaine 2010; Harris & Harris 2011). Rhode (2012) has recently shown that these findings are driven by low number statistics, and that an improved galaxy sample returns a scatter at fixed MBH which is larger than previously inferred. Rhode additionally found similar slopes and scatters for the relations for the blue and the red GCs.
Recently, Sadoun & Colin (2012, hereafter SC12) have examined the correlation between the GC system velocity dispersion and MBH for 12 galaxies, including the Milky Way. Their results suggest a tight correlation between MBH and the velocity dispersion for both the red and blue GC subpopulations, with an intrinsic scatter ϵ always ≤0.33 dex, indicating a very tight correlation. They also find that the red GCs are more closely correlated (ϵ = 0.22 dex) with MBH than the blue GCs (ϵ = 0.33dex).
In this paper, we revisit the work of SC12 with an expanded sample of 21 galaxies and updated MBH values. We supplemented our sample with high velocity resolution data from the ongoing SLUGGS survey (Pota et al. 2013) and we re-analysed the literature data with the same method. We tested if the tight correlation seen for the red GCs is real or driven by sample selection or methodology biases. The outline of the paper is as follows. We describe the data in Section 2 and their analysis in Section 3. Results are then presented and discussed in Section 4. Conclusions are given in Section 5.
GALAXY SAMPLE
We study a subset of galaxies with direct MBH measurements and with more than 10 GC radial velocity measurements. From the literature, we compiled a list of 13 galaxies. This includes all the galaxies discussed in SC12, excluding the Milky Way, and two additional galaxies: NGC 253 (Olsen et al. 2004) and NGC 3585 (Puzia et al. 2004), not studied by SC12 because the uncertainties on the GC velocity dispersion were not quoted in the parent papers. The Milky Way is not included in this study because the results of Côté (1999) suggest that the still uncertain velocity dispersion of the Milky Way GC system is unusually large for its black hole mass. Moreover, the fact that the Milky Way GC analysis is carried out in three dimensions rather than in projection, makes the comparison with other galaxies not straightforward. We also update the GC catalogue used by SC12 for NGC 4594 with the latest compilation of Alves-Brito et al. (2011). We note that SC12 used MBH values from Gültekin et al. (2009a) although more recent MBH were sometimes available.
For NGC 224 (M31) we use the GC system velocity dispersion measurements from Lee et al. (2008), because their catalogue is not available online.
In regard to NGC 253, there are two public GC catalogues for this galaxy: Beasley & Sharples (2000) and Olsen et al. (2004), for a total of 38 GCs. However, we were unable to find a reliable calibration offset between the radial velocities of the four GCs in common between these two data sets. We decided to use the Olsen catalogue only, because it is larger in size (24 GCs) than Beasley's data set (14 GCs).
The biggest strength of our data set is the addition of a further nine new early-type galaxies from the SLUGGS survey, one of which (NGC 4486) was already discussed in SC12. We use the most recent black hole mass measurements as summarized in McConnell & Ma (2013) and Graham & Scott (2013). This gives us a sample of 21 galaxies, nearly double the number used by SC12, which are listed in Table A1.
METHOD
The globular cluster system velocity dispersion
The stellar velocity dispersion, σ*, used in the MBH-σ* relation is usually defined either as the luminosity-weighted velocity dispersion within 1/8th of an effective radius Re, or within 1 Re (σe), and/or as the central velocity dispersion (σ0). Although they represent physically distinct quantities, σe and σ0 have been reported to be consistent with each other (Gültekin et al. 2009a). This stems from the fact that the velocity dispersion profiles vary only weakly within these regions (e.g. Emsellem et al. 2011).
The detection of extragalactic GCs occurs predominantly at R ≥ Re. Therefore, none of the stellar velocity dispersion quantities are directly recovered with GC data. We define the GC system velocity dispersion in two different ways, which are similar to the quantities used for stellar data. This also takes into account that some GC systems can have a rotation component which is as large as that of the random motions (Beasley et al. 2006).
The difference between σGC and vGC is that the former represents the rotation-subtracted velocity dispersion whereas the latter also includes the rotation of the spheroid and it is a better reflection of specific kinetic energy. A comparison between σGC and vGC is given in Fig. 1 for our galaxy sample without any GC subpopulation split. The two quantities are consistent with each other when the rotation component is negligible, as seen for several systems.
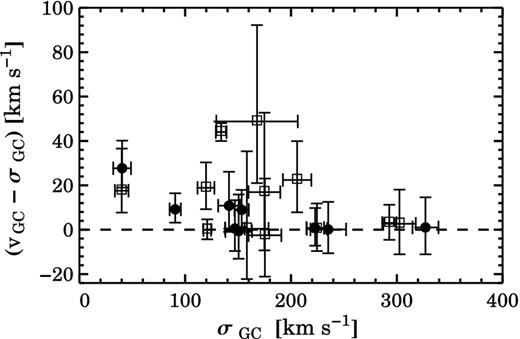
Difference between the rotation-subtracted velocity dispersion σGC and the rotation-included velocity dispersion vGC without any colour split. The filled points and empty squares are the data from the SLUGGS survey and the literature, respectively. The two quantities are generally consistent with each other, but they disagree by up to ∼40 km s−1 in systems with significant rotation.
We perform a ‘sanity check’ on all literature data. We prune GCs deviating more than 3σ from the local GC velocity distribution. We also clip outliers with unreasonably large uncertainty (usually >100 km s−1) and then we recalculate the respective σGC and vGC to avoid methodology biases.
The MBH-σGC and MBH-vGC relations for GC systems
Here, we describe how we characterize the MBH-σGC relation. The procedure is identical for the MBH-vGC relation.
This χ2 estimator does not treat the data symmetrically in the presence of intrinsic scatter. An ‘inverse’ regression (minimizing the log σGC residuals rather than the log MBH residuals) can lead to very different slopes. The latter is preferable in the presence of possible Malmquist-type biases (see Graham et al. 2011). Given our ignorance of the physical mechanisms which link black hole mass to velocity dispersion, there is no reason to believe that the forward regression should be favoured over the inverse regression. Therefore, we perform both the ‘forward’ and the ‘inverse’ regression by replacing ϵ in equation (4) with β2ϵ2 as suggested by Novak et al. (2006).
RESULTS
The MBH-vGC (and the MBH-σGC) diagrams for our sample are shown in Fig. 2, in which the final slope and intercept of the relations are the average between the forward and the inverse fit. The respective best-fitting parameters are reported in Table 1.
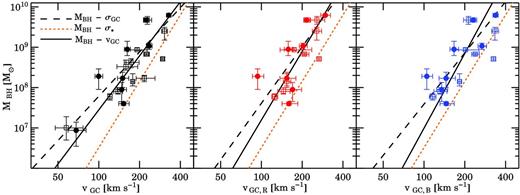
Black hole mass as a function of rotation-included GC system velocity dispersion. Left-hand, central and right-hand panels show the MBH-vGC relation for all, red and blue GCs, respectively. Data from the literature and from the SLUGGS survey are shown as the open squares and filled points, respectively. The black solid line is the best fit to the MBH-vGC relation. The dashed lines are the best fit to the MBH-σGC relations (whose data points are not plotted here for clarity). The slope and the intercept of the best-fitting lines are the average between the values from the forward and inverse regression (see Table 1). The dotted orange line is the stellar MBH-σ* relation from the average between the forward and the inverse regression from Graham et al. (2011): α = 8.14 ± 0.05 and β = 5.54 ± 0.40.
Solutions to log (MBH/M⊙) = α + βlog (σGC/200 kms−1) for different GC subsets. Shown are the sample size N, the intercept α, the slope β, the intrinsic scatter ϵ and the total rms scatter Δ in the log MBH direction for both the forward (minimize log MBH residual) and for the inverse regression (minimize log σ residual).
| Forward regression | Inverse regression | ||||||||
|---|---|---|---|---|---|---|---|---|---|
| Sample | N | α | β | ϵ (dex) | Δ | α = −αinv/βinv | β = 1/βinv | ϵ = ϵinv/βinv (dex) | Δ |
| MBH-σGC | 21 | |$8.76 _{-0.11} ^{+0.11}$| | |$3.22 _{-0.33} ^{+0.48}$| | |$0.42 _{-0.09} ^{+0.06}$| | 0.41 | |$8.86 _{-0.12} ^{+0.13}$| | |$4.35 _{-0.61} ^{+1.02}$| | |$0.48 _{-0.11} ^{+0.07}$| | 0.51 |
| (MBH > 107 M⊙)-vGC | 19 | |$8.75 _{-0.11} ^{+0.11}$| | |$3.85 _{-0.76} ^{+0.93}$| | |$0.43 _{-0.06} ^{+0.10}$| | 0.44 | |$8.80 _{-0.13} ^{+0.14}$| | |$6.18 _{-0.97} ^{+1.37}$| | |$0.54 _{-0.13} ^{+0.08}$| | 0.57 |
| MBH-vGC | 21 | |$8.75 _{-0.10} ^{+0.11}$| | |$3.74 _{-0.46} ^{+0.59}$| | |$0.40 _{-0.06} ^{+0.09}$| | 0.42 | |$8.83 _{-0.12} ^{+0.12}$| | |$5.16 _{-0.62} ^{+0.91}$| | |$0.47 _{-0.12} ^{+0.07}$| | 0.52 |
| (MBH > 107 M⊙)-σGC | 19 | |$8.83 _{-0.10} ^{+0.12}$| | |$3.59 _{-0.66} ^{+0.84}$| | |$0.41 _{-0.06} ^{+0.10}$| | 0.42 | |$8.93 _{-0.13} ^{+0.15}$| | |$5.63 _{-0.88} ^{+1.18}$| | |$0.52 _{-0.12} ^{+0.07}$| | 0.53 |
| MBH-σ* | 21 | |$8.46 _{-0.10} ^{+0.07}$| | |$4.44 _{-0.50} ^{+0.74}$| | |$0.35 _{-0.05} ^{+0.08}$| | 0.37 | |$8.44 _{-0.11} ^{+0.08}$| | |$5.48 _{-0.68} ^{+1.08}$| | |$0.39 _{-0.09} ^{+0.06}$| | 0.42 |
| MBH-σGC, B | 16 | |$8.75 _{-0.12} ^{+0.14}$| | |$3.45 _{-0.63} ^{+0.63}$| | |$0.47 _{-0.12} ^{+0.07}$| | 0.46 | |$8.82 _{-0.16} ^{+0.19}$| | |$5.37 _{-0.86} ^{+1.14}$| | |$0.58 _{-0.15} ^{+0.09}$| | 0.59 |
| MBH-vGC, B | 16 | |$8.73 _{-0.11} ^{+0.13}$| | |$3.50 _{-0.68} ^{+0.72}$| | |$0.45 _{-0.12} ^{+0.07}$| | 0.45 | |$8.75 _{-0.15} ^{+0.16}$| | |$5.53 _{-0.87} ^{+1.17}$| | |$0.56 _{-0.16} ^{+0.09}$| | 0.57 |
| MBH-σGC, R | 16 | |$8.87 _{-0.12} ^{+0.14}$| | |$3.77 _{-0.64} ^{+0.93}$| | |$0.47 _{-0.13} ^{+0.07}$| | 0.47 | |$9.02 _{-0.16} ^{+0.14}$| | |$5.98 _{-1.07} ^{+1.51}$| | |$0.60 _{-0.16} ^{+0.10}$| | 0.60 |
| MBH-vGC, R | 16 | |$8.85 _{-0.12} ^{+0.12}$| | |$4.50 _{-0.97} ^{+1.26}$| | |$0.44 _{-0.13} ^{+0.07}$| | 0.47 | |$8.93 _{-0.14} ^{+0.15}$| | |$6.77 _{-1.11} ^{+1.46}$| | |$0.54 _{-0.16} ^{+0.09}$| | 0.59 |
We find that MBH correlates both with σGC and vGC for all GC subsamples. However, we note that the intrinsic scatter of all our GC subsets are at least two times larger than those reported by SC12. We find that this disagreement is driven by the MBH values of five galaxies in the SC12 sample (marked in Table A1 with ‘a’) for which we have updated MBH measurements. In fact, re-analysing the SC12 sample using our new velocity dispersion values and the MBH values from SC12 (all from Gültekin et al. 2009b, and references therein), we always obtain ϵ ≤ 0.31 dex, which is in agreement with their findings. Conversely, the regression on the SC12 sample using updated MBH values, returns ϵ = 0.38 dex for the full sample and ϵ = 0.44 dex for the blue and red GC subsets. We conclude that the small intrinsic scatter of SC12 is driven by their black hole mass values and not by their GC system velocity dispersion data. This assumes that the latest values of MBH that we adopt here are also more accurate than those which preceded them.
The slope, intercept and intrinsic scatter of the MBH-vGC and the MBH-σGC relations are consistent with each other within the errors. Similarly, the differences found for the blue and red GCs are not statistically significant. We note that the slopes of the MBH-vGC relations are always steeper than the MBH-σGC ones, because vGC > σGC at low masses. Also, the smaller intrinsic scatter with vGC suggests that the GC kinetic energy (rotation plus dispersion) is a better predictor of black hole masses than the rotation-subtracted velocity dispersion.
The intrinsic scatter of the MBH-vGC and MBH-σGC relations is slightly larger than that of the stellar MBH-σ* relation from McConnell & Ma (2013) and Graham & Scott (2013), who both find ϵ ∼ 0.4 dex. The best fit to the stellar MBH-σ* relation computed using our 21 galaxies has an intrinsic scatter of |$\epsilon =0.35 _{-0.05} ^{+0.08}$| dex in the log MBH direction, which is also consistent with previous findings.
Lastly, it is noted that the stellar MBH-σ* relation in Fig. 2 is shifted towards larger velocity dispersion values with respect to the MBH–(GC system velocity dispersion) relations. This offset is expected because σ* and the GC system velocity dispersion sample different regions, and maybe different physics, of the galaxy velocity dispersion profile. The stellar velocity dispersion, which probes (R < Re), is usually larger than the GC system velocity dispersion, which usually probes R > Re. The difference (σ* − vrms,A) is found to have a mean of 35 ± 6 km s−1 for our 21 galaxies.
Radial trends
It is interesting to see if the properties of the MBH-vGC or MBH-σGC relation vary when the velocity dispersion is computed within different galactocentric radii.
To do so, we first normalize the galactocentric radii of each GC system to the host galaxy effective radius. We then perform χ2 tests (equation 4) with vGC and σGC computed within different radial bins. For the sake of consistency, we adopt effective radii values from Two Micron All Sky Survey, and we use the transformations from Cappellari et al. (2011) to make them consistent with the values of the RC3 catalogue (de Vaucouleurs 1991).
The cumulative velocity dispersion profiles for our galaxy sample are shown in Fig. 3 for all GC subsets. The profiles are generally flat over the radial range probed. It is worth noting that GC dispersion profiles span different radial ranges depending on the galaxy, and we do not extrapolate the dispersion profiles to compensate for this effect. Therefore, the number of GC systems within a given effective radius varies with the radius itself. Demanding a minimum of six GC systems per radial bin, we study the MBH-vGC and the MBH-σGC relations between 3.5 and 5.5 Re for the blue and the red GC subpopulations.

Cumulative root-mean-square (rms) velocity dispersion profiles. The plot shows the rotation-included velocity dispersion profiles within a certain radius for all (top panel), blue (central panel) and red GCs (bottom panel). A running mean is used. Different colours represent different galaxies. Most of the profiles are generally flat at all radii.
Results are shown in Fig. 4 for the MBH-vGC relation. Each radial bin contains between six and a maximum of 11 GC systems. As expected from the flatness of the velocity dispersion profiles (Fig. 3), none of the radial trends seen in Fig. 4 are statistically significant. The relations for the blue and the red GC subpopulations are also statistically indistinguishable. There is a hint that the intrinsic scatter for the MBH-vGC, R becomes smaller towards the central regions. This result is biased by the fact that the red GCs tend to be more centrally concentrated than the blue GGs. Given the small number statistics, the best fit to the MBH-vGC relation is independent of radius within which the velocity dispersion is measured, at least for R > Re. The same exercise performed on the rotation-subtracted velocity dispersion σGC leads to a similar result.
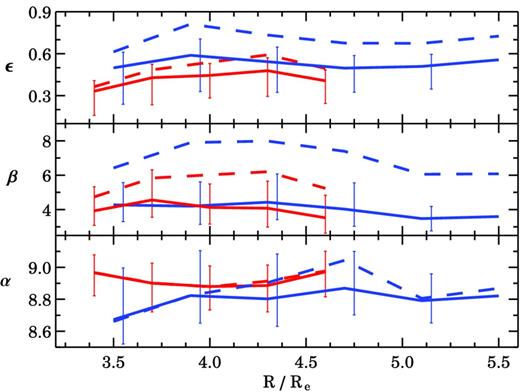
Best-fitting MBH-vGC relation within different radial bins. The plot shows how the best fit α, β and ϵ vary when the vGC is computed within an increasing number of effective radii. The blue and red colours (in the online version) represent the two GC subpopulations. The solid and dashed lines are the results from the forward and the inverse regressions, respectively. The horizontal axis is the radius of the outermost GC in a given radial bin. For clarity, only the error bars from the forward regression are shown. None of the radial trends are statistically significant.
A caveat to bear in mind is the way the GC system velocity dispersion is computed. Ideally, one should weight the velocity dispersion for the GC surface density within a certain radius, similarly to what is done for the stellar velocity dispersion σ* (see equation 1 in McConnell & Ma 2013). Similarly, the scale radius used in Fig. 3 should be the GC system's effective radius and not the host galaxy's effective radius. However, GC surface density profiles are not available for all our galaxies. They are also dependent on variables such as GC selection criteria and imaging field of view, which have been carried out differently in the literature.
On the other hand, total GC system size scales with galaxy effective radius (Kartha et al. in preparation) and we see no strong variation of GC system velocity dispersion with radius.
Cores and bars
The stellar MBH-σ* relation is different for galaxies with or without bars (Graham et al. 2011). It is thought that the orbital structure of the bar may elevate the apparent bulge velocity dispersion (Bureau & Athanassoula 1999), resulting in an offset MBH-σ* relation for barred galaxies with the appropriate bar orientation. On the other hand, the MBH-σ* relation does not differ for non-barred galaxies with or without a ‘core’ in the inner surface brightness profile (Graham & Scott 2013). An exception may however exist for ultramassive black holes such as those in NGC 3842 and NGC 4489 (McConnell et al. 2011). If these are included in the fit, the MBH-σ* relation for core galaxies is steeper (β ∼ 7.0) than that for non-core galaxies.
We have tested whether the trends seen for ‘core’ and barred galaxies with stellar data are also present in our MBH-vGC and MBH-σGC relations. To avoid low number statistics issues, we only look at the whole GC population, without any colour split.
Our sample contains only three barred galaxies (NGC 1023, NGC 1316 and NGC 253), preventing any statistical analysis. For the sake of completeness, we note that NGC 1023 and NGC 1316 are indeed offset to higher velocity dispersions relative to the best-fitting MBH-vGC relation (Fig. 5). However, only NGC 1023 is offset when considering σGC. NGC 253 is neither offset from the MBH-vGC nor the MBH-σGC relation, in agreement with what was found for stellar data.

MBH-vGC relation. The orange and black points are galaxies with and without a core in the inner surface brightness profile, respectively. The filled and dashed lines are the best fits to core and non-core galaxies when using vGC and σGC, respectively. The green boxes mark barred galaxies (NGC 1316, NGC 1023 and NGC 253). The slope of the MBH-vGC relation for core galaxies is consistent within the errors with that of non-core galaxies.
Regarding ‘core’ galaxies, our sample contains nine core galaxies and 12 non-core galaxies (see Table A1). The centre of the galaxy NGC 1407 is actually unclassified, but we assume this galaxy to have a central core given its mass. We treat NGC 1316 (Fornax A) as a cored galaxy (Faber et al. 1997), but the reader should see the cautionary remarks in Graham & Scott (2013) regarding this galaxy's lack of a bulge/disc decomposition.
The relation between MBH and GC system velocity dispersion for core/non-core galaxies is shown in Fig. 5. We remind the reader that the final slope of the MBH–(GC system velocity dispersion) relations is the average between the forward and the inverse regression. Using the uncertainty on the slope and intercept of each regression, we derived a weighted mean to account for the large uncertainties caused by low number statistics. For non-core galaxies, we obtain a slope of β = 3.6 ± 1.5 and β = 2.8 ± 1.5 for the MBH-σGC and MBH-vGC relations, respectively. For core galaxies, the uncertainty on the slope from the inverse regression is larger than the slope itself. This means that the final slope of this relation is driven only by that of the forward regression. In this case, we find β = 2.2 ± 1.6 and β = 2.4 ± 1.6 for the MBH-σGC and MBH-vGC relations, respectively. In conclusion, the MBH–(GC system velocity dispersion) relations for core and non-core galaxies are consistent with each other as found by Graham & Scott (2013) with stellar velocity dispersion data.
Predicting MBH in other galaxies
Black hole mass predictions. Listed from the left to right are: galaxy name, morphological type, GC rms velocity dispersion, predicted black hole mass from equation (5) and the GC references. Galaxies below the horizontal line are from the SLUGGS survey. References to GC data are: 1 Puzia et al. (2004); 2 Misgeld et al. (2011); 3 Norris et al. (2012); 4 Lee et al. (2010); 5 Park et al. (2012a); 6 and 7 Beasley et al. (2009); 8 Beasley et al. (2006); 9, 10, 11 and 12 Pota et al. (2013); and 13 Foster et al. (2011).
| Galaxy | Type | vGC | MBH | Ref. |
|---|---|---|---|---|
| (km s−1) | (M⊙) | |||
| NGC 1380 | S0 | |$160_{-17} ^{+23}$| | |$2.2_{-0.9} ^{+1.8} \times 10^8$| | 1 |
| NGC 3311 | cD | |$653_{-40} ^{+48}$| | |$1.2_{-0.3} ^{+0.4} \times 10^{11}$| | 2 |
| NGC 3923 | E4 | |$273_{-29} ^{+42}$| | |$2.4_{-0.9} ^{+2.1} \times 10^{9}$| | 3 |
| NGC 4636 | E2 | |$212_{-10} ^{+11}$| | |$7.9_{-1.5} ^{+2.0} \times 10^{8}$| | 4 |
| NGC 4406 | E3 | |$295_{-36} ^{+54}$| | |$3.4_{-1.5} ^{+3.8} \times 10^{9}$| | 5 |
| VCC 1261 | dE | |$56_{-11} ^{+18}$| | |$2.1_{-1.3} ^{+5.1} \times 10^{6}$| | 6 |
| VCC 1528 | dE | |$52_{-15} ^{+22}$| | |$1.5_{-1.1} ^{+5.7} \times 10^{6}$| | 7 |
| VCC 1087 | dE | |$41_{-10} ^{+14}$| | |$5.2_{-3.7} ^{+14} \times 10^{5}$| | 8 |
| NGC 1400 | S0 | |$137_{-11} ^{+14}$| | |$1.1_{-0.3} ^{+0.6} \times 10^{8}$| | 9 |
| NGC 2768 | E6 | |$165_{-11} ^{+13}$| | |$2.6_{-0.6} ^{+1.0} \times 10^{8}$| | 10 |
| NGC 4278 | E2 | |$177_{-7} ^{+9}$| | |$3.5_{-0.6} ^{+0.8} \times 10^{8}$| | 11 |
| NGC 4365 | E3 | |$248_{-10} ^{+12}$| | |$1.6_{-0.2} ^{+0.3} \times 10^{9}$| | 12 |
| NGC 4494 | E1 | |$99_{-12} ^{+14}$| | |$2.6_{-1.1} ^{+2.1} \times 10^{7}$| | 13 |
Galaxy sample. Galaxy NGC names (1) and Hubble types (2) are from NED data base. Galaxy distances (3), SMBH masses (4) and stellar velocity dispersions (5) are from McConnell & Ma (2013), and references therein. If not in McConnell & Ma (2013): distances were obtained by subtracting 0.06 mag (Mei et al. 2007) from the distance modulus from Tonry et al. (2001); central stellar velocity dispersions are weighted values from HyperLeda; MBH are from Oliva et al. (1995) and Hu (2008) for NGC 253 and NGC 5846, respectively. Column (6) is the presence of a core in the galaxy inner surface brightness profile. Columns (7), (8) and (9) are the rotation-subtracted velocity dispersion for all, blue and red GCs, respectively. Columns (10), (11) and (12) are the rms velocity for all, blue and red GCs, respectively. GC references (13): 1 Lee et al. (2008); 2 Olsen et al. (2004); 3 Beasley et al. (2004); 4 Goudfrooij et al. (2001); 5 Schuberth et al. (2010); 6 Nantais & Huchra (2010); 7 Pierce et al. (2006); 8 Bergond et al. (2006); 9 Puzia et al. (2004); 10 Côté et al. (2003); 11 Alves-Brito et al. (2011); 12 Hwang et al. (2008); 13 Woodley et al. (2010); 14 Pota et al. (2013); 15 Arnold et al. (2011); 16 Foster et al. (in preparation); 17 Strader et al. (2011); and 18 Pota et al. (in preparation). GC system velocity dispersion values for NGC 224 are from Lee et al. (2008). Galaxies with updated MBH measurements after Gültekin et al. (2009b) are marked with (a).
| Galaxy | Type | D | MBH | σ* | Core | σA | σB | σR | vGC | vGC, B | vGC, R | Ref. |
|---|---|---|---|---|---|---|---|---|---|---|---|---|
| (NGC) | (Mpc) | (108 M⊙) | (km s−1) | (km s−1) | (km s−1) | (km s−1) | (km s−1) | (km s−1) | (km s−1) | |||
| (1) | (2) | (3) | (4) | (5) | (6) | (7) | (8) | (9) | (10) | (11) | (12) | (13) |
| 0224 | Sb | 0.73 | |$1.4_{-0.3} ^{+0.8}$| | 160 ± 8 | n | |$134_{-5} ^{+5}$| | |$129_{-6} ^{+8}$| | |$121_{-10} ^{+9}$| | |$178_{-4} ^{+4}$| | |$183_{-5} ^{+5}$| | |$154_{-9} ^{+11}$| | 1 |
| 0253 | SBc | 3.5 | |$0.1_{-0.1} ^{+0.05}$| | 109 ± 10 | n | |$37_{-7} ^{+6}$| | – | – | |$58_{-13} ^{+16}$| | – | – | 2 |
| 0524 | S0 | 24.2 | |$8.6_{-0.4} ^{+1.0}$| | 235 ± 10 | y | |$175_{-15} ^{+15}$| | |$167_{-27} ^{+23}$| | |$164_{-33} ^{+27}$| | |$192_{-26} ^{+36}$| | |$202_{-34} ^{+52}$| | |$174_{-37} ^{+61}$| | 3 |
| 1316 | SB0 | 21.0 | |$1.7_{-0.3} ^{+0.3}$| | 226 ± 11 | y | |$168_{-41} ^{+38}$| | – | – | |$217_{-28} ^{+43}$| | – | – | 4 |
| 1399 | E1 | 19.4 | |$4.7_{-0.6} ^{+0.6}$| | 296 ± 15 | y | |$293_{-8} ^{+7}$| | |$321_{-12} ^{+12}$| | |$269_{-10} ^{+9}$| | |$296_{-8} ^{+8}$| | |$325_{-12} ^{+13}$| | |$266_{-9} ^{+10}$| | 5 |
| 3031 | Sab | 4.1 | |$0.9_{-0.11} ^{+0.20}$| | 143 ± 7 | n | |$120_{-9} ^{+8}$| | |$124_{-13} ^{+13}$| | |$99_{-8} ^{+8}$| | |$139_{-10} ^{+11}$| | |$131_{-13} ^{+16}$| | |$145_{-13} ^{+17}$| | 6 |
| 3379a | E1 | 10.7 | |$4.2_{-1.1} ^{+1.0}$| | 206 ± 10 | y | |$184_{-14} ^{+15}$| | – | – | |$173_{-19} ^{+26}$| | – | – | 7/8 |
| 3585 | S0 | 20.6 | |$3.3_{-0.6} ^{+1.5}$| | 213 ± 10 | n | |$158_{-22} ^{+20}$| | – | – | |$159_{-23} ^{+35}$| | – | – | 9 |
| 4472a | E2 | 16.7 | |$25_{-1} ^{+6}$| | 315 ± 16 | y | |$303_{-13} ^{+15}$| | |$333_{-20} ^{+19}$| | |$261_{-18} ^{+18}$| | |$305_{-14} ^{+15}$| | |$334_{-19} ^{+22}$| | |$256_{-19} ^{+22}$| | 10 |
| 4594a | Sa | 10.0 | |$6.7_{-0.4} ^{+0.5}$| | 230 ± 12 | y | |$229_{-10} ^{+10}$| | |$238_{-14} ^{+13}$| | |$208_{-13} ^{+13}$| | |$225_{-10} ^{+11}$| | |$239_{-14} ^{+17}$| | |$208_{-13} ^{+16}$| | 11 |
| 4649a | E2 | 16.5 | |$47_{-10} ^{+11}$| | 335 ± 17 | y | |$206_{-13} ^{+13}$| | |$194_{-16} ^{+14}$| | |$228_{-28} ^{+28}$| | |$228_{-15} ^{+17}$| | |$213_{-17} ^{+21}$| | |$257_{-26} ^{+37}$| | 12 |
| 5128a | S0 | 4.1 | |$0.59_{-0.10} ^{+0.11}$| | 150 ± 7 | n | |$121_{-4} ^{+4}$| | |$118_{-5} ^{+5}$| | |$123_{-6} ^{+6}$| | |$121_{-4} ^{+5}$| | |$116_{-6} ^{+7}$| | |$125_{-6} ^{+7}$| | 13 |
| 0821a | E6 | 23.4 | |$1.7_{-0.7} ^{+0.7}$| | 209 ± 10 | n | |$151_{-13} ^{+13}$| | |$129_{-20} ^{+19}$| | |$162_{-19} ^{+20}$| | |$150_{-12} ^{+17}$| | |$145_{-17} ^{+25}$| | |$154_{-17} ^{+26}$| | 14 |
| 1023 | SB0 | 10.5 | |$0.4_{-0.04} ^{+0.04}$| | 204 ± 10 | n | |$141_{-10} ^{+10}$| | |$139_{-16} ^{+15}$| | |$139_{-18} ^{+16}$| | |$152_{-12} ^{+15}$| | |$146_{-15} ^{+21}$| | |$160_{-18} ^{+26}$| | 18 |
| 1407 | E0 | 29.0 | |$47_{-5} ^{+7}$| | 274 ± 14 | y | |$222_{-8} ^{+8}$| | |$231_{-11} ^{+11}$| | |$210_{-10} ^{+11}$| | |$223_{-8} ^{+9}$| | |$231_{-11} ^{+13}$| | |$215_{-10} ^{+12}$| | 14 |
| 3115 | S0 | 9.5 | |$8.9_{-2.7} ^{+5.1}$| | 230 ± 11 | n | |$153_{-7} ^{+7}$| | |$152_{-8} ^{+9}$| | |$150_{-10} ^{+10}$| | |$162_{-8} ^{+9}$| | |$166_{-11} ^{+13}$| | |$158_{-10} ^{+13}$| | 15 |
| 3377a | E5 | 11.0 | |$1.9_{-1.0} ^{+1.0}$| | 145 ± 7 | n | |$91_{-6} ^{+5}$| | |$99_{-7} ^{+7}$| | |$78_{-8} ^{+8}$| | |$100_{-6} ^{+7}$| | |$105_{-8} ^{+11}$| | |$94_{-8} ^{+10}$| | 14 |
| 4473a | E5 | 15.2 | |$0.89_{-0.44} ^{+0.45}$| | 190 ± 9 | n | |$147_{-9} ^{+9}$| | |$134_{-11} ^{+11}$| | |$162_{-16} ^{+14}$| | |$148_{-10} ^{+13}$| | |$135_{-11} ^{+15}$| | |$170_{-19} ^{+28}$| | 16 |
| 4486a | E1 | 16.7 | |$62_{-4} ^{+3}$| | 334 ± 10 | y | |$327_{-10} ^{+12}$| | |$336_{-17} ^{+16}$| | |$293_{-25} ^{+27}$| | |$328_{-12} ^{+14}$| | |$337_{-14} ^{+16}$| | |$296_{-22} ^{+28}$| | 17 |
| 5846 | E0 | 24.2 | |$10.7_{-1.9} ^{+1.9}$| | 237 ± 10 | y | |$235_{-18} ^{+17}$| | |$269_{-18} ^{+17}$| | |$201_{-13} ^{+13}$| | |$235_{-11} ^{+12}$| | |$268_{-17} ^{+21}$| | |$203_{-12} ^{+15}$| | 14 |
| 7457a | S0 | 12.2 | |$0.087_{-0.052} ^{+0.052}$| | 67 ± 3 | n | |$40_{-9} ^{+8}$| | – | – | |$68_{-9} ^{+12}$| | – | – | 14 |
Predicted black hole masses are given in Table 2. Particular emphasis should be given to the three Virgo dEs, whose predicted MBH falls into the range of intermediate mass black holes (≲ 106 M⊙). All three dEs are known to have a nuclear star cluster (Ferrarese et al. 2006), whose masses are about one order of magnitude larger than our predicted black hole masses, as is expected (Scott & Graham 2013). In fact, the relation between the mass of the nuclear star cluster MNC and stellar velocity dispersion σ* does not run parallel to the stellar MBH-σ*. At fixed σ* ≲ 150 km s−1, Graham & Scott (2013) show that MNC > MBH, which is in agreement with our findings.
It is also worth noting that NGC 3311, the dominant elliptical galaxy of the Hydra cluster, is at first glance predicted to host an ultramassive black hole candidate with MBH ∼ 1011 M⊙. However, caveats here are the inclusion of ultra-compact dwarfs (UCDs) which make up half of the kinematic sample of this galaxy. UCDs can be kinematically distinct from the underlying GC system (e.g. Strader et al. 2011) and they can bias the velocity dispersion calculation. Another source of contamination might come from intracluster UCDs/GCs (Misgeld et al. 2011; Richtler et al. 2011). Excluding the 52 UCDs and looking only at the GC sample, which may still be biased by the cluster potential, we obtain |$M_{\rm BH} = 8.4 _{-2.6} ^{+4.7} \times 10^{10}$|. This is still more massive than the most massive SMBH known today (McConnell et al. 2011).
DISCUSSION AND CONCLUSIONS
The aim of this paper was to test how well the velocity dispersion of extragalactic GC systems correlates with the mass of SMBHs. This was motivated by the work of SC12 who found an intriguingly tight correlation using 12 GC systems.
In this work, we have extended this study to a sample of 21 GC systems and we have used the latest compilation of SMBH masses. We confirm that the velocity dispersion of GC systems correlates with SMBH mass. However, this correlation is less significant than that inferred by SC12. The tight correlation found by these authors was driven by old, and possibly less accurate, black hole mass values. We observe an rms scatter in excess of 0.4 dex in the log MBH direction.
We looked at the correlation between MBH and the velocity dispersion of the blue and the red GC subpopulations separately. Different scatters are expected if blue and red GC systems trace the kinematics of the halo and the bulge of the host galaxy, respectively. In the case of a stronger correlation with red GCs, this would suggest that SMBHs grew along with the stellar bulge. Conversely, a stronger correlation with blue GCs would suggest that SMBHs formation is more closely related with the halo. Our current results cannot discriminate between these two scenarios. In general, we find no significant difference between the MBH–(GC system velocity dispersion) relation for the blue and the red GCs. This can be due to some factors discussed below.
Ideally, one should analyse the bluer and the redder GCs for each GC system to avoid contamination in proximity to the blue/red dividing colour. This can make a difference in the final value of the GC system velocity dispersion (Pota et al. 2013). At the same time, this would decrease the number statistics for most of the galaxies. Also, uneven GC spatial sampling can affect the final kinematic outcome, as seen for NGC 4636 in Schuberth et al. (2012).
We have looked at the MBH–(GC system velocity dispersion) relation computing the GC system velocity dispersion within different galactocentric radii, obtaining no significant trends with radius. Collectively, this suggests either that the MBH–(GC system velocity dispersion) relation is secondary or that a larger galaxy sample will be needed to discriminate which of the GC subpopulation trends is stronger.
We have looked for possible trends in the MBH–(GC system velocity dispersion) relation for core/non-core galaxies, finding similar slopes, in agreement with stellar velocity dispersion results (Graham & Scott 2013).
The best-fitting relation between MBH and the rotation-included GC system velocity dispersion has been used to predict black hole masses in 13 galaxies. This implies that NGC 3311 contains an ultramassive black hole with MBH ∼ 1011 M⊙.
We thank the anonymous referee for the constructive feedback. Some of the data presented herein were obtained at the W. M. Keck Observatory, operated as a scientific partnership among the California Institute of Technology, the University of California and the National Aeronautics and Space Administration, and made possible by the generous financial support of the W. M. Keck Foundation. The authors wish to recognize and acknowledge the very significant cultural role and reverence that the summit of Mauna Kea has always had within the indigenous Hawaiian community. The analysis pipeline used to reduce the DEIMOS data was developed at UC Berkeley with support from NSF grant AST-0071048. This work is based in part on data collected at Subaru Telescope and obtained from the SMOKA (which is operated by the Astronomy Data Centre, National Astronomical Observatory of Japan), via a Gemini Observatory time exchange. AWG is supported by the Australia Research Council (DP110103509 and FT110100263). This work was supported by NSF grants AST-0909037 and AST-1211995. This research has made use of the NASA/IPAC Extragalactic Database (NED) which is operated by the Jet Propulsion Laboratory, California Institute of Technology, under contract with the National Aeronautics and Space Administration. We acknowledge the usage of the HyperLeda data base (http://leda.univ-lyon1.fr).
