


Abstract
We present a first systematic comparison of superluminous Type Ia supernovae (SNe Ia) at late epochs, including previously unpublished photometric and spectroscopic observations of SN 2007if, SN 2009dc and SNF20080723-012. Photometrically, the objects of our sample show a diverse late-time behaviour, some of them fading quite rapidly after a light-curve break at ∼ 150–200 d. The latter is likely the result of flux redistribution into the infrared, possibly caused by dust formation, rather than a true bolometric effect. Nebular spectra of superluminous SNe Ia are characterized by weak or absent [Fe iii] emission, pointing at a low ejecta ionization state as a result of high densities. To constrain the ejecta and 56Ni masses of superluminous SNe Ia, we compare the observed bolometric light curve of SN 2009dc with synthetic model light curves, focusing on the radioactive tail after ∼60 d. Models with enough 56Ni to explain the light-curve peak by radioactive decay, and at the same time sufficient mass to keep the ejecta velocities low, fail to reproduce the observed light-curve tail of SN 2009dc because of too much γ-ray trapping. We instead propose a model with ∼1 M⊙ of 56Ni and ∼2 M⊙ of ejecta, which may be interpreted as the explosion of a Chandrasekhar-mass white dwarf (WD) enshrouded by 0.6–0.7 M⊙ of C/O-rich material, as it could result from a merger of two massive C/O WDs. This model reproduces the late light curve of SN 2009dc well. A flux deficit at peak may be compensated by light from the interaction of the ejecta with the surrounding material.
INTRODUCTION
Type Ia supernovae (SNe Ia) are powerful distance indicators and have been used to infer the accelerating expansion of the Universe (Riess et al. 1998; Schmidt et al. 1998; Perlmutter et al. 1999). They are considered amongst the most promising tools to distinguish between a Cosmological Constant and other forms of Dark Energy (Goobar & Leibundgut 2011). Normal SNe Ia (Branch, Fisher & Nugent 1993) are excellently suited for this purpose owing to their remarkable homogeneity in peak luminosity and light-curve shape. However, not all SNe Ia are so ‘well behaved’. Several subclasses (e.g. Filippenko et al. 1992; Leibundgut et al. 1993; Li et al. 2003; Howell et al. 2006; Foley et al. 2010; Ganeshalingam et al. 2012) are known to defy normalization through the usual relations between light-curve width and peak luminosity (Phillips 1993; Phillips et al. 1999), one of them being the group of superluminous SNe Ia.
Compared to normal SNe Ia, superluminous SNe Ia are characterized by a bright light-curve peak, a slow light-curve evolution during the photospheric phase and moderately low ejecta velocities (Branch 2006; Howell et al. 2006; Hicken et al. 2007; Yamanaka et al. 2009; Scalzo et al. 2010; Yuan et al. 2010; Silverman et al. 2011; Taubenberger et al. 2011). Modelling suggests ejecta masses far in excess of the Chandrasekhar-mass (MCh) limit of non-rotating white dwarfs (WDs) and the production of about 1.5 M⊙ of 56Ni, precluding the interpretation of these events as thermonuclear explosions of Chandrasekhar-mass (MCh) WDs. For this reason, they are commonly referred to as ‘super-Chandrasekhar’ SNe Ia in the literature (Branch et al. 2006; Howell et al. 2006).
Models of thermonuclear explosions are severely challenged by superluminous SNe Ia. Proposed explanations range from the explosions of differentially rotating massive WDs (e.g. Howell et al. 2006) to WD mergers (Hicken et al. 2007) with possible interaction between the actual SN ejecta and surrounding circumstellar medium (CSM) left by the merger (Scalzo et al. 2010, 2012; Hachinger et al. 2012), and thermonuclear explosions in the degenerate cores of AGB stars (Taubenberger et al. 2011). However, none of these models is without problems. In particular, there is no evidence of ejecta–CSM interaction in the form of narrow emission lines in the photospheric spectra of any of these SNe. The problems to explain superluminous SNe Ia with thermonuclear explosions even led to the speculation that these objects might instead have a core-collapse origin, with the early light curve possibly powered by magnetar heating (Taubenberger et al. 2011).
Great power to discriminate different explosion scenarios has traditionally been ascribed to nebular spectra. Sampling also the inner ejecta, differences between a thermonuclear explosion and a core-collapse event should become evident in nebular spectra, given the entirely different nucleosynthetic footprint. Moreover, from late-time light curves a refined estimate of the 56Ni mass can be made, complementing the estimates based on the light-curve peak.
So far, only few late-time observations of superluminous SNe Ia have been published. For SNe 2007if (Scalzo et al. 2010; Yuan et al. 2010) and 2009dc (Yamanaka et al. 2009; Tanaka et al. 2010; Silverman et al. 2011; Taubenberger et al. 2011) nebular spectra were shown by Yuan et al. (2010); Silverman et al. (2011) and Taubenberger et al. (2011). These spectra were dominated by [Fe ii] emission lines, [Fe iii] features were quite weak. For SN 2006gz (Hicken et al. 2007) Maeda et al. (2009) presented a nebular spectrum that seemed to lack completely the prominent [Fe ii] and [Fe iii] emission lines shortward of 5500 Å, normally the hallmark features of SNe Ia at late epochs. At the same time, SN 2006gz was unexpectedly dim one year after maximum light, indicating an enhanced fading after the photospheric phase. A similar trend, though less extreme, was reported for SN 2009dc after ∼200 d (Silverman et al. 2011; Taubenberger et al. 2011).
In this work, additional late-time data of the superluminous SNe Ia SN 2007if, SN 2009dc and SNF20080723-012 (Scalzo et al. 2012) are presented and analysed. Complemented by the published data of SN 2006gz (Maeda et al. 2009), a first systematic comparison of these objects during the nebular phase is performed, revealing significant diversity in the spectral appearance and the luminosity and decline rate of the radioactive tail of the light curve. The paper is organized as follows. In Section 2, the methods used to reduce and calibrate the new data are described. Section 3 presents the late-time luminosity evolution, Section 4 the properties and peculiarities of the nebular spectra. In Section 5, the findings are discussed, synthetic bolometric light curves for a set of models are compared to the observations, and an attempt is made to propose a uniform model for at least some superluminous SNe Ia. A summary and conclusions are given in Section 6.
OBSERVATIONS AND DATA REDUCTION
The late-time data presented here were obtained with the FORS2 instrument mounted at the 8.2 m Very Large Telescope (VLT) UT-1, with XShooter at the 8.2 m VLT UT-2, and with CAFOS at the 2.2 m Telescope of the Calar Alto Observatory. The CAFOS and FORS2 data were reduced following standard procedures within iraf, including bias subtraction and flat-fielding. An optimal, variance-weighted extraction (Horne 1986) of the spectra (Table 1) was performed, and arc-lamp exposures were used to determine the dispersion solution. The XShooter observations (Table 1) were pipeline-processed1 to create linearized, sky-subtracted, wavelength-calibrated 2D spectra (for each of the UVB, VIS and NIR channels) out of the curved Echelle orders of XShooter. The 2D spectra were then optimally extracted. Telluric-feature removal and a rough flux calibration were accomplished using observations of spectrophotometric (UVB, VIS) or telluric [near-infrared (NIR)] standard stars. The flux calibration of all optical spectra was checked against the photometry and adjusted when necessary. Lacking contemporaneous photometry, this was not possible for the XShooter NIR spectrum, which was instead scaled to match the VIS spectrum in the region of overlap. Since this region is small, noisy and affected by the steep transmission edge of the dichroic, the obtained calibration is estimated to be no more precise than to a factor of ∼2.
Spectra of SNe 2007if, SNF20080723-012 and SN 2009dc.
| ut date | MJD | SN | Epocha | Telescope/Instrument | Setup | Exposure time |
|---|---|---|---|---|---|---|
| 2008 Sep 24 | 54 733.2 | SN 2007if | 358.2 | VLT + FORS2 | 300V | 2850 s × 2 |
| 2008 Oct 22 | 54 761.2 | SN 2007if | 384.3 | VLT + FORS2 | 300V | 2850 s × 3 |
| 2009 Apr 26 | 54 947.3 | SNF | 247.9 | VLT + FORS2 | 300V | 2880 s × 4 |
| 2009 May 22 | 54 973.9 | SNF | 272.7 | VLT + FORS2 | 300V | 2850 s × 3 |
| 2009 Jun 19 | 55 001.2 | SNF | 298.1 | VLT + FORS2 | 300V | 2850 s × 3 |
| 2010 May 10 | 55 326.2 | SN 2009dc | 371.6 | VLT + XShooter | UVB,VIS,NIR | 1350 s × 4 |
Host-galaxy subtraction
SNF20080723-012
SNF20080723-012 was located within a spiral host galaxy (Fig. 1, top). Luckily, it was sufficiently off-set from the bright spiral arms that a direct point spread function (PSF) fitting measurement was feasible under very good seeing conditions. Such conditions [∼0.5 arcsec full width at half-maximum (FWHM)] were met on 2009 May 22 with the VLT + FORS2. In the images of that night, a direct PSF-fitting measurement of the SN magnitudes was performed. At the same time, the PSF-subtracted images were used as pseudo-templates to perform a host-galaxy subtraction at earlier epochs when the seeing conditions were poorer. The possible error introduced by residual SN flux in the pseudo-templates is estimated to be small ( ≲ 0.1 mag) for the VLT photometry of 2009 April 26 and negligible for the earlier Calar Alto photometry.
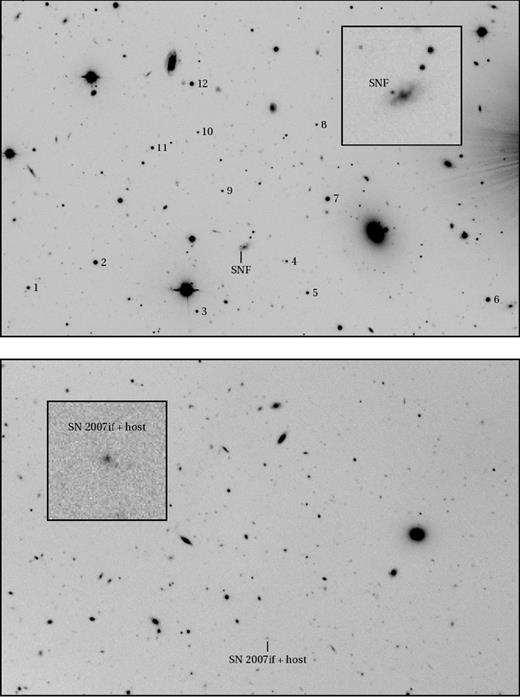
V-band image of the SNF20080723-012 field (top panel) and I-band image of the SN 2007if field (bottom panel), taken with the VLT UT-1 + FORS2 on ut 2009 May 22 and 2008 September 24, respectively. The fields of view are 4.2 × 2.7 arcmin2, and the regions around the SNe are triply enlarged in the insets. North is up and east to the left. The local sequence stars around SNF20080723-012 (Table A1) are indicated.
SN 2007if
Background contamination is a more severe problem in the late-time observations of SN 2007if. Its dwarf host galaxy at redshift z = 0.074 has an almost stellar PSF, and the SN has no discernible offset (Fig. 1, bottom; see also Childress et al. 2011). By the time of our observations, the SN had faded below the brightness of the host. Accordingly, PSF-fitting magnitudes were dominated by host-galaxy light, and the extracted spectra showed clear evidence of an underlying continuum.
The continuum in the spectra was removed by rescaling and subtracting a spectral template of the host galaxy as presented by Childress et al. (2011). In doing so, we assumed near zero flux in those spectral regions where emission lines from the SN are not expected.
Since no sufficiently deep imaging templates were available in our photometric bands to perform a conventional template subtraction, we applied what may be called a numerical host subtraction. To this aim, we derived synthetic host magnitudes in the BVRI bands from the host-galaxy spectral template of Childress et al. (2011), scaled to match the g-band magnitude of the 07if host as reported by the same authors and Scalzo et al. (2010). We then measured the ‘SN + host’ magnitudes in our VLT images using aperture photometry with a 2.5 arcsec radius, large enough to include virtually all the light from the host (and the high-z background galaxy reported by Childress et al. 2011). Subtraction of the synthetic host fluxes from the ‘SN + host’ fluxes finally yielded SN magnitudes in each band.2
Since the method described above is very sensitive to errors related to the measurement or calibration of either the ‘SN + host’ or host magnitudes, it provided questionable results in bands where the SN contribution was small compared to that of the host. We therefore decided to calibrate only the V-band SN magnitude in this way, since this is the band where the strongest emission lines are located in nebular SN Ia spectra at z = 0.074, and where therefore the contrast between the SN and the background is best. Our B, R and I magnitudes were instead synthesized from our background-subtracted, flux-calibrated (with respect to the V-band photometry) spectrum of SN 2007if taken during the same night.
Photometric calibration; S- and K-correction
Our single-epoch photometry of SN 2007if was obtained under photometric conditions, and the zero-points were derived from a Stetson (2000) standard field observed on the same night. For SNF20080723-012, we had four epochs of photometry, not all of them obtained in photometric conditions. Therefore, a sequence of stars in the SN field (indicated in Fig. 1, top) was calibrated with respect to Stetson (2000) standards observed during the photometric nights on 2009 April 26 and May 22 (Table A1). The SN magnitudes in all individual nights were then determined relative to this sequence of stars.
To correct for deviations of the instrumental filter responses from the standard Johnson–Cousins systems (Bessell 1990) and the non-negligible redshift of our targets, S- and K-corrections (Table A2) were derived from our nebular spectra and applied to the SN photometry. Since our photometric observations of SNF20080723-012 started already 55 d after the B-band maximum, but we had no spectra at that epoch, we instead used a spectrum of SN 2007if [actually a combination of the +51 d, +62 d and +67 d spectra presented by Scalzo et al. (2010)] to calculate the S- and K-corrections. The S- and K-corrections for the 187 d photometry of SNF20080723-012 were then derived by linear interpolation between the 55 d and 248 d values.
The final, S- and K-corrected magnitudes of SN 2007if and SNF20080723-012 are given in Table 2, along with their associated photometric errors.
S- and K-corrected photometry of SN 2007if and SNF20080723-012.
| ut date | MJD | SN | Epocha | B | V | R | I | Telescope | Seeingb |
|---|---|---|---|---|---|---|---|---|---|
| 2008 Sep 24 | 54 733.2 | SN 2007if | 358.2 | 24.89 ± 0.65c | 24.79 ± 0.41 | 25.14 ± 0.65c | 24.36 ± 0.65c | VLT | 1.0 |
| 2008 Sep 30 | 54 739.8 | SNF | 54.8 | 20.72 ± 0.16 | 20.23 ± 0.20 | 20.01 ± 0.10 | CAHA | 1.6 | |
| 2009 Feb 20 | 54 882.2 | SNF | 187.3 | 23.35 ± 0.30 | 23.16 ± 0.20 | 23.17 ± 0.31 | CAHA | 1.2 | |
| 2009 Apr 26 | 54 947.4 | SNF | 248.0 | 24.18 ± 0.17 | 23.92 ± 0.14 | 24.76 ± 0.12 | 24.02 ± 0.17 | VLT | 0.7 |
| 2009 May 22 | 54 973.2 | SNF | 272.0 | 24.40 ± 0.14 | 24.28 ± 0.12 | 25.25 ± 0.22 | 24.69 ± 0.21 | VLT | 0.5 |
aPhase in rest-frame days with respect to B-band maximum [MJD = 54 348.4 for SN 2007if (Scalzo et al. 2010) and MJD = 54 680.9 for SNF20080723-012 (Scalzo et al. 2012)]. bStellar FWHM (arcsec). cMagnitudes obtained from an integration of the redshift-corrected and flux-calibrated spectrum with Bessell BRI filters.
LUMINOSITY EVOLUTION
Absolute BVRI light curves of the candidate super-Chandrasekhar SNe 2006gz, 2007if, 2009dc and SNF20080723-012 are presented in Fig. 2, and compared to those of SNe 2003du and 1991T as prototypes of a normal and a luminous SN Ia, respectively. The absolute magnitudes shown in that figure were computed using the distance moduli and colour excesses reported in Table 3.
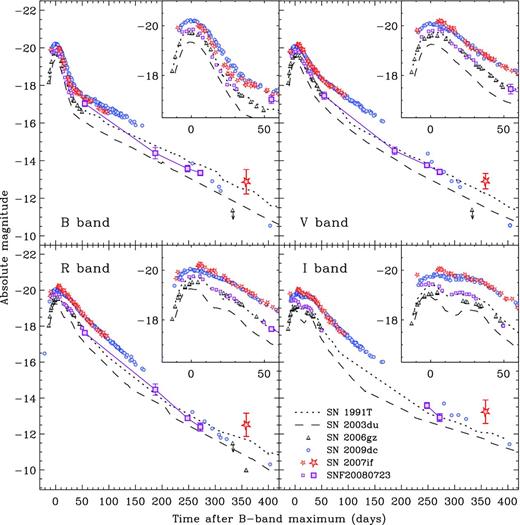
Absolute BVRI light curves of the proposed super-Chandrasekhar SNe 2006gz (Hicken et al. 2007; Maeda et al. 2009), 2007if (Scalzo et al. 2010), 2009dc (Silverman et al. 2011; Taubenberger et al. 2011) and SNF20080723-012 (Scalzo et al. 2012), the ‘classical’ luminous SN Ia 1991T (Lira et al. 1998; Altavilla et al. 2004) and the normal SN Ia 2003du (Stanishev et al. 2007). Large symbols with error bars are data newly presented in this work (Table 2). The phase is given in rest-frame days with respect to B-band maximum.
Basic properties of proposed super-Chandrasekhar SNe Ia.
| SN 2006gz | SN 2007if | SNF20080723-012 | SN 2009dc | |
|---|---|---|---|---|
| Redshift zhel | 0.0237a | 0.0742b | 0.0745b | 0.0214c |
| Distance modulus μ (mag) | 35.03 ± 0.06d | 37.45 ± 0.05b | 37.46 ± 0.05b | 34.86 ± 0.08c |
| Colour excess E(B − V) (mag) | 0.18 ± 0.05a | 0.079d, e | 0.064e | 0.17 ± 0.07c |
| Δm15(B) | 0.69 ± 0.04a | 0.71 ± 0.06d | 0.93 ± 0.04f | 0.71 ± 0.03c |
It can readily be seen from the panels of Fig. 2 that for all SNe the late-phase B-, V-, R- and I-band light curves are quite similar to one another, so that the important trends are preserved when moving on to bolometric light curves. We therefore limit ourselves to discussing in detail the pseudo-bolometric light curves of all the objects, which are presented in Fig. 3. They were obtained by transforming the absolute magnitudes into monochromatic luminosities at the effective wavelengths of the filters, interpolating the spectral energy distribution linearly and integrating over wavelength. Zero flux was assumed at the integration boundaries (i.e. the blue edge of the B band and the red edge of the I band). The resulting BVRI bolometric light curves are expected to account for ∼50–75 per cent of the total bolometric flux at maximum light when the IR contributes ∼10 per cent in SN 2009dc (Taubenberger et al. 2011) and ∼10–15 per cent in normal SNe Ia (Mezrag et al. in preparation), and the UV contribution blueward of the U band should have dropped below the 10 per-cent level (Silverman et al. 2011). At late phases, we may miss a significant amount of IR flux, but lack of late-time IR photometry of superluminous SNe Ia prevents a more quantitative assessment.
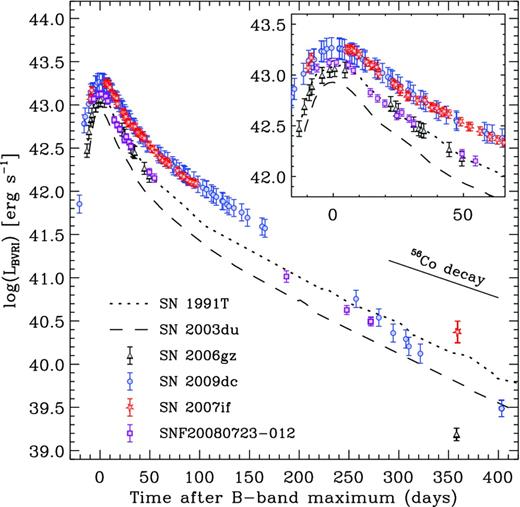
BVRI-integrated pseudo-bolometric light curves of the same SNe as in Fig. 2. The peak phase is enlarged in the inset. Epochs are given in rest-frame days after B-band maximum.
Focusing on the early light curves (inset in Fig. 3), SN 2003du has the narrowest and least luminous peak (|$L_{BVRI}^\mathrm{\,max}\sim 0.8\times 10^{43}$| erg s−1) in our sample of objects, in line with the expectations for a normal SN Ia. SN 1991T is clearly more luminous and more slowly declining than SN 2003du, and interestingly quite similar to the proposed super-Chandrasekhar SNe 2006gz and SNF20080723-012 (see also Scalzo et al. 2012). These three SNe reach peak luminosities of |$L_{BVRI}^\mathrm{\,max}\sim 1.2\times 10^{43}$| erg s−1. Finally, SNe 2007if and 2009dc outshine all the other SNe, being more than twice as luminous as SN 2003du at peak (|$L_{BVRI}^\mathrm{\,max}\sim 1.9\times 10^{43}$| erg s−1). The early-time pseudo-bolometric light curves of these two objects are essentially identical.
During the early nebular phase, between ∼100 and 200 d after maximum, all SNe evolve as expected from their behaviour around peak brightness. SNe 2007if and 2009dc, which feature the brightest peak, are also most luminous at these phases. SNF20080723-012 and SN 1991T lie between normal SNe Ia and SNe 2007if and 2009dc. The light-curve decline of all these SNe is quite similar, a bit faster in normal SNe Ia and a bit slower in the superluminous SNe, but always somewhat faster than the decay rate of 56Co, which is expected in the case of increasing γ-ray losses. No data are available for SN 2006gz during the early nebular phase.
The simple hierarchical picture that seems to emerge from studying the luminosity evolution out to ∼200 d, however, does not easily fit the data thereafter. SNe 2003du, 1991T, 2007if and SNF20080723-012 still decline with a nearly constant slope between 200 and 400 d after maximum. Among these SNe the luminosity differences observed at earlier times are approximately preserved, though SNF20080723-012 now appears a little fainter than SN 1991T. SN 2006gz, on the other hand, fades dramatically sometime between the peak phase and the nebular phase (Maeda et al. 2009), and a year after the explosion it is a factor of ∼4 less luminous than the normal SN Ia 2003du and almost an order of magnitude less luminous than SN 1991T. SN 2009dc seems to share the destiny of SN 2006gz, though to a lesser extent. Around 200 d after maximum, its light curve starts to decline more rapidly than before (Silverman et al. 2011; Taubenberger et al. 2011), and, while not fading as rapidly as SN 2006gz, at 400 d after maximum it is no longer more luminous than SN 2003du.
SPECTROSCOPIC COMPARISON
Nebular spectra of our sample of superluminous SNe Ia, SN 1991T and SN 2003du are shown in Fig. 4. In general, the spectral evolution during the nebular phase is slow, but not negligible. Since the spectra in Fig. 4 have been taken at very different epochs, evolutionary effects and intrinsic differences between SNe have to be disentangled. This is straightforward for those objects for which multi-epoch spectroscopy is available.
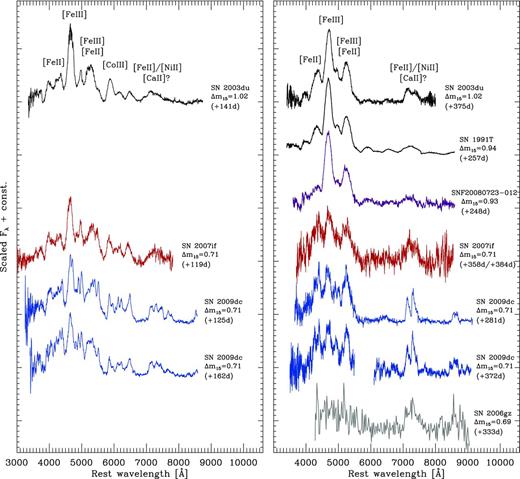
Nebular spectra of SNe 2007if (Blondin et al. 2012; this work), 2009dc (Silverman et al. 2011; Taubenberger et al. 2011; this work) and SNF20080723-012 (this work; cf. Table 1), compared to those of the proposed super-Chandrasekhar SN 2006gz (Maeda et al. 2009), the luminous SN Ia 1991T (Gómez & López 1998) and the normal SN Ia 2003du (Stanishev et al. 2007). Phases are given in rest-frame days with respect to B-band maximum. Left panel: spectra ∼120–160 d after maximum. For presentation purposes, the spectrum of SNe 2007if and the +162 d spectrum of SN 2009dc have been smoothed by 500 and 2500 km s−1, respectively. Right panel: spectra ∼250–400 d after maximum. The two spectra of SN 2009dc and the spectra of SN 2007if and SNF20080723-012 have been smoothed by 300, 1300, 1000 and 1000 km s−1, respectively. The gap in the +372 d spectrum of SN 2009dc is the region between the XShooter UVB and VIS channels, with very low signal in both.
Concentrating first on the early nebular phase (left-hand panel of Fig. 4), we see that the superluminous SNe Ia 2007if and 2009dc are relatively similar to each other and also to the normal SN Ia 2003du. The same [Fe iii], [Fe ii] and [Co iii] emission lines are detected in all three SNe (see e.g. Maeda et al. 2010; Mazzali et al. 2011, for a detailed identification of emission lines in nebular SN Ia spectra). Differences are evident in the width of spectral features, with many lines being resolved into double or multiple peaks in SN 2009dc that are just blended into a single broad feature in SN 2003du. Also the ionization state is noticeably different, with weaker [Fe iii] and more prominent [Fe ii] lines in SN 2009dc compared to SN 2003du. In both respects, SN 2007if takes an intermediate position between SNe 2003du and 2009dc, but in terms of ionization closer to SN 2009dc.
During the later nebular phase (right-hand panel of Fig. 4), the observed differences become more pronounced. In normal SNe Ia such as SN 2003du, the most important evolution between four months and one year after the explosion is the fading of Co emission lines due to the radioactive decay of 56Co into 56Fe with t1/2(56Co) = 77.2 d (Kuchner et al. 1994). The same is also observed in the superluminous SNe 2007if and 2009dc, but here a lower ejecta ionization state is seen as an additional effect. The hallmark feature of nebular SN Ia spectra, the prominent [Fe iii] blend at ∼4700 Å (Axelrod 1980; Spyromilio et al. 1992; Mazzali et al. 1998), is merely a stump in SNe 2007if and 2009dc. Instead, most of the emission blueward of 5500 Å probably originates from [Fe ii] transitions.
In normal SNe Ia, the features between 7000 and 7500 Å are attributed to forbidden transitions of iron-group elements (IGEs), notably [Fe ii] λ7155 and [Ni ii] λ7378, which often form a double-peaked structure as observed in SN 2003du (Maeda et al. 2010; Tanaka et al. 2011). In the nebular spectrum of SN 1991T, otherwise very similar to that of SN 2003du, there is only a single, rounded, broad peak from 7000 to 7500 Å, which may be the effect of a distribution of IGEs out to higher velocities in SN 1991T (Mazzali, Danziger & Turatto 1995). In SNe 2007if and 2009dc, the emission in that region is stronger than that in the previously mentioned objects. The SN 2007if spectrum is too noisy to study the line profiles in detail, but in SN 2009dc there are two pronounced, sharp emission peaks. The blue peak can be explained by [Fe ii] λ7155, whereas the redder at ∼7305 Å is not at the right position for [Ni ii] λ7378 emission. We instead suggest a significant contribution of [Ca ii] λλ7291, 7324. These lines are typically weak or absent in normal SNe Ia, but have been identified in peculiar SNe Ia, in particular in subluminous, 91bg-like events (Mazzali et al. 1997; Mazzali & Hachinger 2012). The fact that in SN 2009dc the 7000 to 7500 Å region shows an unusual triple-peaked structure at phases around day 150 (Fig. 4, left-hand panel) suggests that [Ca ii] emission might be present already at those epochs and strengthen with time.
The nebular spectrum of SN 2006gz shares similarities with those of SNe 2007if and 2009dc, especially in the strength of the 7000 to 7500 Å emission. However, the flux in the blue part of the spectrum is strongly suppressed, and individual features cannot be identified as a consequence of the low signal-to-noise ratio. Note that the SN 2006gz spectrum as presented here and in Maeda et al. (2009) is binned over 16 px/22 Å. The SNF20080723-012 spectrum, on the other hand, is very similar to the spectrum of SN 1991T, including the broad single-peaked emission between 7000 and 7500 Å. It thus deviates strongly from the spectra of the other proposed super-Chandrasekhar SNe Ia. Taking into account the light-curve properties discussed in the previous section, one may therefore speculate that SNF20080723-012 might be a 91T-like object rather than a true member of the class of ‘super-Chandrasekhar’ SNe Ia, as already discussed by Scalzo et al. (2012).
At NIR wavelengths (Fig. 5) only a few features can be safely identified in the spectrum of SN 2009dc as a consequence of the low signal-to-noise ratio. The detected [Fe ii] 1.257, 1.279 μm, [Fe ii] 1.533 μm / [Co ii] 1.547 μm and [Fe ii] 1.644 μm emission lines are characteristic of nebular NIR spectra of SNe Ia, and prominent also in the normal SN Ia 1998bu (Spyromilio et al. 2004) which is included in Fig. 5 for comparison. A contribution of [Si i] 1.646 μm to the 1.64 μm line (e.g. Mazzali et al. 2011) cannot be excluded in SN 2009dc, though the feature is not stronger than in SN 1998bu where it was explained by [Fe ii] alone (Spyromilio et al. 2004). An additional emission feature is identified in SN 2009dc at ∼1.17 μm, which has no discernible counterpart in SN 1998bu. It is located in a region devoid of strong telluric absorptions, and is similarly pronounced as other lines discussed before. Hence, we tend to believe that it is not a mere reduction artefact, but cannot provide a conclusive identification without detailed modelling.
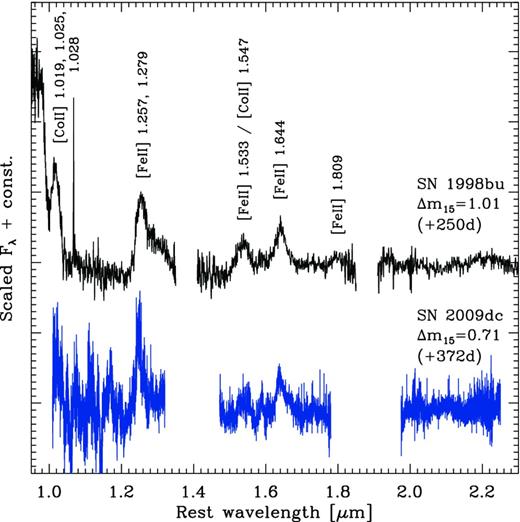
Nebular NIR spectrum of SN 2009dc, compared to the normal SN Ia 1998bu (Spyromilio et al. 2004). Phases are given in rest-frame days with respect to B-band maximum. The spectrum of SN 2009dc has been smoothed by 2000 km s−1, and regions with strong telluric features are omitted.
DISCUSSION
Ionization state in the nebular phase
The ionization state of SN Ia ejecta during the nebular phase can be assessed by studying the flux ratio of the emission blends close to 4700 and 5200 Å. As discussed in detail e.g. by Mazzali et al. (2011), the 4700 Å blend is clearly dominated by [Fe iii] emission, whereas the 5200 Å blend has a significant contribution of [Fe ii] next to [Fe iii], making the ratio a sensitive ionization indicator. In order to reproduce the large observed λ4700/λ5200 ratio in the normal or slightly subluminous SN 2003hv with synthetic spectra, Mazzali et al. (2011) had to assume a reduced central density compared to that of the one-dimensional Chandrasekhar-mass explosion model W7 (Nomoto, Thielemann & Yokoi 1984), leading these authors to speculate about a sub-Chandrasekhar-mass or merger origin of SN 2003hv. In an analogous way, the low ionization found in SNe 2007if and 2009dc might be indicative of high central ejecta densities, leading to enhanced recombination. This should be a direct consequence of the low ejecta expansion velocities determined from both early- and late-time spectra (Yamanaka et al. 2009; Scalzo et al. 2010; Silverman et al. 2011; Taubenberger et al. 2011; see also Section 4).
In Fig. 6, the flux ratio of the emission lines near 4700 and 5200 Å is investigated as a function of Δm15(B) (which in normal SNe Ia may be taken as a proxy for the peak luminosity; see Phillips 1993). Normal and 91T-like SNe (including SNF20080723-012) show flux ratios between 1.3 and 1.9, SNe 2007if and 2009dc between 1.0 and 1.1. The only other SNe with similarly low flux ratios (and hence ionization) are subluminous 91bg-like SNe. Their nebular spectra, however, show a complex structure with very narrow [Fe iii] lines superimposed on broad [Fe ii] emission (Mazzali et al. 1997; Mazzali & Hachinger 2012).
![Relation between Δm15(B) and the flux ratio of the [Fe iii] / [Fe ii] emission lines near 4700 and 5200 Å, determined in the nebular spectra closest to day 300 after maximum. The line fluxes have been measured from zero intensity through a multiple-Gaussian deblending of the 4500–5500 Å region as described by Mazzali et al. (1998). The red symbols stand for subluminous SNe Ia, blue symbols for proposed super-Chandrasekhar events and black symbols for normal or 91T-like SNe Ia.](https://oup.silverchair-cdn.com/oup/backfile/Content_public/Journal/mnras/432/4/10.1093_mnras_stt668/1/m_stt668fig6.jpeg?Expires=1750417800&Signature=dbqIx8lm1lRp-gOItlaq~uVp1zScwqBHqc1CYXanrT3VZqvY78cMCMtL7FIhWZZw2ZlaeL-HQJ5N1OfOVZzSxABn6~oOh4Q37QXwGjwUma3J03FQ-k~qoa2PsHK5GiOzyObNoomvdHW5HGaujRjmnDe1juRITKJbbS0i6UW4mTIh2IXJszsZ~nN~n96A2SqXxJ-WACdrKUQY-v3kBged~bFGiQDf39XqlN7day2K8a-ez-Pjhs0a7OF1NGqMEqYMb4ETIUlhxYZ6HZHAiTHCcCz7vrwcnYaGGZW6R9p5yNj5br8pVvEIe6eGkUsxFQ7QHAm0A7UH2gQLzy5ykqV4AA__&Key-Pair-Id=APKAIE5G5CRDK6RD3PGA)
Relation between Δm15(B) and the flux ratio of the [Fe iii] / [Fe ii] emission lines near 4700 and 5200 Å, determined in the nebular spectra closest to day 300 after maximum. The line fluxes have been measured from zero intensity through a multiple-Gaussian deblending of the 4500–5500 Å region as described by Mazzali et al. (1998). The red symbols stand for subluminous SNe Ia, blue symbols for proposed super-Chandrasekhar events and black symbols for normal or 91T-like SNe Ia.
The inferred low ionization is also consistent with the likely detection of [Ca ii] λλ7291, 7324. The first and second ionization potentials of Ca are lower than those of Fe. Accordingly, in regions with significant Fe iii content, Ca should be doubly ionized to almost 100 per cent, which is probably why [Ca ii] lines are absent from the nebular spectra of normal SNe Ia. The lower ionization in superluminous and 91bg-like SNe Ia, however, should favour Ca ii as the dominant ionization state. Indeed, [Ca ii] emission is observed in exactly those objects.
Late-time dust formation
In Section 3, we discussed the diverse light-curve decline of superluminous SNe Ia at late phases. Once on the radioactive tail ∼50 d after maximum light, SN 2007if fades at a nearly constant rate for more than 300 d. SN 2009dc shows a steeper decline after ∼200 d, and is about a factor of 3 less luminous than SN 2007if after one year, though it had the same peak luminosity (Fig. 3). SN 2006gz fades even more rapidly, being about a factor of 15 less luminous than SN 2007if one year after maximum, though the difference at peak was merely a factor of 1.6.
Following the reasoning of Taubenberger et al. (2011), the accelerated decline observed in the BVRI-bolometric light curve of SN 2009dc (and probably also SN 2006gz) at those late phases is unlikely to be a true bolometric effect. As long as the light-curve tail is powered by radioactive decay and positrons are fully trapped, the decline may slow down (when a longer lived radioactive isotope starts to dominate the energy deposition), but not accelerate (cf. Ruiz-Lapuente & Spruit 1998 for the case of incomplete positron trapping). Instead, the observed luminosity drop is probably the outcome of flux redistribution into regimes that are not observed, most likely the IR. This could be accomplished by an early IR catastrophe or by dust formation.
Though never observed in SNe Ia to date, an IR catastrophe (Axelrod 1980; Fransson, Houck & Kozma 1996) is an inevitable consequence of the decreasing energy deposition by radioactive decay and the expansion of the SN ejecta. Below a critical temperature Tc, the upper levels of forbidden transitions in the optical and NIR can no longer be populated. The cooling is henceforth dominated by ground-state fine-structure transitions of Fe in the mid- and far-IR, accompanied by a rapid temperature decrease of the ejecta. An IR catastrophe is favoured by low densities (as a consequence of the density dependence of Tc). In the high-density ejecta of SN 2009dc, an early onset of the IR catastrophe is therefore not expected. Moreover, even one year after maximum, when the BVRI-bolometric luminosity of SN 2009dc is already significantly below that of SN 2007if, the spectra are still similar, showing prominent [Fe ii] emission throughout the optical and NIR wavelength range.
Dust formation, on the other hand, is usually associated with core-collapse SNe and has rarely been discussed in the context of thermonuclear SNe (Nozawa et al. 2011). In superluminous SNe Ia, however, it seems to be compatible with observations. Early-time spectra of SNe 2006gz and 2009dc show C ii lines with a strength unprecedented in thermonuclear SNe. This suggests that at least a moderate amount of carbon is present in the ejecta (Hachinger et al. 2012 reproduced the spectral time series of SN 2009dc with carbon mass fractions between 1 and 10 per cent). The carbon may give rise to the formation of graphite dust, but can also pave the way for dust formation in general through prior CO molecule formation, which opens an efficient cooling channel, the emission in molecular bands. Dust formation should also be promoted by the comparatively high densities that the slowly expanding ejecta of superluminous SNe retain at late phases (Nozawa et al. 2011). The luminosity drop in SN 2009dc comes along with an evolution towards redder colours (Fig. 2), again consistent with dust formation. Interestingly, even the seemingly unique nebular spectrum of SN 2006gz with its apparent lack of features in the blue could find a natural explanation within this scenario. This is shown in Fig. 7, where the late-time spectra of SNe 2007if and 2009dc have been artificially reddened to simulate the effect of more pronounced dust formation in SN 2006gz. Nothing can be said about individual features blueward of ∼6000 Å since the spectrum of SN 2006gz is too noisy in that region, but from the overall spectral shape it is plausible that the late-time spectra of SNe 2006gz, 2007if and 2009dc are all intrinsically similar, and differ just by the amount of reddening caused by newly formed dust in the ejecta.
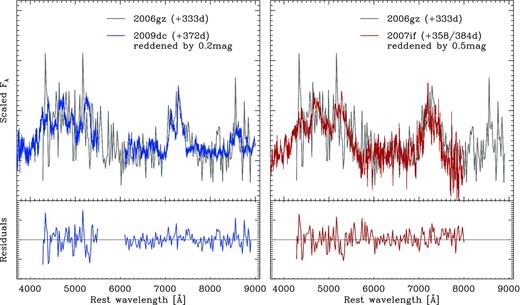
Comparison of the late-time spectrum of SN 2006gz with that of SN 2009dc, artificially reddened by E(B − V) = 0.2 mag (upper-left panel), and that of SN 2007if, artificially reddened by E(B − V) = 0.5 mag (upper-right panel; RV = 3.1 assumed in both cases). The residuals after subtracting the spectra (lower panels) hardly show any differences exceeding the noise level.
Note that changes in the profiles of nebular emission lines, usually another signature of dust formation within the ejecta, are neither observed nor expected in SN 2009dc. If dust formation occurs, it would be most effective in the carbon- and silicon-rich zones, which, according to the velocity evolution of the C ii λ6580 and Si ii λ6355 lines presented by Taubenberger et al. (2011), should be located outside ∼6000 km s−1. The [Fe ii] emission in the nebular spectrum of SN 2009dc, however, comes from below 6000 km s−1; emission above that velocity would result in the nebular lines being too broad. Accordingly, all parts of the nebular [Fe ii] emission would be attenuated by the same amount.
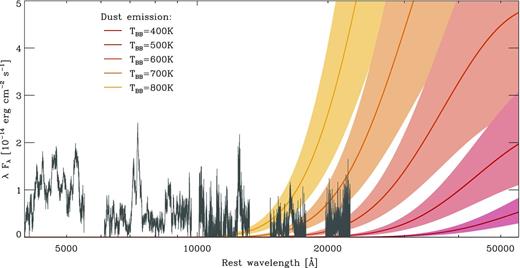
Nebular (+372 d) spectrum of SN 2009dc, corrected for the Galactic and host-galaxy reddening of E(B − V) = 0.17 mag. The solid lines are blackbody spectra for temperatures TBB between 400 and 800 K, assuming emission from a thin dust shell at 8000 km s−1. The lighter shaded regions show the effect of varying the shell location between 6000 and 10 000 km s−1. It appears that a dust temperature of ≥700 K is excluded by a comparison to the observed NIR spectrum of SN 2009dc.
In the end, mid-IR observations of superluminous SNe Ia during the nebular phase will be the only way to prove or disprove dust formation on solid grounds. If dust forms, excess emission in the mid IR with a thermal spectral energy distribution should be detected.
Bolometric light-curve models
The bolometric light curves presented in Section 3 can serve as a benchmark for models proposed for superluminous SNe Ia. To enable such a model–data comparison, we have computed synthetic bolometric light curves for a number of models using the Monte Carlo radiative-transfer code artis (Kromer & Sim 2009). Full spectral calculations at late phases are not possible with artis, since non-thermal processes and a detailed treatment of collisions and forbidden transitions are presently not implemented. However, for the late-phase bolometric light curve, the deposition of γ-rays and positrons is the only relevant physical process. This is treated with sufficient accuracy in artis. We have run our calculations with a simple grey optical opacity (Sim 2007), which is a good approximation for the late bolometric light curve when time-dependent effects are negligible (Cappellaro et al. 1997). The rise time, the detailed shape of the light-curve peak and the peak luminosity, however, may be altered by this approximation.
For our light-curve calculations, we have used the same models as in Hachinger et al. (2012). These authors used early-time spectra of SN 2009dc to perform a tomographic study of the outer layers of the ejecta for three explosion scenarios. The first type of model investigated is the detonation of a rotating supermassive WD with 2 M⊙, represented by an AWD3det-based density structure (Pfannes, Niemeyer & Schmidt 2010; Fink et al. in preparation). The two alternative scenarios are a possible core-collapse origin of SN 2009dc, represented by an empirically derived exponential density structure with 3 M⊙ (‘09dc-exp’), and a model where part of the luminosity is assumed to be generated by CSM interaction, based on the W7 (Nomoto et al. 1984) density structure with 1.4 M⊙ of ejecta but a rescaled kinetic energy (‘09dc-int’). For the AWD3det-based model, Hachinger et al. (2012) were not able to obtain a consistent solution: the line velocities in the synthetic spectra were too high, and the inferred abundance structure was inconsistent with the kinetic energy of the underlying density profile. Accordingly, this model was disfavoured on the basis of the early spectral evolution. For the 09dc-exp and 09dc-int models, on the other hand, more plausible solutions could be obtained.
In their tomographic study, Hachinger et al. (2012) used the luminosity mostly as a free parameter. Synthetic bolometric light curves thus provide an additional constraint on the structure of the SN by constraining the total energy of the explosion. To compute bolometric light curves for the models of Hachinger et al. (2012), an assumption had to be made for the inner core of the ejecta (below ∼4000 km s−1) whose composition was not constrained by the tomography. Here we kept the mass fraction of stable iron the same as in the innermost shell studied by Hachinger et al., and filled the rest with 56Ni.
Fig. 9 shows synthetic bolometric light curves of the 09dc-exp model (top panel) and the 09dc-int model (middle panel), compared to the UBVRIJHK pseudo-bolometric luminosity evolution of SN 2009dc as presented by Taubenberger et al. (2011). Clearly, the 09dc-exp model manages to reproduce the peak luminosity of SN 2009dc (which is a consequence of the large 56Ni mass of almost 1.6 M⊙), but it is also evident that the radioactive tail is much too bright in the model owing to the large total mass of 3 M⊙ that leads to strong γ-ray trapping. This is further illustrated by the red and purple lines in Fig. 9, which give the individual contributions of energy deposited by γ-rays and positrons, respectively. The intersection thus marks the epoch where the γ-ray trapping has decreased to ∼3 per cent, which is approximately the fraction of 56Co decay energy carried by positrons. In 09dc-exp this level is reached very late, ∼440 d after the explosion. In contrast, the 09dc-int model fails to reach the observed peak luminosity of SN 2009dc by quite some margin, though in this case by purpose: the remainder is supposed to be generated by ejecta–CSM interaction, and not included in the synthetic bolometric light curve that shows only the contribution from radioactive decay. However, also the light-curve tail of 09dc-int seems much too dim at phases between 100 and 200 d when the spectra with their lack of pseudo-continuum emission do not support significant ejecta–CSM interaction (Taubenberger et al. 2011). The model, as considered here, has only Chandrasekhar mass, i.e. it represents the exploded WD without any swept-up material (cf. Hachinger et al. 2012). The low mass leads to inefficient γ-ray trapping (reaching 3 per cent already 280 d after the explosion), insufficient to explain the observed luminosity between 100 and 200 d.
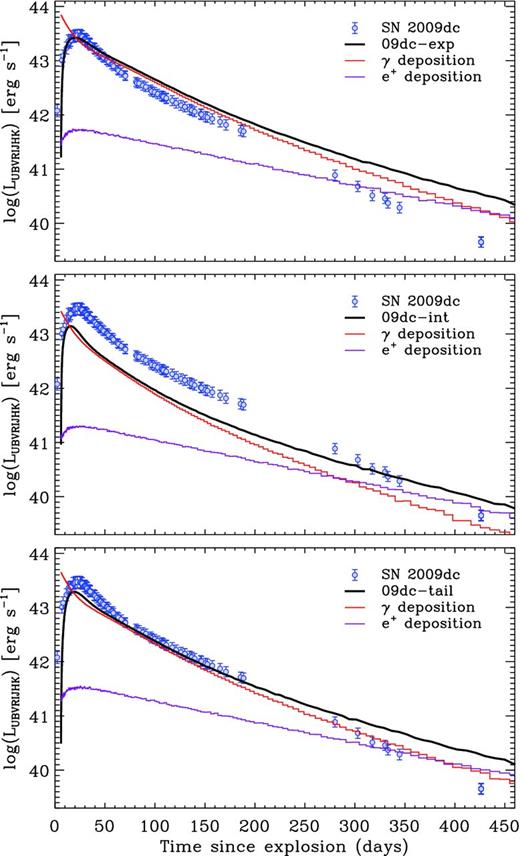
Synthetic bolometric light curves (black solid lines) for different models compared to the observed UBVRIJHK-bolometric light curve of SN 2009dc (Taubenberger et al. 2011, blue (in online version) data points, assuming a B-band rise time of 23 d). The contributions of γ-rays (red solid lines in online version) and positrons (purple solid lines in online version) to the synthetic bolometric light curves are shown individually.
Top panel: the 09dc-exp model of Hachinger et al. (2012).
Middle panel: the 09dc-int model of Hachinger et al. (2012).
Bottom panel: 09dc-tail (∼2 M⊙ of ejecta, ∼1 M⊙ of 56Ni).
We now test whether the shortcomings of 09dc-int in fitting the light-curve tail before the break at ∼200 d can be overcome by adding more mass. To this end, we have constructed a new model, ‘09dc-tail’ (Table 4 and bottom panel of Fig. 9). Its density profile ρ(v) is a moderately steep exponential for v ≥ 2500 km s−1, but flattens below that velocity. This results in a total ejecta mass of ∼2 M⊙, and a kinetic energy of 1.2 × 1051 erg. The density profile of 09dc-tail is shown in Fig. 10, together with those of 09dc-exp and 09dc-int. The 56Ni mass of 09dc-tail was adjusted to be 1 M⊙, more than in 09dc-int (∼0.6 M⊙) but significantly less than in 09dc-exp (∼1.6 M⊙). Thanks to the fairly steep density profile and the high ejecta mass, the γ-ray opacity is large, resulting in 3 per cent γ-ray trapping at 390 d after the explosion. The bolometric light curve of the model provides a very good fit to the data of SN 2009dc between 60 and 190 d after the explosion. The model remains more luminous than SN 2009dc at later epochs, but as discussed in the previous section this may be due to a significant IR flux that was missed when the pseudo-bolometric light curve of SN 2009dc was constructed from the observed bands. As 09dc-int, the model does not reach the observed peak luminosity of SN 2009dc. It peaks at a flux 30–40 per cent too low.
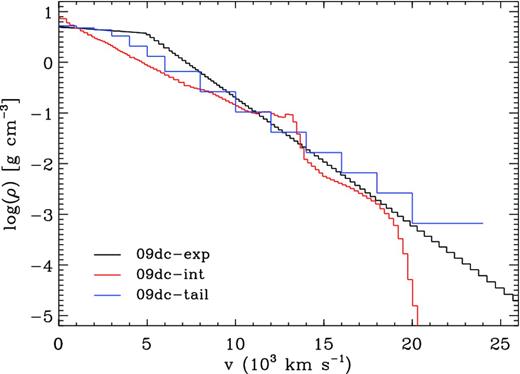
Density profiles of the models shown in Fig. 9, evaluated at a reference time of 100 s after the explosion.
Density profile and element abundances of 09dc-tail. The total mass of the model, 2.06 M⊙, is distributed to C (0.24 M⊙), O (0.47 M⊙), Si (0.25 M⊙), S (0.05 M⊙), Ca (0.01 M⊙), stable Fe (0.05 M⊙) and 56Ni (0.99 M⊙).
| Shell | |$v_\mathrm{out}^a$| | log (ρ)b | |$M_\mathrm{cum}^{\,c}$| | |$E_\mathrm{k,cum}^{\,d}$| | X(C) | X(O) | X(Si) | X(S) | X(Ca) | X(stable Fe) | X(56Ni) |
|---|---|---|---|---|---|---|---|---|---|---|---|
| 1 | 1000 | 0.72 | 0.011 | 6.6 × 10⁻⁵ | 0.000 | 0.000 | 0.000 | 0.000 | 0.000 | 0.050 | 0.950 |
| 2 | 2000 | 0.68 | 0.082 | 1.9 × 10⁻³ | 0.000 | 0.000 | 0.000 | 0.000 | 0.001 | 0.049 | 0.950 |
| 3 | 3000 | 0.64 | 0.256 | 0.014 | 0.000 | 0.000 | 0.000 | 0.000 | 0.002 | 0.048 | 0.950 |
| 4 | 4000 | 0.52 | 0.514 | 0.046 | 0.000 | 0.000 | 0.000 | 0.000 | 0.005 | 0.045 | 0.950 |
| 5 | 5000 | 0.32 | 0.783 | 0.101 | 0.000 | 0.000 | 0.000 | 0.000 | 0.005 | 0.045 | 0.950 |
| 6 | 6000 | 0.12 | 1.035 | 0.178 | 0.020 | 0.100 | 0.100 | 0.020 | 0.005 | 0.035 | 0.720 |
| 7 | 8000 | −0.18 | 1.447 | 0.386 | 0.100 | 0.260 | 0.400 | 0.080 | 0.005 | 0.005 | 0.150 |
| 8 | 10 000 | −0.58 | 1.718 | 0.608 | 0.236 | 0.500 | 0.200 | 0.040 | 0.002 | 0.002 | 0.020 |
| 9 | 12 000 | −0.98 | 1.878 | 0.804 | 0.318 | 0.620 | 0.050 | 0.010 | 0.001 | 0.001 | 0.000 |
| 10 | 14 000 | −1.38 | 1.967 | 0.955 | 0.393 | 0.600 | 0.005 | 0.001 | 0.000 | 0.001 | 0.000 |
| 11 | 16 000 | −1.78 | 2.015 | 1.062 | 0.499 | 0.500 | 0.000 | 0.000 | 0.000 | 0.001 | 0.000 |
| 12 | 18 000 | −2.18 | 2.039 | 1.132 | 0.499 | 0.500 | 0.000 | 0.000 | 0.000 | 0.001 | 0.000 |
| 13 | 20 000 | −2.58 | 2.051 | 1.175 | 0.499 | 0.500 | 0.000 | 0.000 | 0.000 | 0.001 | 0.000 |
| 14 | 24 000 | −3.18 | 2.059 | 1.214 | 0.499 | 0.500 | 0.000 | 0.000 | 0.000 | 0.001 | 0.000 |
aOuter boundary of the shell (km s−1). bρ in g cm−3. cCumulative mass in M⊙. dCumulative kinetic energy in 1051 erg.
Putting the pieces of the puzzle together
In the previous section, we have seen that the 09dc-exp model of Hachinger et al. (2012) significantly overestimates the radioactive tail with respect to the observations of SN 2009dc. Though this is just a single model, the consequences of this finding are far-reaching. This is because 09dc-exp is quite generic for models that try to explain the peak luminosity of superluminous SNe Ia by radioactivity (and hence need ≳1.5 M⊙ of 56Ni), and at the same time keep the kinetic energy per mass low (which requires a significant amount of unburned material and a total ejecta mass of >2.5 M⊙; see also Taubenberger et al. 2011). In these models, there is no obvious way to avoid the strong γ-ray trapping seen in 09dc-exp. The consequence is that probably all models with excessively large 56Ni masses will fail.
If this is true and the luminosity of superluminous SNe Ia around peak does not solely come from radioactive decay, other processes have to contribute. Especially ejecta–CSM interaction has to be considered as a possibility, despite the known caveats that the CSM would have to be H- and He-free in order to avoid narrow lines of those elements in the spectra of superluminous SNe Ia, and that even with a C/O CSM it is not evident that telltale spectroscopic signatures can be avoided. The 09dc-int model of Hachinger et al. (2012), as a first attempt in this direction, has too little flux during the tail phase when the interaction should have come to an end.
The 09dc-tail model has been constructed so as to improve on this aspect and reproduce the luminosity of SN 2009dc during the tail phase between 60 and 180 d after the explosion. It has been built with a physical picture in mind that is quite similar to that of 09dc-int: the kinetic energy of 1.2 × 1051 erg is typical of a normal SN Ia from a Chandrasekhar-mass WD progenitor. Also the 56Ni mass of 1.0 M⊙ is within the range normally observed in SNe Ia (Stritzinger et al. 2006), though on the upper end. While the 09dc-int model only represents the ejecta of an MCh WD, the total ejecta mass of 09dc-tail is significantly larger. The additional mass can be interpreted as swept-up circumstellar material, leading to reduced ejecta velocities and higher densities compared to a freely expanding SN Ia. At the same time, a small fraction of the kinetic energy would be transformed into light in the ejecta–CSM interaction, potentially compensating the flux deficit of the 09dc-tail model at early phases. Whether or not this may work and whether the resulting early-time spectra would resemble those of superluminous SNe Ia can only be decided in detailed radiation-hydrodynamics simulations (e.g. Blinnikov & Sorokina 2010; Fryer et al. 2010; Noebauer et al. 2012), which go beyond the scope of this work.
Nevertheless, a few estimates on the required CSM properties and a possible progenitor system can be made. The CSM would have to be H- and probably He-free, since these elements are not detected in the spectra of superluminous SNe Ia at any phase. Most likely it would instead consist of a mix of C and O, which would be naturally explained if it had been produced in a merger of two C/O WDs, with the secondary being disrupted and its material being accreted slowly on to the primary. The masses of these two WDs would have to sum up to ∼2 M⊙. At the time the accreting primary approaches MCh and explodes, it would be surrounded by 0.6–0.7 M⊙ of CSM, distributed in an extended spherical envelope supported by thermal pressure (Schwab et al. 2012; Shen et al. 2012).4 This scenario is very similar to that studied by Fryer et al. (2010), who found that in a SN Ia enshrouded by a C/O-rich CSM originating from a merger event the light curve and spectra are altered substantially by shock heating. The light-curve peak tends to become much broader and a strong UV flux is generated, a feature that is also observed in early spectra of superluminous SNe Ia (see e.g. Scalzo et al. 2010; Silverman et al. 2011; Taubenberger et al. 2011).
To reconcile the synthetic bolometric light curve of the 09dc-tail model with observations, additional luminosity from interaction is required during the first ∼60 d after the explosion (Fig. 9, bottom panel). This coincides with the duration of the peak phase, which may suggest that there is not ongoing CSM interaction over this full period of time, but that the photons are produced during an early and comparatively short interaction episode, trapped in the optically thick ejecta and released on photon-diffusion time-scales (see also Scalzo et al. 2012).
Having swept up 0.6–0.7 M⊙ of material composed of up to 50 per cent of carbon, the ejecta of such an explosion would contain at least an order of magnitude more carbon than ordinary delayed detonations of a naked MCh WD (Seitenzahl et al. 2013). The strong and persistent C ii features in the early spectra of superluminous SNe Ia would in this scenario not come as a surprise. Moreover, the same carbon might form dust at later phases, as already discussed in Section 5.2, and thus explain the luminosity drop in at least some superluminous SNe Ia during the nebular phase.
Of course, the proposed scenario is not free of problems. For example, it is not clear how much fine-tuning is necessary to produce a CSM with the right properties in a WD merger. As mentioned by Fryer et al. (2010), besides the total mass also the density profile of the circumstellar material has an enormous impact on the resulting light curves and spectra. To explain observed superluminous SNe Ia, one would need a configuration that boosts the light-curve peak for ∼60 d, slows down the light-curve evolution, but modifies the spectra only moderately, preserving most characteristic SN Ia features. Another critical point is that slow mergers of such massive WDs might not exist. The closer the mass ratio of the primary to the secondary WD is to unity, and the more massive the two WDs are, the more likely the merger will proceed violently (Pakmor et al. 2012), not leading to an extended C/O envelope. Binary population synthesis calculations do not predict primary WD masses above 1.3 M⊙ in C/O-WD mergers (Ruiter et al. 2013). To arrive at a system mass of ∼2 M⊙, both WDs hence need to be relatively massive. Finally, if non-violent mergers of C/O WDs do exist, the primary may collapse to a neutron star owing to electron captures rather than explode as an SN Ia (Saio & Nomoto 1985; Shen et al. 2012). Nonetheless, the proposed scenario of a slow merger of two massive C/O WDs that leads to an MCh SN Ia explosion enshrouded by a C/O-rich CSM remains a promising explanation for superluminous SNe Ia. Its biggest strength is its ability to describe many thus far seemingly decoupled properties of superluminous SNe Ia in a unified way as logical consequence of an enshrouded explosion, with no need to resort to unreasonable 56Ni and ejecta masses.
CONCLUSIONS
The late-phase photometry and spectra of a group of proposed super-Chandrasekhar SNe analysed in this work have highlighted interesting trends. The superluminous SNe 2006gz, 2007if and 2009dc are distinguished from normal and 91T-like SNe Ia by nebular spectra with very weak [Fe iii] lines and a likely contribution of [Ca ii] to the emission around 7300 Å. The ejecta of these objects are apparently not as highly ionized as in normal SNe Ia, which could be a consequence of higher densities due to rather low expansion velocities. The proposed super-Chandrasekhar object SNF20080723-012 does not share these characteristics, and is instead very similar to SN 1991T in both its nebular spectra and its light-curve evolution. We are hence inclined to consider SNF20080723-012 as a classical 91T-like object rather than postulate fundamental diversity in the late-time behaviour of superluminous SNe Ia. In fact, some diversity is present also in the late-time spectral energy distribution and light-curve decline of SNe 2006gz, 2007if and 2009dc, with two of these objects showing a light-curve break after ∼150–200 d leading to a more rapid fading thereafter. This, however, may be understood in terms of different time-scales and intensities of dust formation.
Accepting this explanation, studying the light-curve tail before the possible break (i.e., at phases when the light curves are presumably powered by radioactive decay of 56Co and opacities to optical photons are low) may be a promising way to constrain 56Ni and total ejecta masses of superluminous SNe Ia, and thus get a handle on the nature of these objects. To this end, we have compared the observed UBVRIJHK-bolometric light curve of SN 2009dc with synthetic bolometric light curves of models proposed in the literature. We find that models that have enough 56Ni to explain the light-curve peak by radioactive decay and at the same time enough mass to avoid too high ejecta velocities, are almost inevitably too luminous on the radioactive tail because of too strong γ-ray trapping. This dilemma may be overcome with models that assume additional luminosity from ejecta–CSM interaction during the peak phase. Improving on earlier work, we have presented one such toy model with ∼1 M⊙ of 56Ni and ∼2 M⊙ of ejecta that provides a convincing match to the observed light-curve tail of SN 2009dc. This model may be interpreted as a ‘normal’ SN Ia explosion of an MCh WD enshrouded by 0.6–0.7 M⊙ of C/O-rich material that is swept up as the ejecta expand. Such a configuration could be the outcome of a non-violent merger of two massive C/O WDs.
We thank the anonymous referee for their comments that helped to improve the paper. We are also grateful to K. Kawabata and K. Maeda for providing us their nebular spectrum of SN 2006gz. This work has been supported by the Transregional Collaborative Research Center TRR 33 ‘The Dark Universe’ of the Deutsche Forschungsgemeinschaft, the Excellence Cluster EXC153 ‘Origin and Structure of the Universe’, the PRIN-INAF 2009 with the project ‘Supernovae Variety and Nucleosynthesis Yields’, the programme ASI-INAF I/009/10/0 and the ARCHES prize of the German Ministry of Education and Research (BMBF). It has benefited from data taken by the European Supernova Collaboration led by SB. Observations were collected at the ESO 8.2 m Very Large Telescope UT1 and UT2 (Cerro Paranal, Chile, programmes 281.D-5043, 083.D-0728 and 085.D-0701) and the 2.2 m Telescope of the Centro Astronómico Hispano Alemán (Calar Alto, Spain). We thank the astronomers at both observatories for their support. This research made use of the Weizmann Interactive Supernova data REPository (WISeREP; Yaron & Gal-Yam 2012).
Based on observations at ESO Paranal, Prog. 281.D-5043, 083.D-0728 and 085.D-0701.
Note that Yuan et al. (2010) obtained a somewhat fainter host g-band magnitude than Scalzo et al. (2010) and Childress et al. (2011), which would result in brighter SN magnitudes. The difference between the two numbers has been taken into account in the error assigned to the host magnitude, and propagated to the error of the SN magnitudes.
When conditions are appropriate for dust formation in superluminous SNe Ia, the presence of carbon and also silicon may allow for the formation of carbonaceous dust as well as silicates (typical densities 2.2 and 3.5 g cm−3, respectively; Weingartner & Draine 2001). Given our ignorance of the exact dust composition, we assume a 1:1 mixture in our calculation; the resulting uncertainty in the estimated dust mass is less than ±25 per cent.
We emphasize that our 09dc-tail model has been constructed in a self-consistent way, in the sense that the kinetic energy of the ejecta agrees with the energy release by nuclear burning (see Table 4 for the composition) minus the binding energy of an MCh WD.
REFERENCES
APPENDIX A: TABLES
Magnitudes of the local sequence stars in the field of SNF20080723-012 (Fig. 1, top).
| ID | B | V | R | I |
|---|---|---|---|---|
| 1 | 20.97 ± 0.03 | 20.49 ± 0.02 | 20.16 ± 0.02 | 19.84 ± 0.02 |
| 2 | 20.64 ± 0.03 | 19.15 ± 0.01 | ||
| 3 | 21.53 ± 0.02 | 21.01 ± 0.03 | 20.68 ± 0.03 | 20.34 ± 0.02 |
| 4 | 22.05 ± 0.02 | 21.55 ± 0.02 | 21.24 ± 0.02 | 20.86 ± 0.03 |
| 5 | 21.55 ± 0.03 | 20.54 ± 0.02 | 19.87 ± 0.03 | 19.36 ± 0.05 |
| 6 | 19.26 ± 0.04 | 18.81 ± 0.04 | ||
| 7 | 19.52 ± 0.02 | 18.92 ± 0.02 | ||
| 8 | 23.06 ± 0.03 | 21.56 ± 0.03 | 20.40 ± 0.02 | 19.03 ± 0.06 |
| 9 | 22.66 ± 0.03 | 21.72 ± 0.02 | 21.10 ± 0.04 | 20.55 ± 0.03 |
| 10 | 22.59 ± 0.04 | 22.09 ± 0.02 | 21.80 ± 0.05 | 21.42 ± 0.06 |
| 11 | 22.00 ± 0.04 | 20.56 ± 0.02 | 19.57 ± 0.02 | |
| 12 | 20.32 ± 0.04 | 19.28 ± 0.01 |
S- and K-corrections applied to the photometry of SN 2007if and SNF20080723-012.
| MJD | SN | Epocha | SB | SV | SR | SI | KB | KV | KR | KI | Telescope |
|---|---|---|---|---|---|---|---|---|---|---|---|
| 54 733.2 | SN 2007if | 358.2 | −0.038 | 0.322 | VLT | ||||||
| 54 739.8 | SNF | 54.8 | 0.042 | −0.051 | −0.004 | −0.261 | −0.161 | 0.102 | CAHA | ||
| 54 882.2 | SNF | 187.3 | 0.051 | 0.016 | 0.009 | −0.481 | 0.273 | 0.223 | CAHA | ||
| 54 947.4 | SNF | 248.0 | −0.087 | −0.086 | −0.198 | −0.004 | −0.592 | 0.490 | 0.283 | 0.058 | VLT |
| 54 973.2 | SNF | 272.0 | −0.087 | −0.086 | −0.198 | −0.004 | −0.592 | 0.490 | 0.283 | 0.058 | VLT |
