


Abstract
We present the results of a new search for variable stars in the Local Group dwarf galaxy Leo A, based on deep photometry from the Advanced Camera for Surveys onboard the Hubble Space Telescope. We detected 166 bona fide variables in our field, of which about 60 per cent are new discoveries and 33 candidate variables. Of the confirmed variables, we found 156 Cepheids, but only 10 RR Lyrae stars despite nearly 100 per cent completeness at the magnitude of the horizontal branch. The RR Lyrae stars include seven fundamental and three first-overtone pulsators, with mean periods of 0.636 and 0.366 d, respectively. From their position on the period–luminosity (PL) diagram and light-curve morphology, we classify 91, 58 and 4 Cepheids as fundamental, first-overtone and second-overtone mode Classical Cepheids (CC), respectively, and two as Population II Cepheids. However, due to the low metallicity of Leo A, about 90 per cent of the detected Cepheids have periods shorter than 1.5 d. Comparison with theoretical models indicate that some of the fainter stars classified as CC could be Anomalous Cepheids. We estimate the distance to Leo A using the tip of the red giant branch (TRGB) and various methods based on the photometric and pulsational properties of the Cepheids and RR Lyrae stars. The distances obtained with the TRGB and RR Lyrae stars agree well with each other while that from the Cepheid PL relations is somewhat larger, which may indicate a mild metallicity effect on the luminosity of the short-period Cepheids. Due to its very low metallicity, Leo A thus serves as a valuable calibrator of the metallicity dependences of the variable star luminosities.
INTRODUCTION
Classical Cepheids (CC) are the prime distance estimators in the nearby universe thanks to the Leavitt (1908) law, which relates their brightness and period. However, their use is complicated by the existence of other types of Cepheids with different luminosities at a given period: Population II Cepheids (P2C) and Anomalous Cepheids (AC). While the former have periods similar to those of CC (from less than a day to more than 100 d), they are typically fainter at a given period (∼1 to 2 mag) such that recognizing CC and P2C is usually straightforward. On the other hand, AC are only slightly fainter than short-period CC (see e.g. Bono et al. 1997 for a discussion of their formation and evolution). This confusion is even more significant for metal-poor galaxies, in which most of the CC have periods similar to AC (∼0.4-3 d; e.g. IC 1613, Sextans A, Phoenix: Dolphin et al. 2001, 2003; Gallart et al. 2004; Bernard et al. 2010).
An increasing number of studies also suggest that there may be a metallicity effect on the slope and/or zero-point of the period–luminosity (PL) relations (e.g. Sakai et al. 2004; Romaniello et al. 2008; Sandage, Tammann & Reindl 2009; Bono et al. 2010; Storm et al. 2011), which would affect the distance measurements of galaxies for which metallicity is not well constrained. It is therefore essential to obtain complete surveys of Cepheids in a sample of metal-poor galaxies in order to gain a better understanding of their physical and evolutionary properties.
Leo A, a small star-forming dwarf galaxy discovered by Zwicky (1942) and located about 790 kpc away (e.g. Dolphin et al. 2002, hereinafter D02), is among the most metal-poor galaxies of the Local Group (LG). Its current metallicity is AO = 12+log(O/H) = 7.30 ± 0.05 (i.e. [Fe/H] ∼ −1.5, or ∼3 per cent solar assuming AO, ⊙ = 8.87 ± 0.07; Grevesse & Noels 1993) from the spectroscopy of three H ii regions and a planetary nebula (Skillman, Kennicutt & Hodge 1989; van Zee, Skillman & Haynes 2006). Tolstoy et al. (1998) drew attention to the relative lack of an ancient stellar population in Leo A, and this was supported by the discovery of the rarity of RR Lyrae stars by D02.
Leo A has been observed as part of the LCID1 project, which aims at constraining the star formation histories (SFH) of a sample of isolated LG galaxies based on deep colour–magnitude diagrams (CMD) and time series photometry obtained with the Advanced Camera for Surveys (ACS) onboard the Hubble Space Telescope (HST). The global SFH of Leo A has been presented in Cole et al. (2007), while the analysis of population gradients and spatially resolved SFH will appear in a forthcoming paper (Hidalgo et al., in preparation). Here, we present the search for short-period variable stars, in particular Cepheids, for which these data are particularly well suited.
The paper is organized as follows: the data acquisition, reduction and calibration are summarized in Section 2. We describe the identification of variable stars and their spatial distribution in Section 3. Sections 4 to 6 present the properties of the variable stars and candidate variables detected. The distance estimates based on various tracers and methods are presented in Section 7, and we discuss the implications of our results in Section 8. In Section 9 we summarize our results and present our conclusions.
OBSERVATIONS AND DATA REDUCTION
The observations of Leo A were carried out with the ACS onboard the HST between 2005 December 26 and 2006 January 8. The observed field was slightly offset from the centre of the galaxy, as shown in Fig. 1, to cover a longer radial baseline and study possible stellar population gradients. 16 HST orbits were devoted to this galaxy in two bands (F475W and F814W). Each orbit was split into two ∼1200 s exposures of a given band. This resulted in 16 images per band, for a total exposure time of 19 200 and 19 520 s in F475W and F814W, respectively. The complete observing log is presented in Table 1.
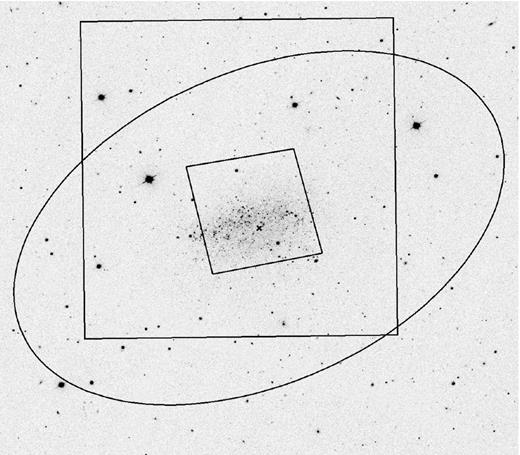
Sloan Digital Sky Survey image of Leo A. The cross and ellipse indicate the centre and extent of the galaxy (RA = 09h59m24|${.\!\!\!\!\!\!^{s}}$|0, Dec. = 30°44′47′′, r = 8 arcmin; Vansevičius et al. 2004), while the small and large squares show the location of our field of view (FOV) and that of Dolphin et al. (2002), respectively.
Summary of observations.
| Date | ut Start | MHJDa | Filter | Exp. time (s) |
|---|---|---|---|---|
| 2005-12-26 | 08:45:32 | 537 30.369 406 | F475W | 1200 |
| 2005-12-26 | 09:07:48 | 537 30.384 869 | F475W | 1200 |
| 2005-12-26 | 10:18:55 | 537 30.434 371 | F814W | 1220 |
| 2005-12-26 | 10:41:31 | 537 30.450 066 | F814W | 1220 |
| 2005-12-26 | 19:56:55 | 537 30.835 645 | F475W | 1200 |
| 2005-12-26 | 20:19:11 | 537 30.851 108 | F475W | 1200 |
| 2005-12-26 | 21:30:18 | 537 30.900 610 | F814W | 1220 |
| 2005-12-26 | 21:52:54 | 537 30.916 305 | F814W | 1220 |
| 2005-12-28 | 19:54:20 | 537 32.833 851 | F475W | 1200 |
| 2005-12-28 | 20:16:36 | 537 32.849 314 | F475W | 1200 |
| 2005-12-28 | 21:27:43 | 537 32.898 816 | F814W | 1220 |
| 2005-12-28 | 21:50:19 | 537 32.914 510 | F814W | 1220 |
| 2005-12-30 | 13:28:07 | 537 34.565 643 | F475W | 1200 |
| 2005-12-30 | 13:50:23 | 537 34.581 106 | F475W | 1200 |
| 2005-12-30 | 15:01:31 | 537 34.630 619 | F814W | 1220 |
| 2005-12-30 | 15:24:07 | 537 34.646 314 | F814W | 1220 |
| 2005-12-31 | 21:25:43 | 537 35.897 307 | F475W | 1200 |
| 2005-12-31 | 21:47:59 | 537 35.912 770 | F475W | 1200 |
| 2005-12-31 | 22:59:50 | 537 35.962 781 | F814W | 1220 |
| 2005-12-31 | 23:22:26 | 537 35.978 476 | F814W | 1220 |
| 2006-01-02 | 19:47:55 | 537 37.829 384 | F475W | 1200 |
| 2006-01-02 | 20:10:11 | 537 37.844 847 | F475W | 1200 |
| 2006-01-02 | 21:21:19 | 537 37.894 361 | F814W | 1220 |
| 2006-01-02 | 21:43:55 | 537 37.910 055 | F814W | 1220 |
| 2006-01-05 | 18:07:35 | 537 40.759 696 | F475W | 1200 |
| 2006-01-05 | 18:29:51 | 537 40.775 159 | F475W | 1200 |
| 2006-01-05 | 19:42:00 | 537 40.825 379 | F814W | 1220 |
| 2006-01-05 | 20:04:36 | 537 40.841 073 | F814W | 1220 |
| 2006-01-08 | 13:15:26 | 537 43.556 798 | F475W | 1200 |
| 2006-01-08 | 13:37:42 | 537 43.572 261 | F475W | 1200 |
| 2006-01-08 | 14:49:42 | 537 43.622 376 | F814W | 1220 |
| 2006-01-08 | 15:12:18 | 537 43.638 071 | F814W | 1220 |
aModified Heliocentric Julian Date of mid-exposure: HJD−2,400,000.
We note that the temporal sampling for this galaxy is not as optimal as was the case in the previous papers of this series. In our study of variable stars in Cetus and Tucana (Bernard et al. 2009, hereinafter Paper I) and IC 1613 (Bernard et al. 2010, hereinafter Paper II), we had 25, 32 and 24 data points per band, respectively, compared to only 16 here. In addition, the observing strategy for these three galaxies provided alternating observations in F475W and F814W, and therefore observations in a given filter that were well separated in time. For Leo A, the paired observations in a given band are only 22 min apart, thus, limiting their utility. While it did not affect our ability to detect candidate variables, some light curves have gaps which could limit the accuracy of the measured mean magnitudes (see Section 5).
The daophot/allframe suite of programs (Stetson 1994) was used to obtain the instrumental photometry of the stars on the individual, non-drizzled images provided by the HST pipeline. Additionally, we used the pixel area maps and data quality masks to correct for the pixel area variation and to flag bad pixels. Standard calibration was carried out as described in Sirianni et al. (2005). We refer the reader to Monelli et al. (2010) for a detailed description of the data reduction and calibration. The final CMD is presented in Fig. 2, where the (F475W + F814W)/2 ∼ V filter combination was chosen for the ordinate axis so that the horizontal branch (HB) appears approximately horizontal.
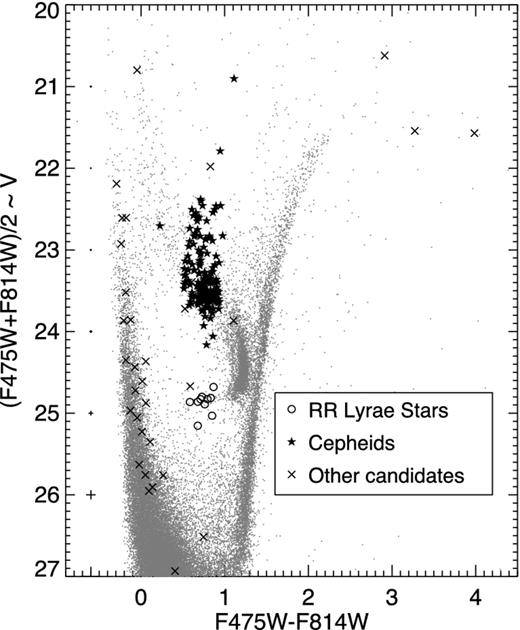
CMD of Leo A from our ACS data. The variables are overplotted as labelled in the inset.
The light curves of the variable stars were then converted to Johnson–Cousins BVI magnitudes using the transformations given in Paper I. As we have shown in Paper II from the comparison of the light curves of Cepheids in common between our HST survey and OGLE,2 these transformations can be safely used to analyse the properties (e.g. magnitude and amplitude) of the variable stars.
VARIABLE STARS
Identification and period search
The candidate variables were extracted from the photometric catalogues using the variability index of Welch & Stetson (1993); this process yielded ∼700 candidates. A preliminary check of the light curve and position on the CMD, together with a careful inspection of the stacked image, allowed us to discard false detections due to cosmic ray hits, chip defects or stars located under the wings of bright stars. Our final catalogue contains 166 bona fide variables and 33 candidates for which we could not determine a period [e.g. main-sequence variable (MSV) and red giant branch (RGB) variable, eclipsing binaries]. The variables and candidates are shown overplotted on the CMD in Fig. 2 using their intensity-averaged mean magnitudes. The individual F475W and F814W measurements for all the variables and candidates, as well as the transformed BVI magnitudes, are listed in Table 2.
Photometry of the variable and candidate variable stars. The complete table is available in the online edition.
| MHJDa | F475W | σ475 | Bc | σB | MHJDb | Vc | σV | MHJD | F814W | σ814 | Ic | σI |
|---|---|---|---|---|---|---|---|---|---|---|---|---|
| V001 | ||||||||||||
| 537 30.369 406 | 25.296 | 0.030 | 25.442 | 0.030 | 537 30.401 888 | 24.978 | 0.030 | 537 30.434 371 | 24.370 | 0.061 | 24.356 | 0.061 |
| 537 30.384 869 | 25.284 | 0.056 | 25.418 | 0.056 | 537 30.417 468 | 24.986 | 0.056 | 537 30.450 066 | 24.416 | 0.036 | 24.400 | 0.036 |
| 537 30.835 645 | 25.181 | 0.032 | 25.311 | 0.032 | 537 30.868 127 | 24.889 | 0.032 | 537 30.900 610 | 24.330 | 0.034 | 24.314 | 0.034 |
| 537 30.851 108 | 25.239 | 0.048 | 25.385 | 0.048 | 537 30.883 706 | 24.921 | 0.048 | 537 30.916 305 | 24.314 | 0.033 | 24.300 | 0.033 |
| 537 32.833 851 | 25.107 | 0.031 | 25.238 | 0.031 | 537 32.866 334 | 24.813 | 0.031 | 537 32.898 816 | 24.252 | 0.036 | 24.236 | 0.036 |
aModified HJD of mid-exposure: HJD−2 400 000.
bMid-point of F475W and F814W MHJD.
cTransformed from the F475W and F814W magnitudes using the equations of Paper I.
The period search was performed through Fourier analysis (Horne & Baliunas 1986) taking into account the information from both bands simultaneously, then refined interactively by modifying the period until a tighter light curve was obtained. For each variable, data points with error bars larger than 3σ above the mean error bar size were rejected through sigma clipping with five iterations. The periods are given with three significant figures only to reflect the sparse sampling of the light curves. Note that for the same reason, some of the periods may be aliases of the true periods.
The classification of the candidates was based on their light-curve morphology and position in the CMD. We found a large number of Cepheids but very few RR Lyrae stars (156 and 10, respectively), in very good agreement with the study of D02. The small number of RR Lyrae stars – which is not due to incompleteness, our photometry being near 100 per cent complete at the magnitude of the HB – is not surprising considering the SFH of Leo A (Cole et al. 2007; Hidalgo et al., in preparation), which shows a very low star formation rate for the earliest epochs. To obtain the amplitudes and intensity-averaged magnitudes of the variables, we fitted the light curves with a set of templates based on the set of Layden et al. (1999, see Paper I).
Table 3 summarizes the properties of the bona fide variable stars in our final catalogue. The first two columns give the identification number and type of variability, while the next two list the equatorial coordinates (J2000.0). Columns (5) and (6) give the period and logarithm of the period, in days. The intensity-averaged mean magnitudes 〈F475W〉 and 〈F814W〉, and colour 〈F475W〉 − 〈F814W〉 are given in columns (7), (9) and (11). The amplitudes in the F475W and F814W bands measured from the template fits are listed in columns (8) and (10). The last six columns alternately list the intensity-averaged mean magnitudes and amplitudes in the Johnson B, V and I bands. For the candidate variables, we only list the coordinates and approximate magnitudes in Table 4.
Pulsational properties of the variable stars. The complete table is available in the online edition.
| ID | Typea | RA | Dec. | Period | log P | 〈F475W〉 | A475 | 〈F814W〉 | A814 | 〈F475W〉 − | 〈B〉 | AB | 〈V〉 | AV | 〈I〉 | AI |
|---|---|---|---|---|---|---|---|---|---|---|---|---|---|---|---|---|
| (J2000) | (J2000) | (d) | (d) | 〈F814W〉 | ||||||||||||
| V001 | ab | 09 59 15.73 | +30 44 33.6 | 0.690 | −0.161 | 25.112 | 0.552 | 24.246 | 0.436 | 0.865 | 25.211 | 0.657 | 24.796 | 0.528 | 24.213 | 0.522 |
| V002 | F | 09 59 16.21 | +30 44 58.6 | 0.935 | −0.029 | 23.941 | 0.964 | 23.100 | 0.551 | 0.841 | 24.061 | 1.065 | 23.669 | 0.780 | 23.104 | 0.477 |
| V003 | F | 09 59 16.32 | +30 44 35.5 | 1.02 | 0.009 | 23.729 | 1.186 | 22.980 | 0.567 | 0.750 | 23.843 | 1.321 | 23.473 | 0.956 | 22.965 | 0.548 |
| V004 | F | 09 59 16.47 | +30 44 11.0 | 0.934 | −0.030 | 23.572 | 1.549 | 23.039 | 0.621 | 0.533 | 23.682 | 1.678 | 23.411 | 1.199 | 23.016 | 0.657 |
| V005 | F | 09 59 16.74 | +30 44 43.3 | 1.63 | 0.212 | 23.263 | 1.382 | 22.442 | 0.459 | 0.821 | 23.359 | 1.615 | 22.918 | 1.203 | 22.431 | 0.475 |
aab and c: fundamental mode and overtone RR Lyrae star; F, FO, SO: fundamental mode, first- and second-overtone CC; P2C: Population II Cepheid; Cep: Cepheid of unknown type.
Properties of the candidate variable stars.
| ID | Typea | RA | Dec. | F475W | F814W |
|---|---|---|---|---|---|
| (J2000) | (J2000) | ||||
| VC01 | MSV | 09:59:15.90 | +30:44:13.6 | 23.796 | 23.919 |
| VC02 | MSV | 09:59:17.69 | +30:44:54.6 | 25.232 | 25.222 |
| VC03 | MSV | 09:59:18.88 | +30:45:24.1 | 25.893 | 25.628 |
| VC04 | MSV | 09:59:18.91 | +30:45:27.6 | 24.400 | 24.473 |
| VC05 | LPV | 09:59:21.05 | +30:44:37.0 | 23.179 | 19.906 |
| VC06 | MSV | 09:59:21.80 | +30:45:19.8 | 24.688 | 24.756 |
| VC07 | ISV | 09:59:22.20 | +30:44:52.7 | 23.984 | 23.460 |
| VC08 | ISV | 09:59:22.89 | +30:45:53.1 | 24.420 | 23.314 |
| VC09 | LPV | 09:59:23.02 | +30:45:40.7 | 23.563 | 19.578 |
| VC10 | ISV | 09:59:23.37 | +30:46:01.6 | 23.696 | 23.090 |
| VC11 | MSV | 09:59:23.38 | +30:45:23.9 | 26.889 | 26.142 |
| VC12 | LPV | 09:59:25.22 | +30:45:23.7 | 22.076 | 19.164 |
| VC13 | MSV | 09:59:26.37 | +30:45:05.7 | 24.904 | 24.846 |
| VC14 | MSV | 09:59:26.44 | +30:45:01.9 | 22.518 | 22.696 |
| VC15 | MSV | 09:59:26.56 | +30:45:20.5 | 24.259 | 24.440 |
| VC16 | MSV | 09:59:26.97 | +30:44:30.1 | 25.619 | 25.642 |
| VC17 | MSV | 09:59:27.50 | +30:44:45.4 | 25.782 | 25.730 |
| VC18 | MSV | 09:59:28.03 | +30:44:17.4 | 22.496 | 22.721 |
| VC19 | MSV | 09:59:28.52 | +30:45:12.4 | 25.407 | 25.298 |
| VC20 | MSV | 09:59:28.58 | +30:45:59.0 | 26.000 | 25.905 |
| VC21 | MSV | 09:59:28.60 | +30:44:43.9 | 22.044 | 22.337 |
| VC22 | ISV | 09:59:28.70 | +30:45:46.0 | 22.394 | 21.565 |
| VC23 | MSV | 09:59:29.16 | +30:44:32.8 | 24.904 | 25.031 |
| VC24 | MSV | 09:59:29.38 | +30:44:59.3 | 23.763 | 23.970 |
| VC25 | MSV | 09:59:29.40 | +30:43:58.0 | 24.394 | 24.337 |
| VC26 | MSV | 09:59:30.21 | +30:44:41.2 | 20.776 | 20.823 |
| VC27 | MSV | 09:59:30.43 | +30:45:15.9 | 24.617 | 24.601 |
| VC28 | MSV | 09:59:30.83 | +30:44:19.5 | 22.807 | 23.045 |
| VC29 | ISV | 09:59:30.94 | +30:44:30.7 | 24.964 | 24.376 |
| VC30 | MSV | 09:59:31.26 | +30:44:41.6 | 23.431 | 23.613 |
| VC31 | MSV | 09:59:31.78 | +30:45:29.6 | 25.975 | 25.837 |
| VC32 | MSV | 09:59:32.14 | +30:45:05.1 | 27.136 | 26.730 |
| VC33 | MSV | 09:59:32.26 | +30:44:56.7 | 25.031 | 25.078 |
aISV: instability strip variable; LPV: long-period variable; MSV: main-sequence variable.
Spatial distribution
Fig. 3 presents the spatial distribution of stars in our FOV, where the RR Lyrae stars (open circles) and Cepheids (open and filled stars) are shown. The cross and ellipse represent the centre and Holmberg radius of Leo A (3.5 arcmin, from Vansevičius et al. 2004). Despite their small number, the RR Lyrae stars seem to be roughly uniformly distributed over the field. On the other hand, the Cepheids are mostly located close to the centre of the galaxy, where the main-sequence (MS) stars are strongly concentrated (D02; Hidalgo et al., in preparation). This shows that star formation in the past ∼1 Gyr was confined to the central region of the galaxy.
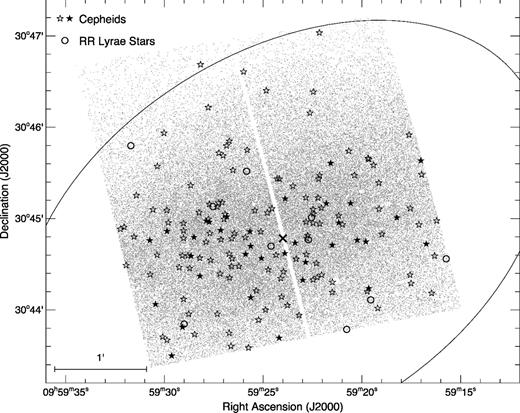
Spatial distribution of stars in our observed field, where the variables are overplotted as labelled in the inset. The cross and ellipse represent the centre and Holmberg radius of Leo A (3.5 arcmin; Vansevičius et al. 2004).
We further separated the Cepheids into a bright sample and a faint sample, with a division at W814 = 22 (see Section 5). These samples are shown as the filled and open stars, respectively. Interestingly, the Cepheids of the bright sample are even more concentrated close to the centre of the galaxy than the whole sample, all of them being located in the lower half of our FOV. These gradients indicate that the star-forming region has been shrinking with time (see e.g. Hidalgo et al. 2009), at least in the past Gyr or so. This result is in excellent agreement with the SFH as a function of galactocentric radius of Hidalgo et al. (in preparation).
Comparison with previous catalogues
The search for variable stars in Leo A has been carried out by several authors prior to this work. We cross-matched the catalogues from the literature with ours to identify the stars in common and compare the measured properties. These are listed in Table A1. We give their index, type and period measured from our data, together with their identifications and periods from previous catalogues.3
Cross-identification with previously known variables in Leo A.
| ID | Period | Typea | IDD02 | Period | Typeb | IDG07 | Period | IDH94 | Period |
|---|---|---|---|---|---|---|---|---|---|
| (d) | (d) | (d) | (d) | ||||||
| V002 | 0.935 | F | C2-V24 | 0.47 ± 0.02 | C-FO/SO | – | – | – | – |
| V004 | 0.934 | F | C2-V55 | 0.94 ± 0.03 | C | – | – | – | – |
| V005 | 1.63 | F | C2-V39 | 1.69 ± 0.05 | C-FM | LM53 | 2.674 | – | – |
| V007 | 1.60 | F | C2-V08 | 1.70 ± 9.99 | C | – | – | – | – |
| V008 | 0.542 | FO | C2-V27 | 0.55 ± 0.02 | C-FO | – | – | – | – |
| V009 | 2.5 | P2C | C2-V52 | 0.70 ± 0.06 | C | – | – | – | – |
| V010 | 0.635 | FO | C2-V20 | 0.65 ± 0.03 | C-FO | – | – | – | – |
| V012 | 0.570 | FO | C2-V03 | 0.60 ± 0.02 | C | – | – | – | – |
| V013 | 1.343 | F | C2-V23 | 1.52 ± 0.20 | C-FM | – | – | – | – |
| V015 | 0.645 | FO | C2-V21 | 0.64 ± 0.02 | C | – | – | – | – |
| V017 | 0.643 | FO | C2-V59 | 0.64 ± 0.02 | C-FO | – | – | – | – |
| V021 | 1.82 | F | – | – | – | LM04/LeoA-15 | 1.813 | V13 | 3.417 03 |
| V023 | 0.627 | FO | C2-V54 | 0.61 ± 0.01 | C-FO | – | – | – | – |
| V024 | 0.947 | FO | C2-V38 | 0.47 ± 0.02 | C-SO | LL14 | 18.920 | – | – |
| V025 | 1.40 | F | C2-V37 | 1.28 ± 0.12 | C-FM | LL11 | 57.912 | – | – |
| V028 | 1.09 | F | C2-V05 | 0.54 ± 0.02 | C-FO | – | – | – | – |
| V029 | 0.587 | ab | C2-V66 | 0.54 ± 0.03 | RR | – | – | – | – |
| V031 | 1.327 | F | C2-V25 | 1.39 ± 0.15 | C-FM | LM10 | 4.008 | V10 | 13.0040 |
| V035 | 0.981 | FO | – | – | – | LS01 | 0.981 | V9 | 2.6704 |
| V036 | 1.335 | F | C2-V09 | 1.22 ± 0.18 | C-FO | – | – | – | – |
| V037 | 1.525 | F | – | – | – | LM17/LeoA-22 | 1.524 | – | – |
| V038 | 0.871 | F | C2-V49 | 0.86 ± 0.02 | C-FM | – | – | – | – |
| V039 | 0.814 | FO | C2-V19 | 0.82 ± 0.04 | C-FO | – | – | – | – |
| V040 | 0.607 | FO | C2-V26 | 0.61 ± 0.02 | C-FO | – | – | – | – |
| V041 | 0.633 | FO | C2-V13 | 0.64 ± 0.01 | C-FO | – | – | – | – |
| V045 | 0.953 | F | C2-V50 | 0.49 ± 0.01 | C-FO | – | – | – | – |
| V053 | 1.08 | F | – | – | – | LS39 | 0.188 | – | – |
| V055 | 0.70 | FO | C2-V34 | 0.68 ± 0.01 | C-FO | – | – | – | – |
| V059 | 0.515 | FO | – | – | – | LL02 | 65.446 | – | – |
| V060 | 0.965 | FO | – | – | – | LS26/LeoA-21 | 0.965 | – | – |
| V061 | 2.170 | F | – | – | – | LM16 | 2.164 | – | – |
| V062 | 0.640 | FO | C2-V61 | 0.64 ± 0.01 | C-FO | – | – | – | – |
| V064 | 1.32 | F | – | – | – | LM15 | 1.320 | – | – |
| V067 | 3.35 | F | – | – | – | LM03/V03/LeoA-11 | 3.354 | – | – |
| V073 | 1.95 | F | – | – | – | LM13 | 1.943 | – | – |
| V082 | 1.57 | F | C2-V43 | 1.61 ± 0.05 | C-FM | LM39 | 1.562 | – | – |
| V085 | 0.624 | FO | C2-V53 | 0.63 ± 0.03 | C | – | – | – | – |
| V088 | 1.56 | F | – | – | – | LM07/V07/LeoA-9 | 1.564 | V7 | 0.548 37 |
| V089 | 0.890 | FO | – | – | – | LM54 | 8.390 | – | – |
| V090 | 1.17 | F | C2-V69 | 1.15 ± 0.04 | C-FM | – | – | – | – |
| V093 | 1.60 | F | C2-V42 | 1.73 ± 0.23 | C-FO | LM02/V06/LeoA-20 | 1.607 | – | – |
| V098 | 1.022 | F | C2-V11 | 0.51 ± 0.01 | C-SO | LM47 | 1.021 | – | – |
| V100 | 0.516 | FO | C2-V36 | 0.52 ± 0.02 | C | – | – | – | – |
| V104 | 1.065 | F | C2-V04 | 0.53 ± 0.02 | C | – | – | – | – |
| V107 | 1.69 | F | C2-V22 | 1.67 ± 0.13 | C-FM | LM11 | 1.690 | – | – |
| V111 | 0.90 | F | C2-V07 | 0.87 ± 0.02 | C | – | – | – | – |
| V114 | 1.46 | F | C2-V31 | 1.46 ± 0.20 | C-FM | – | – | – | – |
| V116 | 0.690 | FO | C2-V06 | 0.68 ± 0.01 | C-FO | – | – | – | – |
| V119 | 1.286 | F | C2-V60 | 1.32 ± 0.11 | C-FM | LM14 | 1.280 | – | – |
| V122 | 0.810 | FO | C2-V32 | 0.78 ± 0.04 | C-FO | – | – | – | – |
| V124 | 1.687 | F | – | – | – | LM09/V02 | 1.685 | – | – |
| V126 | 0.983 | F | – | – | – | LS35 | 0.450 | – | – |
| V130 | 1.20 | F | – | – | – | LM21 | 5.848 | – | – |
| V135 | 6.394 | F | – | – | – | LM01/V01/LeoA-5 | 6.490 | – | – |
| V141 | 0.749 | FO | C2-V30 | 0.75 ± 0.06 | C-FO | – | – | – | – |
| V145 | 2.05 | F | C2-V64 | 2.01 ± 9.99 | C | LM06/V04 | 2.048 | – | – |
| V147 | 0.813 | F | C2-V46 | 0.60 ± 0.02 | C-FO | – | – | – | – |
| V148 | 1.50 | F | – | – | – | LM45 | 1.499 | – | – |
| V153 | 0.652 | FO | C2-V02 | 0.65 ± 0.02 | C-FO | – | – | – | – |
| V155 | 0.775 | FO | C2-V10 | 0.79 ± 0.04 | C-FO | LS53 | 0.131 | – | – |
| V157 | 1.68 | F | C2-V58 | 1.46 ± 0.17 | C-FM | LM05/V05 | 1.685 | – | – |
| V158 | 1.052 | F | – | – | – | LL05 | 10.391 | – | – |
| V159 | 0.580 | FO | C2-V48 | 0.59 ± 0.03 | C-FO | – | – | – | – |
| V160 | 0.870 | FO | – | – | – | LS29 | 0.465 | – | – |
| V162 | 0.590 | FO | C2-V35 | 0.39 ± 0.01 | C-FO/SO | – | – | – | – |
| V164 | 0.667 | FO | C2-V45 | 0.66 ± 0.02 | C-FO | – | – | – | – |
| V165 | 0.795 | FO | C2-V28 | 0.80 ± 0.04 | C-FO | LM43 | 3.897 | – | – |
| V166 | 0.586 | FO | C2-V29 | 0.59 ± 0.02 | C-FO | – | – | – | – |
| VC05 | – | LPV | – | – | – | LeoA-14 | 170.70 | V11 | 2.0064 |
| VC09 | – | LPV | – | – | – | LeoA-12 | 268.42 | – | – |
| VC12 | – | LPV | – | – | – | LeoA-10 | 919.28 | – | – |
| VC30 | – | MSV | – | – | – | LS56 | 0.269 | – | – |
aab: fundamental mode RR Lyrae star; F, FO: fundamental mode and first-overtone CC; P2C: Population II Cepheid; LPV: long-period variable; MSV: main-sequence variable.
bType from D02 – RR: RR Lyrae star; C-FM, C-FO, C-SO: fundamental mode, first-, and second-overtone CC; C: Cepheid of unknown type.
Variable stars in Leo A were first mentioned by Sandage (1986). While the data were not sufficient for a detailed study, Sandage found eight candidates by blinking three plate pairs. However, only the four best candidates are labelled on the finding chart, and no information on periods or magnitudes is given. By comparing his finding charts with ours, we found the following: his ‘definite variable’ (RA = 09:59:19.52, Dec. = +30:44:13.4) is a very bright MS star; one candidate (RA = 09:59:28.88, Dec. = +30:45:42.6) is a blend of two relatively bright RGB stars, and another (RA = 09:59:24.70, Dec. = +30:44:48.1) is close to the tip of the RGB (TRGB); none of these appear to be variable in our data, possibly due to having periods longer than our observational baseline. The fourth candidate is out of our FOV, but corresponds to the D02 Cepheid C2-V67.
The first actual search for variable stars was carried out by Hoessel et al. (1994, hereinafter H94) using data from a variety of telescopes and instruments, from which they discovered 14 suspected variables (including five Cepheids: V5, V8, V9, V10 and V14 in their catalogue). Out of these, V1, V2 and V14 are located outside of our FOV. The stars V3–V6, V8 and V12 are not variables in our data, and V11 is a long-period variable (LPV). We classify the remaining four candidates (V7, V9, V10 and V13) as Cepheids, but the periods from H94 cannot phase our data.
More recently, D02 analysed 28 images (23 in V, 5 in R) taken with the WIYN 3.5 m telescope and found 92 candidates variables (84 Cepheids and 8 RR Lyrae stars). Our catalogue contains 49 of the 50 variables in our FOV. Their C2-V33 appears to be a (non-variable) red clump (RC) star in our data. As shown in Fig. 4, for most of the stars in common we find a very good agreement between their reported periods and ours. For the few variables with discrepant periods, we checked that their value did not give a better light curve. The dotted lines in Fig. 4 show that most of the inadequate periods of D02 are due to the 1 d aliasing usually affecting ground-based data.
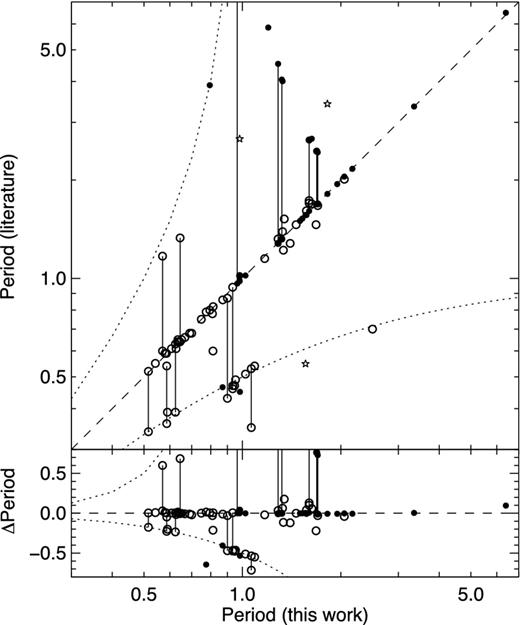
Period difference for the variable stars in common between this and previous works: D02 (open circles), G07 (filled circles) and H94 (open stars). When two periods were listed for a given star, these are joined by vertical lines. The dashed line is the identity line and the dotted lines represent the 1 d aliases of the best period.
The most recent work on variable stars in this galaxy is by the Munich group (Gössl, Snigula & Hopp 2006; Snigula 2006; Gössl 2007, hereinafter G07) using small telescopes with the aim of studying the properties of bright variables in a sample of six northern dwarf irregular galaxies, including Leo A. The work of G07 focused on Cepheids while Snigula (2006) concentrated on LPVs, although some of the stars with insecure classification appear in both. Given the relatively short time baseline of our observations preventing us from detecting long periodicities, most of the previously known stars in our catalogue are in common with G07. In column 7 of Table A1 we use the star indices of G07, where LS, LM and LL refer to short-, medium- and long-period variables, with cut-offs at 1 and 10 d, but also list the indices from Gössl et al. (2006, starting with V-) and from Snigula (2006, starting with LeoA-), when available.
The catalogue of G07 contains 131 candidate variables with R < 23.5 and P < 130 d. Of these, 33 are matches to Cepheids in our catalogue, including 19 with periods in good agreement with ours (see Fig. 4). The remaining ones are either outside of our FOV (45), or not variable in our data (53). We note, however, that all their candidates flagged as ‘best’ and ‘good’ and located in our FOV are indeed Cepheids.
RR LYRAE STARS
10 of the variable stars in our sample are located on the HB and were classified as RR Lyrae stars. From their light curves and periods, we further classify them as seven fundamental-mode (RRab) and three overtone (RRc) pulsators. We find mean periods of 0.636 and 0.366 d for the RRab and RRc, respectively, and a fraction of overtone pulsators of fc = Nc/(Nab + Nc) = 0.3. These numbers place Leo A in the Oosterhoff (1939) type II group, whereas the vast majority of LG dwarf galaxies have properties intermediate between those of the type I and type II groups (OoI and OoII, respectively; see Catelan 2009; Smith, Catelan & Clementini 2009). We note, however, that the reliability of these numbers may be affected by the small number of RR Lyrae stars and suboptimal light curves.
In fact, this classification is not as clear from the location of these variables in the period–amplitude diagram. Fig. 5 presents the period–amplitude diagram (top) and the period distribution (bottom) of the RR Lyrae stars. In the top panel, RRab and RRc are shown as the open circles and open triangles, respectively. The solid and dashed curved lines show the loci of OoI and OoII globular clusters from Cacciari et al. (2005). The low-amplitude RRab stars seem to lie on the OoI locus, while the ones with higher amplitude are located between the two groups, suggesting a Oosterhoff intermediate classification instead. The relatively long mean period for the RRab stars may thus be due to the lack of high-amplitude RRab stars.
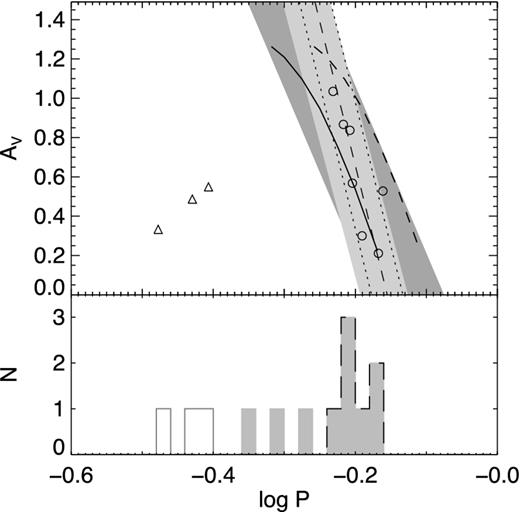
Top: period–amplitude diagram for the RR Lyrae stars. The circles and triangles represent RRab and RRc, respectively. The thin dashed line is a fit to the period–amplitude of the RRab; the dotted lines show the 1.5σ limits. The light and dark greyed areas represent the ±1.5σ limits of Cetus and Tucana, respectively, from Paper I. The solid and dashed curved lines show the loci of OoI and OoII globular clusters from Cacciari, Corwin & Carney (2005). Bottom: period histogram for the RR Lyrae stars of the top panel. RRab and RRc are shown as the black dashed and solid grey lines, respectively, while the filled histogram represent the fundamentalized RR Lyrae stars.
The shaded areas in the top panel of Fig. 5 represent the location of RRab stars in Cetus and Tucana from Paper I. The figure shows that the distribution of the RRab of Leo A in period–amplitude space, forming a tight and almost vertical sequence, is very similar to that of Cetus. On the other hand, in Paper II we found that the RRab in IC 1613 were more similar to those in Tucana. Interestingly, both Cetus and Leo A seem to have had a significantly lower SFR at very early epochs than Tucana and IC 1613, which may partly explain the difference.
The very low number of RR Lyrae stars is a remarkable result given the high stellar density in our FOV and completeness at the magnitude of the HB ( ≳ 98 per cent). For comparison, we found 90 or more RR Lyrae stars in roughly similar areas in the other LCID galaxies (Paper I; Paper II). To make this comparison more meaningful, for each of these galaxies we calculated the number of RR Lyrae stars relative to the number of RGB stars within the 2.5 mag below the TRGB. We find 0.01, 0.09, 0.58 and 0.81 for Leo A, IC 1613, Cetus and Tucana, respectively. Assuming RGB and RR Lyrae stars are older than 1.5 and 10 Gyr, respectively, this ratio gives a measure of the fraction of very old stellar population with respect to the intermediate age and old stellar populations of the galaxy. The extremely low value found for Leo A is in very good agreement with the results of the SFH analysis. Cole et al. (2007) and Hidalgo et al. (in preparation) found very little, if any, star formation for ages older than 10 Gyr, and showed that 90 per cent of the star formation had occurred more recently than 8 Gyr ago.
CEPHEIDS
Most of the variable stars in our sample are found in the classical instability strip above the HB. We present their light curves in Fig. 6. Recent work has shown that at the metallicity of the young population of Leo A ([Fe/H] ∼ −1.5), CC and AC can occupy a similar region in the CMD (Fiorentino et al. 2012). CC are young, relatively massive stars ( ≳ 2.2 M⊙) in the phase of core helium burning. AC, on the other hand, are older and less massive stars on the HB phase of evolution, burning helium in the core in partially degenerate conditions after undergoing the so-called helium flash at the TRGB (e.g. Demarque & Hirshfeld 1975).
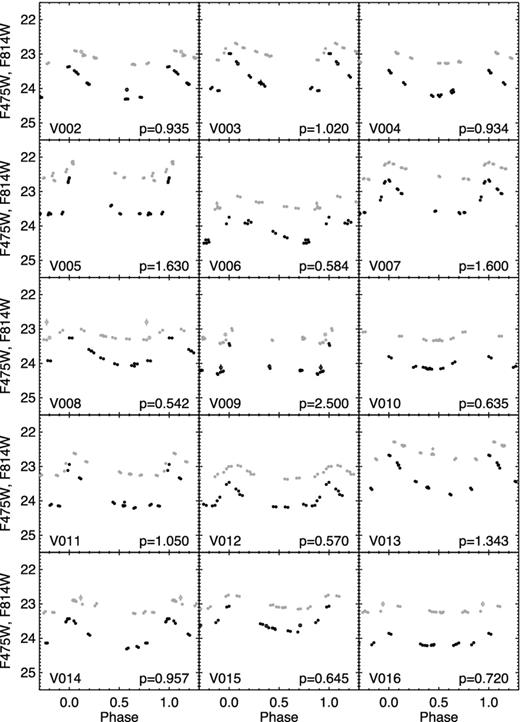
Sample light curves of the Cepheids stars in the F475W (black) and F814W (grey) bands, phased with the period in days given in the lower-right corner of each panel. The open symbols show the bad data points, i.e. with errors larger than 3σ above the mean error of a given star, which were not used in the calculation of the period and mean magnitudes. For a few very bright Cepheids, the light curves have been shifted downward by 1 or 2 mag, as shown by an arrow in the top-left corner of a panel. The complete sample of light curves is available in the online version.
In Fig. 7, we show a comparison of the observed location of the Cepheids in the CMD with the theoretical predictions for both CC and AC with masses 2.0–7.0 M⊙. The models are based on the BaSTI stellar evolution library (Pietrinferni et al. 2004), and were shifted to the distance and foreground reddening of Leo A. The thick blue line shows the zero-age helium-burning (ZAHeB) locus, which represents the ignition of helium in the core in either degenerate (M ≤ 2.14 M⊙ at [Fe/H] = −1.5) or non-degenerate (M > 2.14 M⊙) conditions. The black and blue dashed lines show the theoretical tracks for CC and AC, respectively. They extend from the ZAHeB to the open star symbols representing exhaustion of helium in the core. The figure shows that while all the Cepheids brighter than F814W ∼ 23 are most likely CC, the fainter ones could be a combination of both CC and AC. Note that this result does not change for significantly lower metallicity (i.e. [Fe/H] = −1.8). On the other hand, for [Fe/H] = −1.3 and higher, the AC tracks do not enter the instability strip, leading to a pure CC population.
![CMD showing the observed variable (magenta filled circles) and non-variable (grey dots) stars, where theoretical predictions from the BaSTI library (Pietrinferni et al. 2004) are overplotted. The thick blue line shows the ZAHeB locus for [Fe/H] = −1.5. Evolutionary tracks for both anomalous (blue dashed lines, M = 2.0 and 2.14 M⊙) and classical (black dashed lines, M = 2.2, 2.4, 2.6, 3.0, 3.5, 4.0, 5.0, and 7.0 M⊙) Cepheids are shown for the same metallicity. The stellar tracks extend from the ZAHeB to the central helium exhaustion, represented by the open star symbols. The thick red line shows the ZAHeB locus for [Fe/H] = −2.0, which provides a much better fit to the old stellar populations of the HB (see Section 8.1).](https://oup.silverchair-cdn.com/oup/backfile/Content_public/Journal/mnras/432/4/10.1093_mnras_stt655/3/m_stt655fig7.jpeg?Expires=1750376736&Signature=a07N3EB7CTZW9hwyZ0ivbjOlXqSQrg05b44dS4ifvRKMaCG-p7H4KYIMhx73nb34xpHG~1OnmSXyWrwJZmnKwW8DtCCj2iu~W1vkNssWHDZ-Ka34ldW6Dzmm~jQxstJGj~PEyMWgQb55jOJMbE7HT96Lp4FVNWLNALxbmpH7XNDhKLeOp~a6HCq5GGT8gNWW2ESvJP9i4TxjJBxiyu2qI~LgDHGKao4aZ~yo8XyHY~D1AjLiZmTKaxkC~YW1inUaQfLQokMg-1MmHEfc-i4nVsvCAUdrwm3Qfpxn8sZWNDi37P32Q7gzXuvDkwvHbVrd9HOzu7u2Sw39n0xqpR3mVQ__&Key-Pair-Id=APKAIE5G5CRDK6RD3PGA)
CMD showing the observed variable (magenta filled circles) and non-variable (grey dots) stars, where theoretical predictions from the BaSTI library (Pietrinferni et al. 2004) are overplotted. The thick blue line shows the ZAHeB locus for [Fe/H] = −1.5. Evolutionary tracks for both anomalous (blue dashed lines, M = 2.0 and 2.14 M⊙) and classical (black dashed lines, M = 2.2, 2.4, 2.6, 3.0, 3.5, 4.0, 5.0, and 7.0 M⊙) Cepheids are shown for the same metallicity. The stellar tracks extend from the ZAHeB to the central helium exhaustion, represented by the open star symbols. The thick red line shows the ZAHeB locus for [Fe/H] = −2.0, which provides a much better fit to the old stellar populations of the HB (see Section 8.1).
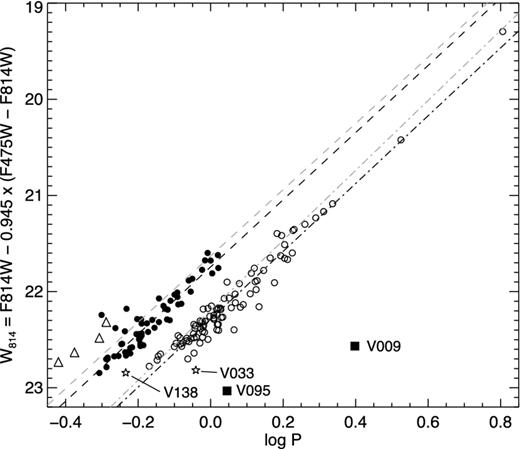
Period–Wesenheit diagram for Cepheids in Leo A. The open circles, filled circles and open triangles represent fundamental, first-overtone and second-overtone pulsators, respectively. A few outliers are labelled and discussed in Section 5. The black dash-dotted and dashed lines are linear fits to the fundamental and FO Cepheids. The grey lines are the same fits to the IC1613 Cepheids (Paper II), shifted to the distance of Leo A.
Fig. 9 shows the Leo A Cepheids in the period–Wesenheit (P-WI) diagram, together with the OGLE-III Cepheids of the Small and Large Magellanic Clouds (SMC and LMC, respectively; Soszyński et al. 2008a,b, 2010a,b) in the middle and right-hand panels. In all three panels, the Leo A Cepheids are shown with the same symbols as in Fig. 8, and are shown by themselves in the left-hand panel for clarity. The Cepheids of Leo A were shifted according to the TRGB distance determined in Section 7.1, i.e. (m − M)0 = 24.57. The LMC/SMC apparent magnitudes were converted to absolute magnitudes assuming a distance modulus of 18.515 ± 0.085 to the LMC (Clementini et al. 2003), and a distance offset of 0.51 of the SMC relative to the LMC (Udalski et al. 1999a). The middle panel shows that the bulk of Leo A Cepheids are in relatively good agreement with the SMC Cepheids – even though the significant spread of the SMC Cepheids complicates the comparison – and extend the F, FO, and SO PL relations to shorter periods and fainter magnitudes. This supports their identification as CC.
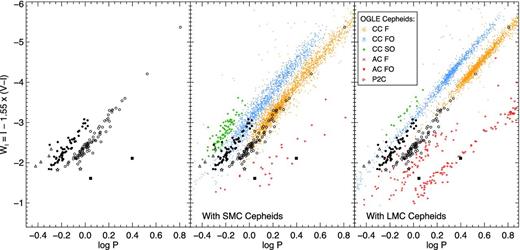
PL diagram for Cepheids in Leo A (the black symbols as in Fig. 8). The left-hand panel shows the Leo A data alone, while in the middle and right-hand panels the Cepheids in the SMC and LMC, respectively, are also shown. In the inset, CC, AC and P2C stand for classical, anomalous and Population II Cepheids, respectively; F, FO and SO indicate fundamental, first- and second-overtone mode pulsations.
We note, however, that at the shortest period the FO Cepheids of Leo A and the SMC seem to be slightly offset, the former appearing ∼0.1 mag fainter than the latter at log P ∼ −0.25. This is more obvious in the right-hand panel, which shows that they are fainter by ∼0.2–0.3 mag than the LMC CC at a given period. Part of these offsets may be due to uncertainties in the distance moduli used. On the other hand, we also find small differences in the slope of the PL relations calculated by linear regression over the period ranges −0.2 < log P < 1.0 and −0.4 < log P < 0.8 for the F and FO Cepheids, respectively. For the F and FO Cepheids of Leo A, we find slopes of −3.538 ± 0.074 and −3.58 ± 0.15, respectively, comparable to those of the SMC (−3.522 ± 0.013 and −3.639 ± 0.020), but mildly steeper than those of the LMC (−3.332 ± 0.012 and −3.439 ± 0.011). The possible origin of the offset is further discussed in Section 8.
Despite this offset, most of the Leo A Cepheids lie closer to the sequences of F and FO CC of the Magellanic Clouds than to the other types of Cepheids (AC and P2C). The Cepheids that were flagged as outliers in Fig. 8 fall squarely on the sequences of other types of Cepheids. In particular, the two faint Cepheids with periods longer than 1 d (V009 and V095, filled squares) lie on the P2C sequence of both Magellanic Clouds. V138, shown as an open star, lies between the F and FO CC PL, but fits very well with the FO AC of the LMC. Some of the other Cepheids that are slightly offset from the classical F and FO sequences (e.g. V033 in Fig. 8) may actually be AC. Unfortunately, our light curves are not sufficiently densely populated to classify the Cepheids based on light-curve morphology. The follow-up observations of Fiorentino et al. (in preparation), carried out with the Gemini telescope, may help us to confirm the presence of AC in Leo A thanks to the better sampling.
OTHER CANDIDATE VARIABLES
In addition to the classical instability strip variables (ISV) presented above, we detected another 33 variable candidates (VC) throughout the CMD, for which we could not determine the period because of inadequate temporal sampling or insufficient number of data points. They are shown as crosses in the CMD in Fig. 2. The majority of these candidate variables are located on the MS or close to the TRGB, and are therefore most likely eclipsing binaries or LPV; two of these (VC11 and VC32) are possible δ-Scuti stars. Their coordinates and approximate magnitudes are provided in Table 4. They are labelled as MSV, ISV or LPV based on their location on the CMD.
DISTANCE TO LEO A
TRGB luminosity
In the previous papers of this series (Paper I; Paper II), we used exclusively the properties of the variable stars to obtain the distance to the host galaxy. However, the rather sparse sampling of our light curves, fainter than expected Cepheids, and very low number of RR Lyrae stars in Leo A lead to somewhat uncertain measurements (see below). Therefore, we also include measurement of the distance using the TRGB method (e.g. Da Costa & Armandroff 1990; Lee, Freedman & Madore 1993; Salaris & Cassisi 1998), for which the dependence on age and metallicity is well understood. In particular, Salaris (2012) has shown that at the low metallicity of Leo A, the luminosity of the TRGB is not affected by age (at least for ages larger than ∼4 Gyr old), metallicity, metal mixture and helium abundance, and that the empirical and theoretical models agree within ∼0.05 mag.
Fig. 10 shows the box used for the selection of RGB stars in the Leo A CMD (top-left panel) and corresponding luminosity function (LF, bottom panel). We applied the same method to IC 1613 for comparison with the variable star distance from Paper II and to illustrate the reliability of the method; we show the CMD and LF in the top-right and bottom panels, respectively. The open circles in the CMDs represent the Cepheids and RR Lyrae stars. To determine the magnitude of the TRGB, we convolved the LFs with a Sobel kernel of the form [−1,−2,0,2,1]; the filter response function is shown as a dotted line in the bottom panels, and the centre of the peak corresponding to the TRGB of each galaxy is indicated by the thick vertical line. We find F814W0 = 20.46 ± 0.12 and 20.36 ± 0.09 for the TRGB of Leo A and IC 1613, respectively, shown as the horizontal lines in the top panels. For each galaxy, the error bars were calculated by measuring the TRGB luminosity of 1000 synthetic CMDs containing the same number of stars in the selection box as the real galaxies; the quoted uncertainty is the standard deviation of these measurements.
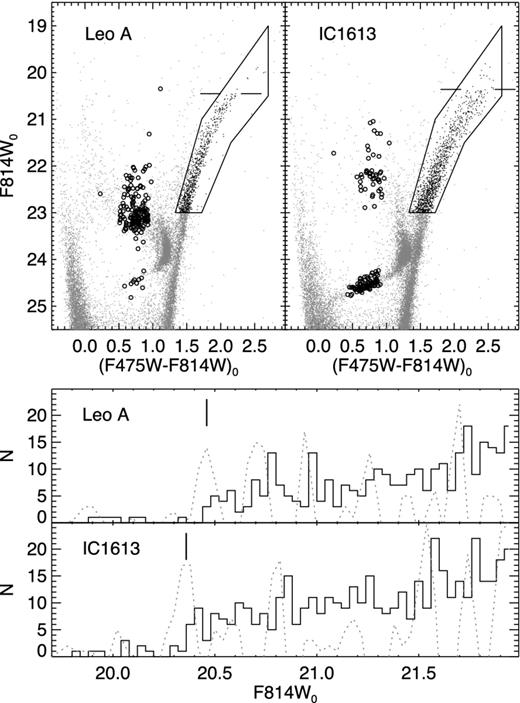
Top panels: CMDs of Leo A (left) and IC 1613 (right), showing the box used for the selection of RGB stars (black points). The open circles represent the Cepheids and RR Lyrae stars, and the magnitude of the TRGB is marked by the horizontal lines near F814W0 ∼ 20.5. Bottom panels: LFs of Leo A and IC 1613 (black histograms). The dotted line represents the Sobel filter response, and the location of the tip is shown by a vertical line.
The distances were obtained from the TRGB magnitudes using the empirical absolute TRGB magnitude calibrations in the HST flight bands from Rizzi et al. (2007). While these contain a colour term based on either the F555W or F606W bands, which we do not have for Leo A, the (F555W − F814W) colour is very close to (V − I). We can therefore use the TRGB colour from ground-based observations. For Leo A and IC 1613, we used (V − I)TRGB = 1.40 ± 0.05 (Tolstoy et al. 1998) and 1.60 ± 0.02 (Rizzi et al. 2007), respectively. These give distance moduli of (m − M)LeoA, 0 = 24.57 ± 0.13 and (m − M)IC 1613, 0 = 24.44 ± 0.09. The latter value is precisely the same as the distance determined from Cepheids and RR Lyrae stars in Paper II. It shows that the TRGB method used here and the variable stars distance methods of Paper II produce homogeneous and reliable results. We note that using the theoretical TRGB magnitude calibrations from Cassisi & Salaris (2013), which take into account the updated electron conduction opacities of Cassisi et al. (2007), produces comparable values within the uncertainties [(m − M)LeoA, 0 = 24.58 ± 0.13 and (m − M)IC 1613, 0 = 24.49 ± 0.09]. Our TRGB distance to Leo A is also in good agreement with previous determination using this method ((m − M)0 = 24.5 ± 0.2; Tolstoy et al. 1998; Schulte-Ladbeck et al. 2002).
RR lyrae stars
In the previous papers of the series, we used both the mean magnitude of the RR Lyrae stars (luminosity–metallicity relation) and the location of the first-overtone blue edge of the instability strip (period–luminosity–metallicity relation) to estimate the distance to the host galaxy. However, the latter method depends on having a sufficiently populated HB within the instability strip, and is thus not applicable here due to the very low number of RR Lyrae stars found in Leo A. Here and in the following section, we used the intensity-averaged mean magnitudes in the Johnson–Cousin bands.
We find a dereddened mean magnitude for the 10 RR Lyrae stars of 〈V〉0 = 24.916 ± 0.044. The star formation and chemical enrichment history calculated by Hidalgo et al. (in preparation) from CMD fitting gives a mean metallicity of [Fe/H] = −2.0 ± 0.1 for the old population. At this metallicity, the relation given above predicts a HB luminosity of MV = 0.44 ± 0.11. The uncertainty was quantified through Monte Carlo simulations. This gives a distance modulus of (m − M)0 = 24.48 ± 0.12 after correcting for reddening. We note that the distance does not change significantly if we exclude the three outlier RR Lyrae stars (one bright and two faint, see Fig. 2), which yields (m − M)0 = 24.44 ± 0.11. This distance is in good agreement with the TRGB distance derived in Section 7.1.
Cepheid period–luminosity–(colour) relations
Given the significant number of F, FO and SO Cepheids observed in our field and rather well-defined PL sequences (see Fig. 8), we can calculate the distance to Leo A using their photometric and pulsational properties. As in Paper II, we used both the P-WI relations for F and FO Cepheids, and the period–luminosity–colour (PLC) relation for SO Cepheids (Bono, Caputo & Marconi 2001). In addition, we also include the distance estimates using the recent PL relation of Tammann, Reindl & Sandage (2011), derived specifically for metal-poor galaxies from short-period SMC Cepheids.
To take into account the possible change in the PL relations depending on metallicity, Tammann et al. (2011) derived new PL and period–colour (PC) relations using the metal-poor Cepheids of the SMC from the OGLE-II data base. The PL (and PC) relations of both F and FO pulsators seem to present a break, so they fitted two linear regressions, treating the position of the break as a free parameter. For the F and FO Cepheids, they find the break at log P = 0.55 and 0.40, respectively. A single F Cepheid of our sample has a period longer than the break, so we simply rejected it and used the PL relations for periods shorter than the breaks.
Finally, the PLC relation for SO Cepheids was derived by Bono et al. (2001) from their pulsational models. Due to the low amplitude of the SO light curves and very narrow instability strip, the uncertainties in distance are relatively small.
We note that the relations of Tammann et al. (2011) were calibrated assuming an SMC distance modulus of (m − M)SMC, 0 = 18.93, while those of Bono et al. (2001) applied to SMC Cepheids yielded (m − M)SMC, 0 = 19.11. For consistency with the distances determined in Paper II, we adapted the zero-points of these relations to give (m − M)SMC, 0 = 19.03.
Fig. 11 summarizes the Cepheid-based distance calculations. The panels show the P-WI (top) and P-MI (middle) relations for F and FO Cepheids, and the PLC for SO Cepheids (bottom). The distance modulus obtained for each fit, corrected for foreground reddening [E(B−V) = 0.021; Schlegel, Finkbeiner & Davis 1998, is indicated at the top of each panel. We find that all the methods give values consistent with each other. A straight average of these measurements yield (m − M)LeoA, 0 = 24.70, with a standard deviation of σ = 0.03. This is also in very good agreement with the Cepheid distance of Tammann et al. (2011), after taking into account the correction for the different assumed SMC distances.
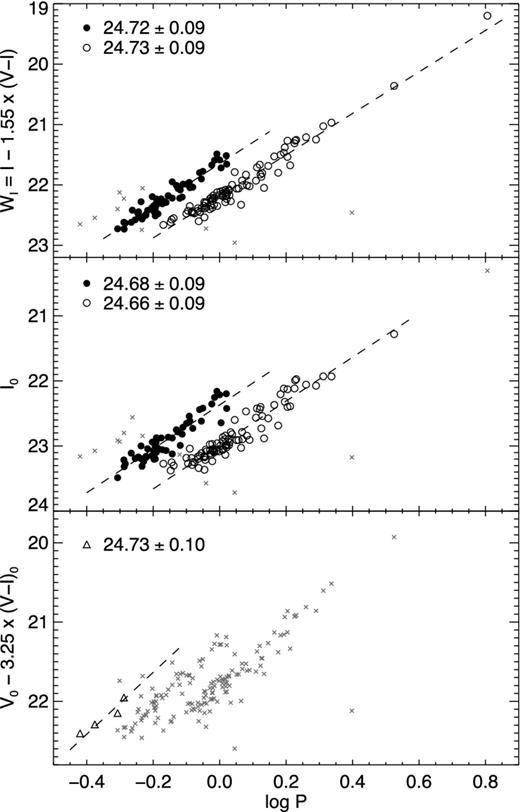
PL diagrams for Cepheids in Leo A. The distance was determined using the P-WI relations for F and FO Cepheids of Paper II (top), P-MI relations for F and FO Cepheids of Tammann et al. (2011, middle), and the PLC for SO Cepheids from Bono et al. (2001, bottom). In each case, open circles, filled circles and triangles show the F, FO and SO Cepheids used for the fits, while the grey crosses represent the Cepheids that were rejected. The linear fits are shown as dashed lines and the corresponding dereddened distance moduli are listed in the top of each panel.
Interestingly, while all the Cepheid-based distances agree with each other, they are somewhat longer than the distance obtained from the TRGB (Δ(m − M)0 ∼ 0.13) and from the RR Lyrae stars (Δ(m − M)0 ∼ 0.18). We do not believe this is an issue with the calibration from the HST flight system to the Johnson–Cousin system: as shown in Fig. 8, even in the HST bands the Cepheids of Leo A are fainter than expected if the galaxy is located 0.1 mag further than IC 1613 as indicated by the difference in TRGB luminosity. Likewise, the luminosity of the Cepheid sample is unlikely to be biased towards fainter magnitudes due to the presence of a significant population of AC. The PL relations shown in Fig. 11 are very tight, and apparently linear over the whole range of periods. Therefore, even if some AC are present in the sample, they are indistinguishable from the CC and would not affect the distance measurements. This may indicate that the Cepheids in Leo A are intrinsically fainter at a given period than in the LMC, SMC and IC 1613. This is discussed further in Section 8.2.
DISCUSSION
Metallicity evolution
We have calculated the distance to Leo A using several methods based on the properties of the Cepheids and RR Lyrae stars, as well as the luminosity of the TRGB. We find a good agreement between the values obtained from the TRGB and the RR Lyrae stars [(m − M)0 = 24.57 ± 0.13 and 24.48 ± 0.12, respectively]. These are also consistent with the recent literature value of (m − M)0 ∼ 24.5 (D02; Schulte-Ladbeck et al. 2002) obtained with similar methods.
The distance inferred from the RR Lyrae stars is quite sensitive to the metallicity adopted for these stars, which at the distance of Leo A cannot be directly measured. However, the SFH of Leo A calculated by Hidalgo et al. (in preparation) from CMD fitting provides the age–metallicity relation. It shows a very low metallicity at early times (Z ∼ 0.0002, [Fe/H] ∼ −2.0), followed by a steady metal enrichment until the present time when the metallicity derived is in fair agreement with the value inferred from H ii regions.
The low metallicity for the old population is also required to explain several features of the observed CMD, such as the position of the HB and RC, and to obtain a good agreement between the observed HB and theoretical models. Close examination of the RC in Fig. 7 reveals a thin, almost vertical group of stars at (F475W − F814W) ∼ 1.1 and F814W ∼ 24, slightly separated from the blue side of the RC. This suggests the presence of a small population of old stars, more metal-poor than the bulk of the RC stars.
To illustrate this, in Fig. 12 we show the CMD of Leo A where theoretical ZAHeB of various metallicities have been overlain. The lines at (F475W − F814W) ∼ 0 indicate the maximum extent of the blue loops. According to synthetic HB models in optical photometric bands, the ZAHeB locus is expected to be about 0.05 mag fainter than the lower envelope of the observed HB distribution (see Cassisi et al. 2004; Catelan 2004; Cassisi & Salaris 2013). This means that the best fit is provided by the [Fe/H] ∼ −2.0 ZAHeB. At this metallicity, the ZAHeB also provides a very good fit to the ‘blue RC’. On the other hand, the young stars of the blue loops are better represented by the higher metallicity, in agreement with the spectroscopic value of the H ii regions. This suggests that the metallicity of Leo A has been increasing from [Fe/H] ∼ −2 to [Fe/H] ∼ −1.5 (i.e. a factor of ∼3) over the past 10 Gyr or so.
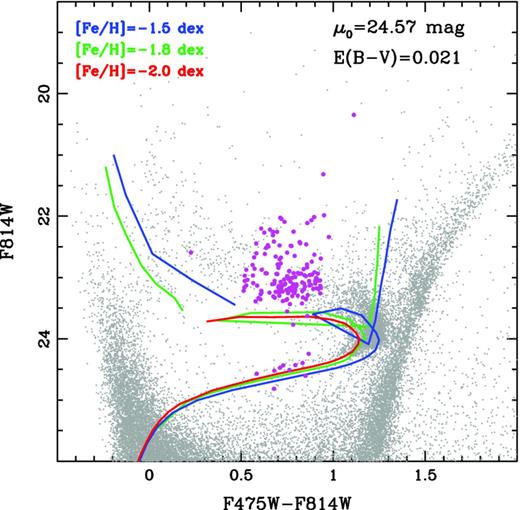
CMD showing the observed variable (magenta filled circles) and non-variable (grey dots) stars. Theoretical ZAHeBs are shown for three different metallicities. The lines at (F475W − F814W) ∼ 0 indicate the maximum extent of the blue loops.
Metallicity dependence of the cepheid PL relation
The reason for the slightly longer distance obtained from the Cepheids (∼0.13) is not clear. Given the extremely low metallicity of Leo A it may also be explained by a metallicity effect, although the dependence on metallicity of the slopes and zero-points of PL relations is still debated (see, e.g. Sakai et al. 2004; Romaniello et al. 2008; Sandage et al. 2009; Storm et al. 2011). Fig. 8 indicates that the Cepheids of Leo A are fainter than those in IC 1613, if we assume that the former are located 0.1 mag further than the latter as indicated by the difference in TRGB luminosity. Likewise, Fig. 9 suggests that the shortest period SMC Cepheids are, at a given period, slightly fainter than their more metal-rich LMC equivalent (see e.g. at log P ∼ −0.1). The luminosity difference between the short-period Cepheids of Leo A and the LMC is also significant. This may indicate that the luminosity of the short-period Cepheids decreases with decreasing metallicity, leading to a longer distance modulus than that obtained from the TRGB and the RR Lyrae stars.
In fact, such a trend with metallicity of the difference between the TRGB and Cepheid distances has been suggested before (Kennicutt et al. 1998; Sakai et al. 2004), in the sense that the distance modulus obtained from the Cepheids appeared increasingly longer than the TRGB distance modulus at decreasing metallicity. However, these results have recently been contested by Rizzi et al. (2007, see also Bono et al. 2008) who found no significant trend for the same sample of galaxies (see also Salaris & Cassisi 1998). While the origin of the discrepancy between the Sakai et al. (2004) and Rizzi et al. (2007) measurements is not discussed in the latter paper, it suggests that if the luminosity of the Cepheids does depend on metallicity the effect is smaller than the uncertainties currently affecting the measurements. For the sample of galaxies presented by Rizzi et al. (2007) – covering almost two orders of magnitude in nebular oxygen abundance – the difference between TRGB and Cepheid distance estimates has a standard deviation of 0.1, similar to the typical distance uncertainty to nearby galaxies.
The discrepancy between TRGB and Cepheid distances could also be unrelated to the stellar metallicity. Other possible factors affecting the distances obtained from Cepheids include the possible non-linearity of the PL relations (e.g. Ngeow et al. 2009), the intrinsic colour of the Cepheids (Sandage & Tammann 2008), as well as the effects of stellar crowding and the properties of the intervening dust. Therefore, while the short-period Cepheids of Leo A appear to be intrinsically fainter than their equivalent in IC 1613 and the Magellanic Clouds, our data are not sufficient to conclusively claim the detection of a metallicity effect. On the other hand, the large number of Cepheids, combined with the fact that the metallicity of Leo A is significantly lower than any galaxy in the Rizzi et al. (2007) sample, make it a valuable galaxy when studying the metallicity dependences of the variable star PL relationships.
SUMMARY AND CONCLUSIONS
We have analysed time series HST/ACS data of the dIrr galaxy Leo A with the goal of searching for variable stars. Thanks to the significant depth of these data (i.e. >90 per cent complete 2 mag below the HB), we have found 156 Cepheids and 10 RR Lyrae stars, as well as 33 candidate variables of various types. The number of RR Lyrae stars is very low compared to any other galaxies where these variables have been searched for, but is not unexpected given the insignificant fraction of old stars ( ≳ 8 Gyr) in this galaxy ( ≲ 10 per cent; Cole et al. 2007; Hidalgo et al., in preparation). The classification of Leo A in one of the Oosterhoff groups from the properties of its RR Lyrae stars is not settled: while the mean periods and number ratio clearly indicate a OoII – which is uncommon in LG galaxies – the location of these stars in the period–amplitude diagram suggests it is Oosterhoff intermediate. Follow-up data covering a larger FOV will be necessary to increase the sample.
The numerous Cepheids generally have very short periods, with the mode of the distributions at ∼1 and ∼0.6 d for F and FO pulsators, respectively. From their position on the PL diagram and light-curve morphology, we classify 91, 58 and 4 Cepheids as fundamental, first-overtone, and second-overtone mode CC, respectively, and two as P2C. We have showed, however, that some of the fainter CC may actually be AC; neither the sparse light curves nor their location in the PL diagrams allowed us to distinguish them convincingly.
We have calculated the distance to Leo A using the TRGB luminosity and various methods based on the photometric and pulsational properties of the Cepheids and RR Lyrae stars. Our best distance based on the TRGB method is (m − M)0 = 24.57 ± 0.13, corresponding to 820 ± 50 kpc. This distance is in good agreement, within the uncertainties, with that obtained from the RR Lyrae stars [(m − M)0 = 24.48 ± 0.12] and the literature values. The distance obtained from the Cepheid PL relations, however, is somewhat larger than these values (m − M)0 = 24.70 ± 0.10. This may indicate that the short-period Cepheids of Leo A are intrinsically fainter than their equivalent in IC 1613 and the Magellanic Clouds. In any case, the very low metallicity of Leo A and its substantial populations of RGB stars, Cepheids and RR Lyrae stars make it a valuable galaxy to investigate the possible metallicity dependences of the variable star PL relationships.
Finally, while the current metallicity of Leo A is very low – the lowest within the star-forming galaxies of the LG – the morphology of the HB and RC in the CMD require that it was even lower about 10 Gyr ago. This suggests that the metallicity of Leo A has increased from [Fe/H] ∼ −2 to [Fe/H] ∼ −1.5 (i.e. a factor of ∼3) over the past 10 Gyr or so.
The authors are grateful to the anonymous referee for thoughtful comments that helped improve the manuscript. Support for this work was provided by a rolling grant from the UK Science and Technology Facilities Council, the IAC (grants 310394 and P/301204) and the Education and Science Ministry of Spain (grants AYA2007-3E3506 and AYA2010-16717).
Local Cosmology from Isolated Dwarfs: http://www.iac.es/project/LCID/.
Optical Gravitational Lensing Experiment: http://ogle.astrouw.edu.pl/
REFERENCES
APPENDIX A: FINDING CHARTS
The finding charts for the whole sample of variable stars are presented in the electronic version of this paper (Fig. A1).
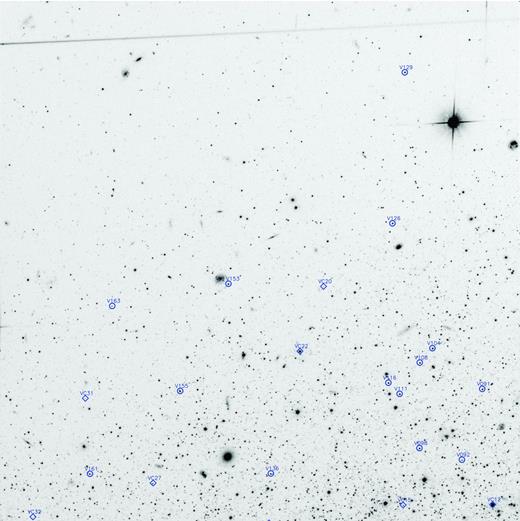
Finding chart for variables (circles) and candidate variables (diamonds) in the northeast quadrant. The full set of high-resolution finding charts is available as Supporting Information with the online version of the paper.
SUPPORTING INFORMATION
Additional Supporting Information may be found in the online version of this article:
Figure 6. Light curves of the Cepheids.
Figure A1. Finding chart for variables (circles) and candidate variables (diamonds) in the northeast quadrant.
Table 2. Photometry of the variable and candidate variable stars.
Table 3. Pulsational properties of the variable stars.
Please note: Oxford University Press are not responsible for the content or functionality of any supporting materials supplied by the authors. Any queries (other than missing material) should be directed to the corresponding author for the article.
Author notes
Based on observations made with the NASA/ESA Hubble Space Telescope, obtained at the Space Telescope Science Institute, which is operated by the Association of Universities for Research in Astronomy, Inc., under NASA contract NAS5-26555. These observations are associated with programme 10590.
