


Abstract
This paper presents the results of the 2009–2010 monitoring sessions of the starburst galaxy M82, obtained with the Multi-Element Radio-Linked Interferometer Network (MERLIN) at 5 GHz and e-MERLIN at 6 GHz. Combining several 5 GHz MERLIN epochs to form a map with 33.0 μJy bm−1 noise level, 52 discrete sources, mostly supernova remnants and H ii regions, are identified. These include three objects which were not detected in the 2002 5 GHz MERLIN monitoring session: supernova SN2008iz, the transient source 43.78+59.3, and a new supernova remnant shell. Flux density variations, in the long (1981 to 2010), medium (2002 to 2010) and short (2009 to 2010) term are investigated. We find that flux densities of supernova remnants (SNRs) in M82 stay constant in most of the sample (∼95 per cent), although the distributions of flux density variations show an offset from zero. This is consistent with a slight statistical reduction in flux density of the source distribution. In addition, aside from SN2008iz and the well-known variable source 41.95+57.5, two sources display tentative evidence for short- and medium-term variations over the period 2009–2010. These sources are amongst the most compact SNR in M82. These flux density variations could be due to changes in the circumstellar and interstellar medium in which the shocks travel.
1 INTRODUCTION
M82 is one of the closest (d = 3.2 Mpc; Burbidge, Burbidge & Rubin 1964) starburst galaxies known, producing a large population of massive, rapidly evolving stars, and an equally large number of supernovae. The central regions of the majority of starbursts suffer from high visual extinction. Radio observations, which are unaffected by dust, are thus ideal for the detection and study of these supernovae or supernova remnants (SNRs).
Over the past 30 yr, M82 has been subject to frequent radio monitoring at centimetre wavelengths with the Very Large Array (VLA; e.g. Kronberg et al. 2000; Allen 1999) and the Multi-Element Radio-Linked Interferometer Network (MERLIN; e.g. Muxlow et al. 1994; Fenech et al. 2008). With the detection of over 50 discrete objects, including over 30 SNRs, these regular observation programmes have the advantage of tracking the evolution of SNRs as their shells expand, which provides a way to investigate properties of the interstellar medium (see the review by Weiler et al. 2002). Since sources in M82 can be effectively treated as being at the same distance (their relative distances differing by only a few hundred parsecs, which is small compared with the overall distance of the galaxy), they can be studied with essentially the same linear resolution and luminosity sensitivity. Another advantage of studying extragalactic SNRs is that younger objects can be observed in M82 (from a few to a few hundred years) than in the Milky Way (until recently, the youngest was Cassiopeia A, which is over 300 yr old; however, Green et al. (2008) discovered a younger galactic SNR ∼150 yr old). In addition, new sources such as SN2008iz (Brunthaler et al. 2009) or the radio transient 43.78+59.3 (Muxlow et al. 2010) would not have been detected without regular radio monitoring. Finally, the number of SNRs detected provides a way of determining star formation rates in starburst galaxies, based on the number of sources in the galaxy, which is related to the supernova rate, and by assuming a given initialmass function (Condon 1992; Botticella et al. 2012).
Regular observation programmes also allow for the monitoring of flux density variability in sources (e.g. Kronberg et al. 2000), such as 41.95+57.5, which has shown a continued decrease in flux density since its first observation in 1965 (Trotman 1996; Muxlow et al. 2005).
This paper presents and discusses the results of the 2009–2010 monitoring sessions, which includes seven epochs at 5 GHz with MERLIN and one epoch at 6 GHz with e-MERLIN. These results have been supplemented with results from the literature (Kronberg et al. 2000; Fenech et al. 2008) increasing the time-span of monitoring observations to 30 yr. It is expected that most sources will show no (or only very little) flux density variations over the time periods presented here (Ulvestad & Antonucci 1994; Weiler et al. 2002). This work also intends to investigate the behaviour of SNR in M82 and compare it to previous models (e.g. Seaquist & Stanković 2007).
Details of the data reduction techniques are given in Section 2, while Section 3 describes the source identification process and flux density measurements. Finally, flux density variations in the identified sources are discussed in Section 4, including more detailed discussions about a few sources in Section 4.1.
2 MERLIN OBSERVATIONS AND IMAGE PROCESSING
The 2009 monitoring campaign of M82 consisted of seven wide-field MERLIN (Thomasson 1986) observations at a frequency of 4.994 GHz, observed between 2009 May and 2010 April. These were made using parallel hands of circular polarization, and were correlated with a total bandwidth of 16 MHz divided into 32 channels. Across all epochs combined a total on-source integration time of 286.5 h was used. Each observing epoch was reduced and analysed individually and a deep exposure map was produced by combining all of these data. In addition to these, a single e-MERLIN observation was included in this study. This observation was made in 2010 December as part of the e-MERLIN commissioning programme and used a total bandwidth of 512 MHz with a median frequency of 6.26 GHz. These data were correlated into four individual sub-bands each divided into 512 frequency channels. These e-MERLIN observations were observed prior the installation of the new e-MERLIN wide-band IF system in spring 2011 and consequently only one hand of polarization was used and the data displayed reduced sensitivity in parts of the observing band. Furthermore, details of both the MERLIN and e-MERLIN observations, including archival data, are provided in Table 1.
Details of 2009–2010 MERLIN (EP1–7), 2010 e-MERLIN (EP8) and archival MERLIN observations. ToS correspond to time on source (in hours)a and the rms noise is given in μJy bm−1b. Unless indicated otherwise, the observations were done without the Lovell telescope. The table also displays, in the last column, measured values of flux density (in mJy)c of the phase calibrator 0955+697. The flux density for EP8, measured at 6.0 GHz, was converted to 4.995 GHz using S ∝ να, where α = −0.23 (Vollmer et al. 2010) for this source.
| Ep. | Start date of observation | No. of antennas | ToSa | rmsb | Sintc 0955+697 |
|---|---|---|---|---|---|
| 2002 | 6 | 175.0 | 23.0 | 70.0 ± 0.2 | |
| 2005 | 7L | 9.0 | 55.0 | 76.8 ± 0.2 | |
| EP1 | 2009-05-01 | 6 | 65.6 | 61.0 | 79.4 ± 0.2 |
| EP2 | 2009-05-26 | 5T | 12.2 | 150.0 | 80.7 ± 0.4 |
| EP3 | 2009-07-28 | 5D | 110.2 | 39.0 | 94.0 ± 0.1 |
| EP4 | 2009-08-19 | 5D | 34.9 | 91.0 | 99.6 ± 0.3 |
| EP5 | 2009-09-12 | 6 | 28.9 | 70.0 | 92.7 ± 0.3 |
| EP6 | 2009-09-25 | 6 | 25.9 | 61.0 | 84.2 ± 0.3 |
| EP7 | 2010-04-06 | 6 | 8.8 | 100.0 | 99.3 ± 0.4 |
| COMB. | 2009 | 286.5 | 33.0 | – | |
| EP8 | 2010-12-17 | 6 | 19.1 | 40.0 | 125.2 ± 0.4 |
T Tabley Telescope not available.
D Defford Telescope not available.
L Including Lovell telescope.
For both MERLIN and e-MERLIN data, the calibrator 3C286 was used to set the primary flux density scales and the point source calibrator OQ208 was used to determine the bandpass and relative gains of the antennas. Observations of the phase reference source, 0955+697, were interleaved throughout each of the observations and used to determine the telescope phases. Following phase calibration, these data were re-weighted appropriately to account for the relative sensitivity of each MERLIN antenna. All epochs, as well as the combined 2009 epoch, were then imaged separately.
3 SOURCE MONITORING
3.1 Source identification
Fenech et al. (2008) identified 55 sources during the 2002 deep-integration MERLIN observation of M82, and 49 of them, with Speak ≥ 99 μJy bm−1 (∼3σ), were detected in our 2009–2010 combined field. Of the other six, three sources lie outside of the imaged area (37.53+53.2, 38.76+53.5 and 46.56+73.8) and three have Speak < 3σ (42.62+59.9, 42.66+51.6 and 43.55+60.0). Supernova SN2008iz (Brunthaler et al. 2009) and the transient source 43.78+59.3 (Muxlow et al. 2010) were also identified.
In order to search for possible new sources, each of the 51 identified sources were imaged and subtracted from the uv-data. The resulting data set was then re-imaged, using the same parameters as the original field. Following inspection of this new image, one new source was identified (44.28+61.1, see Section 4.1), bringing the total number of identified sources to 52 (Fig. 1 and Table 2).
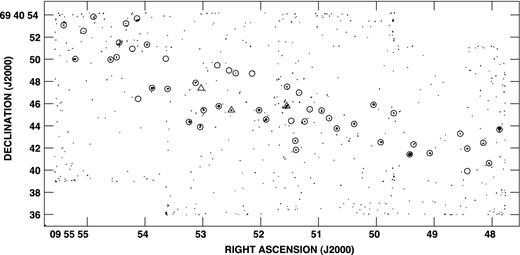
Position of the 52 sources in M82 identified from the 5 GHz MERLIN combined data presented in this work (contour plot at −1, 1, 1.414, 2, 2.828, 4, 5.656, 8, 11.282, 16 × 99 μJy bm−1). Sources present in Fenech et al. (2008) are represented by circles while new sources are represented by triangles.
Combined epoch (averaged over all 2009 data) normalized (as described in Section 3.2) 2009 peak and integrated flux densities, for all 52 detected objects. Sources previously identified in the literature as SNRs or H ii regions have been labelled accordingly. These identifications are taken from Muxlow et al. (1994), Wills et al. (1997), Allen (1999) and McDonald et al. (2002). The right ascension and declination are offset from 09h 55m 53|${^{\mathrm{s}}_{.}}$|00 and +69°40′ 00′′(J2000), while the source name corresponds to the equivalent offset in B1950 coordinates. Peak flux densities were measured with an error of ± 0.01 mJy.
| Number | Name | RA | Dec. | Peak flux density | Integrated flux density | Comments |
|---|---|---|---|---|---|---|
| (J2000) | (mJy bm−1) | (mJy) | ||||
| 1 | 39.10+57.3 | 47.87 | 43.7 | 0.51 | 4.50 ± 0.65 | SNR |
| 2 | 39.28+54.1 | 48.05 | 40.6 | 0.22 | 0.23 ± 0.05 | H ii |
| 3 | 39.40+56.2 | 48.15 | 42.5 | 0.22 | 1.13 ± 0.29 | SNR |
| 4 | 39.64+53.3 | 48.41 | 39.7 | 0.16 | 0.32 ± 0.09 | SNR |
| 5 | 39.67+55.5 | 48.43 | 41.9 | 0.34 | 1.22 ± 0.22 | H ii |
| 6 | 39.77+56.9 | 48.55 | 43.3 | 0.15 | 0.36 ± 0.10 | SNR |
| 7 | 40.32+55.2 | 49.07 | 41.5 | 0.27 | 1.35 ± 0.27 | SNR |
| 8 | 40.61+56.3 | 49.33 | 42.3 | 0.18 | 1.27 ± 0.33 | SNR |
| 9 | 40.68+55.1 | 49.42 | 41.4 | 0.50 | 7.19 ± 0.90 | SNR |
| 10 | 40.94+58.8 | 49.69 | 45.2 | 0.25 | 0.73 ± 0.17 | H ii |
| 11 | 41.18+56.2 | 49.92 | 42.5 | 0.23 | 1.76 ± 0.44 | H ii |
| 12 | 41.30+59.6 | 50.04 | 45.9 | 0.61 | 2.54 ± 0.29 | SNR |
| 13 | 41.64+57.9 | 50.38 | 44.2 | 0.22 | 1.02 ± 0.22 | H ii |
| 14 | 41.95+57.5 | 50.68 | 43.8 | 11.92 | 14.17 ± 0.19 | SNR(?) |
| 15 | 42.08+58.4 | 50.82 | 44.7 | 0.15 | 0.34 ± 0.09 | H ii |
| 16 | 42.20+59.1 | 50.94 | 45.3 | 0.32 | 0.99 ± 0.19 | H ii |
| 17 | 42.43+59.5 | 51.15 | 45.6 | 0.16 | 0.38 ± 0.15 | Unknown |
| 18 | 42.48+58.4 | 51.25 | 44.2 | 0.31 | 1.37 ± 0.37 | H ii |
| 19 | 42.61+60.7 | 51.35 | 46.9 | 0.19 | 0.67 ± 0.16 | SNR |
| 20 | 42.67+55.6 | 51.37 | 41.8 | 0.20 | 0.81 ± 0.19 | SNR |
| 21 | 42.67+56.3 | 51.40 | 42.6 | 0.24 | 0.63 ± 0.13 | SNR |
| 22 | 42.69+58.2 | 51.44 | 44.3 | 0.15 | 0.21 ± 0.06 | H ii |
| 23 | 42.80+61.2 | 51.54 | 47.5 | 0.23 | 0.55 ± 0.11 | SNR |
| 24 | 42.81+59.6a | 51.55 | 45.8 | 31.60 | 33.57 ± 0.17 | SN |
| 25 | 43.18+58.2 | 51.90 | 44.6 | 1.24 | 4.79 ± 0.33 | SNR |
| 26 | 43.31+59.2 | 52.03 | 45.4 | 6.60 | 12.52 ± 0.22 | SNR |
| 27 | 43.40+62.6 | 52.14 | 48.7 | 0.18 | 0.61 ± 0.16 | SNR |
| 28 | 43.72+62.6 | 52.43 | 48.8 | 0.25 | 0.42 ± 0.09 | SNR |
| 29 | 43.78+59.3a | 52.51 | 45.4 | 0.80 | 0.90 ± 0.09 | Trans. |
| 30 | 43.82+62.8 | 52.54 | 49.0 | 0.16 | 0.33 ± 0.09 | SNR |
| 31 | 44.01+59.6 | 52.72 | 45.8 | 13.07 | 25.88 ± 0.25 | SNR |
| 32 | 44.08+63.1 | 52.75 | 49.5 | 0.12 | 0.15 ± 0.06 | SNR |
| 33 | 44.28+59.3 | 52.99 | 45.5 | 0.34 | 1.72 ± 0.32 | SNR |
| 34 | 44.28+61.1b | 53.00 | 47.4 | 0.17 | 0.40 ± 0.11 | SNR(?) |
| 35 | 44.34+57.8 | 53.05 | 43.9 | 0.21 | 0.98 ± 0.23 | SNR |
| 36 | 44.40+61.8 | 53.13 | 47.9 | 0.25 | 1.19 ± 0.25 | SNR |
| 37 | 44.51+58.2 | 53.23 | 44.3 | 0.25 | 2.38 ± 0.54 | SNR |
| 38 | 44.89+61.2 | 53.61 | 47.3 | 0.31 | 1.16 ± 0.21 | SNR |
| 39 | 44.93+64.0 | 53.64 | 50.0 | 0.19 | 0.39 ± 0.10 | H ii |
| 40 | 45.17+61.2 | 53.88 | 47.4 | 3.11 | 8.72 ± 0.44 | SNR |
| 41 | 45.24+65.2 | 53.96 | 51.4 | 0.21 | 1.15 ± 0.26 | SNR |
| 42 | 45.39+60.3 | 54.12 | 46.4 | 0.17 | 1.00 ± 0.26 | Unknown |
| 43 | 45.42+67.4 | 54.13 | 53.5 | 0.28 | 2.56 ± 0.55 | SNR |
| 44 | 45.52+64.7 | 54.22 | 50.9 | 0.09 | 0.12 ± 0.05 | SNR |
| 45 | 45.62+67.0 | 54.32 | 53.1 | 0.24 | 1.54 ± 0.37 | H ii |
| 46 | 45.75+65.3 | 54.46 | 51.5 | 0.20 | 2.24 ± 0.54 | SNR |
| 47 | 45.79+64.0 | 54.50 | 50.2 | 0.21 | 0.49 ± 0.11 | SNR |
| 48 | 45.89+63.8 | 54.60 | 50.0 | 0.58 | 1.60 ± 0.20 | SNR |
| 49 | 46.17+67.6 | 54.89 | 53.8 | 0.24 | 2.35 ± 0.57 | H ii |
| 50 | 46.34+66.2 | 55.06 | 52.5 | 0.18 | 0.67 ± 0.17 | Unknown |
| 51 | 46.52+63.9 | 55.20 | 50.0 | 0.42 | 2.68 ± 0.47 | SNR |
| 52 | 46.70+67.1 | 55.38 | 53.2 | 0.22 | 2.29 ± 0.54 | SNR |
3.2 Flux density measurements
The flux densities of all compact sources in M82, as well as of the phase calibrator 0955+697, were measured for each of the eight epochs using the aips task TVSTAT, and any background flux density surrounding the sources subtracted. In order to convert all flux densities in this work to 5 GHz, spectral index information for each source was retrieved from McDonald et al. (2002), Brunthaler et al. (2009) and Muxlow et al. (2010). When unavailable, standard values of α = 0.0 and α = −0.7 were used for H ii regions and SNR, respectively.
The overall flux density calibration scale, as derived from observations of the standard flux density calibrator source 3C 286 on an epoch by epoch basis, is accurate to few per cent; however, some small systematic variations in the flux density scale may remain between individual epochs. Since the phase reference calibrator shows significant flux density variations on the time-scales of this monitoring project (Fig. 2), an internal cross-calibration procedure following the methodology of Kronberg et al. (2000) was applied to the results to assess and correct for any systematic differences in the flux density calibration of these data. Following the initial calibration and imaging of these target data, the flux densities of the brightest and most historically stable SNRs identified by Kronberg et al. (2000) were measured to assess whether any systematic, inter-epoch trends were visible in their flux density.
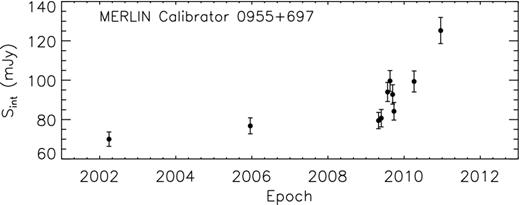
Measured flux densities of the phase calibrator 0955+697 over the period 2002–2010.
The bright sources 40.68+55.1, 43.31+59.2, 44.01+59.6 and 45.17+61.2 which showed a consistent trend (as defined by Kronberg et al. 2000) were used to provide a re-normalization of the flux density scale between individual epochs (Fig. 3). For each source, the differences between flux density measurement at a given epoch and the best-fitting line to the data is computed. The resulting corrections for each epoch were computed by averaging these differences between each source, epoch by epoch.
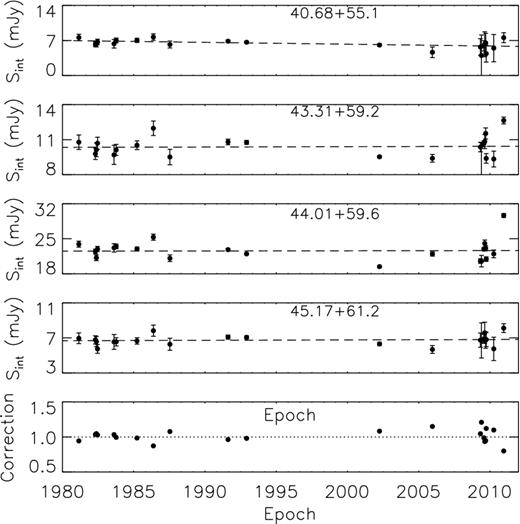
Top: light curve for the bright stable sources (from top to bottom) 40.68+55.1, 43.31+59.2, 44.01+59.6 and 45.17+61.2 used for internal calibration, using data over the periods 1981–1991 (Kronberg et al. 2000) and 2002–2010 (present work). Bottom: magnitude of the internal calibration corrections applied.
Details of the averaged flux density measurements (over the seven 2009 MERLIN epochs) are given in Table 2. In addition to the 2002 (Fenech et al. 2008) and 2009 data, flux density measurements (which were also normalized as described above) from a 2005 MERLIN monitoring session (Argo 2006) were also included. These observations were conducted at a frequency of 4.754 GHz in 2005 December, with parallel hands of circular polarization, a bandwidth of 16 MHz divided into 32 channels, and a total on-source integration time of nine hours.
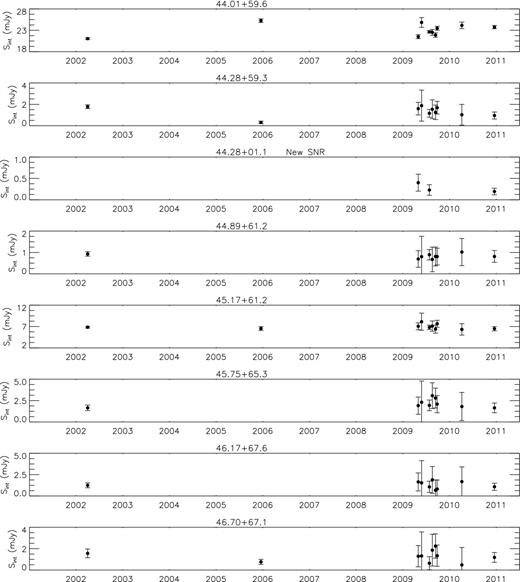
Data for each epoch can be found in Table A and a few select light curves are displayed in Fig. 4.

– continued
4 RESULTS
Since very rapid changes in flux density are not physically expected for the observed sources, and epoch-to-epoch variations can be strongly dependent on calibration methods, the approach to measure variability used in this work does not examine these very short-term changes. With these considerations in mind, we find that most of the sampled sources in M82 show no significant changes in flux densities over all time-scales.
To improve our analysis of variation, data taken over an 11 yr period from 1981 (Kronberg et al. 2000) were added to the light curves when available (21 out of 52 sources). A systematic shift of ∼1.07 mJy between the VLA of Kronberg et al. (2000) and MERLIN data was removed from the VLA data. This difference of the overall flux density of each source is due to the higher beam size of the VLA observation of Kronberg et al. (2000), which will be sensitive to more diffuse matter than the MERLIN data presented here. Changes in the flux density of the detected sources were studied in the short, medium and long term (over the 2009–2010, 2002–2010 and 1981–2010 periods, respectively). A line S(t) (with t in months for short term and years for medium and long terms) was fitted through every light curve and the slope used to determine which sources displayed consistent flux density variations. The distribution of slopes was fitted with a Gaussian model (Fig. 5). Sources that are outliers from the distribution (with a rate of change outside of 2.5σ) are defined as potentially variable, and these are discussed in Section 4.1. Note that these sources, whilst deemed variable for the purpose of this study, have formal individual errors which are significant compared to any apparent rate of change of flux density.
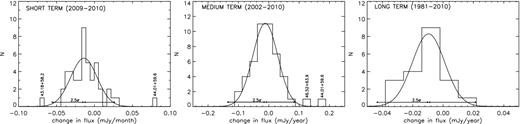
Short-term (over the 2009–2010 period, left), medium-term (over the 2002–2010 period, centre) and long-term (over the 1981–2010 period, right) variability, as described in Section 4. Names correspond to sources with rates of change outside a 2.5σ limit of the distribution. SN2008iz and the variable source 41.95+57.5 lie well outside the range of this plot and are not represented.
SN2008iz (Xshort = −0.9 mJy month−1) and the variable source 41.95+57.5 (Xlong = −3.1 mJy yr−1), which show extreme variation, are not represented in these plots. In addition, the Gaussian distributions in Fig. 5 show an offset from zero, which is consistent with a constant or slight decrease in flux densities of the ensemble sources at all epochs, although within one sigma of the measurements (0.8σ, 0.3σ and 0.9σ for short, medium and long term, respectively).
The left-hand panel of Fig. 5 shows flux variability in the short term (over the period 2009–2010). The sources 43.18+58.2 and 44.01+59.6 show hints of variations. The central panel of Fig. 5 shows flux density variability in the medium term (over the period 2002–2010). The sources 44.01+59. and 46.52+63.9 show steady changes in flux density. Finally, the right-hand panel of Fig. 5 shows flux variability in the long term (over the period 1981–2010). No evidence of individual variation in flux density is seen in any of the 21 sources considered. All variability values are shown in Table 3, while the light curves for varying sources are displayed in Fig. 6.
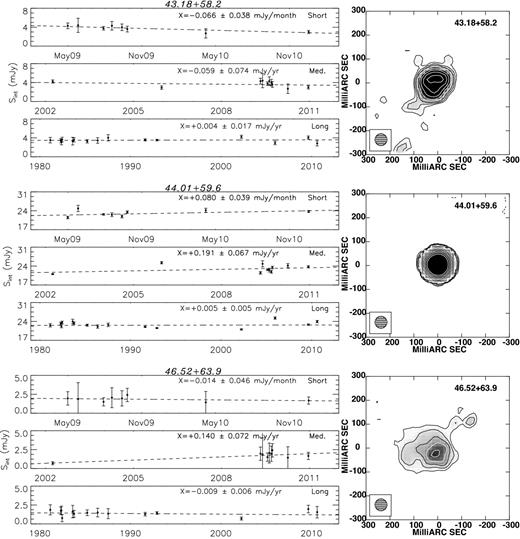
Left: short-, medium- and long-term light curves over the period 2009–2010 (top), 2002–2010 (centre) and 1981–2010 (bottom, where the 1981–1991 data were retrieved from Kronberg et al. 2000) for sources showing noticeable decrease in flux density (shown in bold font on the plots), aside from 41.95+57.5 and SN2008iz (Table 3). For long-term variation, flux measurements were averaged over EP1–6 for 2009 and EP7–8 for 2010 (as described in Table 1). A line S(t) = S0 + Xt was fitted to each curve (dashed line), where X characterizes the variation in mJy month−1 and mJy yr−1 for short and medium/long terms, respectively. Right: contour plot at −1, 1, 1.414, 2, 2.828, 4, 5.656, 8, 11.282, 16, 22.564, 32, 45.1286 × 99 μJy bm−1 of the source from the combined 2009–2010 MERLIN data. The beam size of 50×50 mas is shown in the bottom left-hand panel.
Characteristics of the sources showing flux density variations (shown in large font in the table), aside from 41.95+57.5 and SN2008iz, in M82. Short-term decrease rates were derived from the 2009–2010 data while sizes, radial velocities and ages (upper limits assuming constant expansion) were retrieved from Fenech et al. (2008)a. Medium-term decrease rates were computed over the period 2002–2010 and long-term decrease rates over 1981–2010, where the 1981–1991 data were retrieved from Kronberg et al. (2000). The corresponding light curves are shown in Fig. 6.
| 2009 Integrated | Apparent rate of change | Sizea | Radial | Agea | |||
|---|---|---|---|---|---|---|---|
| Source | flux density | Short term | Medium term | Long term | velocitya | ||
| 2009–2010 | 2002–2010 | 1981–2010 | |||||
| (mJy) | (mJy month−1) | (mJy yr−1) | (mJy yr−1) | (pc) | (km s−1) | (yr) | |
| 43.18+58.2 | 4.79 ± 0.33 | −0.066 ± 0.038 | −0.059 ± 0.074 | +0.004 ± 0.017 | 1.9 ± 0.1 | 10500 ± 2300 | 55 |
| 44.01+59.6 | 25.88 ± 0.25 | +0.080 ± 0.039 | +0.191 ± 0.067 | +0.005 ± 0.005 | 0.8 ± 0.1 | 2700 ± 400 | 140 |
| 46.52+63.9 | 2.68 ± 0.47 | −0.014 ± 0.046 | +0.140 ± 0.072 | −0.009 ± 0.006 | – | – | – |
We note that the majority of the sources showing short-term flux density variation are the most compact objects on VLBI scales in M82 (Fenech et al. 2008) after 41.95+57.5, whose flux density is known to steadily decrease by ∼8.8 per cent yr−1 (Trotman 1996; Kronberg et al. 2000; Muxlow et al. 2005). Each source showing possible flux density variations is discussed in more detail below.
4.1 Variable sources
A total of six sources have shown flux density changes (i.e. with rate of change outside of 2.5σ of the distribution) in the short, medium or long term, including 41.95+57.5, SN2008iz and the transient source 43.78+59.3. The latter, being quite particular objects, will be discussed separately in Sections 4.1.1, 4.1.2 and 4.1.3. Some characteristics of the other sources, including flux density rates of change and sizes, are given in Table 3. Note that, in order to select a sub-sample of sources which vary significantly compared to the overall distribution, we have selected statistical outliers from that distribution. The error on flux variation of individual sources in some cases may be large, implying a statistically less significant result when considered in isolation.
Two of the three other varying sources (43.18+58.2 and 44.01+59.6) have small angular sizes, and are in fact some of the most compact SNR in M82 after 41.95+57.5 and SN2008iz. Based on expansion velocity measurements from VLBI and MERLIN data, Fenech et al. (2008) and Beswick et al. (2006) determined that these sources are amongst the youngest in M82, with ages of ≤55 and ≤140 yr (as of 2002). Consequently, their short- and medium-term brightness variations could be explained by changes in the circumstellar and interstellar medium (ISM) through which these shocks travel. This may imply that these sources are at a different temporal stage in their evolution compared with the older more stable sources.
Finally, the third source showing flux density variation, 46.52+63.9, shows only medium-term variability. From its light curves in Fig. 6, the variation can be explained by an anomalously low value of the source flux density measured in 2002. The source is then excluded from the varying sample.
4.1.1 41.95+57.5
This source has shown a continued decrease in flux density of ∼8.8 per cent yr−1 since its first observation in 1965 (Trotman 1996; Muxlow et al. 2005). This decay rate would imply that, at birth, the source would have had a flux density of ∼30 Jy (assuming a free expansion and a source age of ∼80 yr; Fenech et al. 2008). These two facts (continuous decay and high flux density at birth) suggest that 41.95+57.5 is likely to be an exotic event and several suggestions have been made as to its nature, including the possibility that it may have been an off-axis gamma-ray burst (Muxlow et al. 2005).
As seen in Fig. 7, 41.95+57.5 still shows a steady decrease in flux density. However, its rate of change in flux density has decreased from 8.8 per cent yr−1 in 1981 to 6.4 per cent in 2010, when fitting between 1993 and 2010.
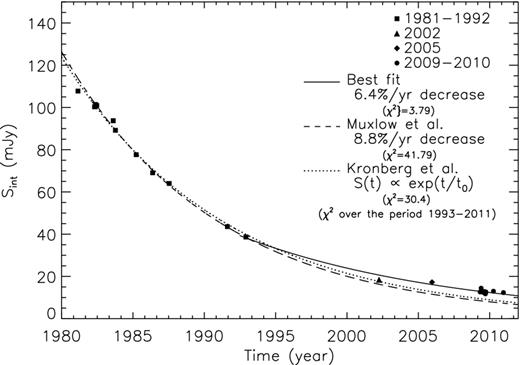
Light curve for the source 41.95+57.5 over the period 1981–2010. Data for each period were retrieved as follows: 1981–1991 from Kronberg et al. (2000), 2002 from Fenech et al. (2008), 2005 from Argo (2006), 2009–2010 from this work. Models for the flux density decrease are based on an exponential decay (dotted line; Kronberg et al. 2000), an 8.8 per cent yr−1 decay (dashed line; Muxlow et al. 2005) and our best-fitting 6.4 per cent yr−1 decay (solid line) for the period 1993–2010. The values of χ2 quoted here correspond to the reduced chi-square statistics for each fit.
VLBI observations of 41.95+57.5 by Beswick et al. (2006) in 1998 November and 2001 February show the source to be expanding at a rate of ∼2000 ± 500 km s−1. However, further VLBI data from 2005 (Fenech 2007; Fenech et al. 2010) show that the apparent radius of 41.95+57.5 may have decreased between 2001 and 2005 (30.4 mas in 2001 and 26.85 mas in 2005).
The unusually luminous radio supernova SN1986J in NGC891 and 41.95+57.5 shows some distinct similarities. Both sources display an asymmetric radio structure on milliarcsecond scales, modest (few 1000 km s−1) expansion velocities, relatively high initial radio luminosities and a power-law flux density decay (Bietenholz, Bartel & Rupen 2010). In recent VLA and VLBI observations the spectral index of SN1986J has been seen to be evolving rapidly above 5 GHz, deviating from the flux density decline observed at lower frequencies. This has coincided with 8.4 and 15 GHz global VLBI observations detecting an emerging, inverted spectrum source in the centre of the SNR (Bartel 2009). It has been asserted that this new source may be a plerion or pulsar wind nebula (Bietenholz et al. 2004).
Both the possible decrease in apparent angular size (Beswick et al. 2006; Fenech et al. 2008) and the small deviation from the historical flux density decline of 41.95+57.5 in these recent 5 GHz flux density measurements could be consistent with the potential appearance of a new higher frequency central component within the shell, or that 41.95+57.5 comprises two components: a central, constant flux density one with a thermal-like spectrum, plus a larger component with a synchrotron spectrum that is simultaneously expanding and declining in flux density. In both of these scenarios, up until recent times, the synchrotron source has dominated the observed characteristics of the object. As such, this source may be undergoing an evolution analogous to that observed in SN1986J, albeit in a much older remnant. Unfortunately, the MERLIN and e-MERLIN observations presented here do not have adequate angular resolution to image in detail the structure of this source and, as yet, higher frequency (>1.6 GHz) VLBI observations have not confirmed this hypothesis. Furthermore, analysis of the variation in flux densities of 41.95+57.5 and SN1986J, both in time and frequency, would be needed to assess the similarity between the sources.
4.1.2 42.81+59.6 – SN2008iz
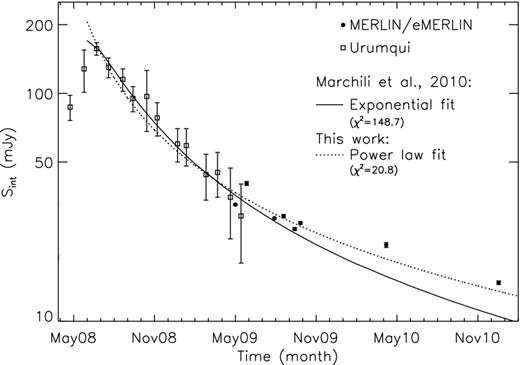
Light curve for SN2008iz. 5 GHz data from single dish Urumqi observations (Marchili et al. 2010) and the MERLIN/e-MERLIN data are shown as open squares and filled circles, respectively. An exponential decay model (equation 1) was fitted to the curve using parameters from Marchili et al. (2010) – solid curve – as well as a power-law decay model – dotted curve – which displays the best fit to the decay part of the curve. The values of χ2 quoted here correspond to the reduced chi-square statistics for each fit.
Whilst further later time measurements are required to confirm these results, there is tentative evidence that the radio light curve of SN2008iz is showing a small reduction in the rate of its flux density decline.
4.1.3 43.78+59.3 – Transient source
This source was not present in the 2002 and 2005 data but was detected in 2009 (Muxlow et al. 2010) and in the MERLIN observation presented here. Muxlow et al. (2010) suggested that this object might either be due to accretion around a massive collapsed object or be a faint and unusual supernova (Joseph, Maccarone & Fender 2010). In the latter case, we would expect the flux density to steadily decrease over time, as the source would be too young to have reached the remnant phase. However, in the observations presented here, it shows a flux density at 5 GHz of ∼0.90 mJy, which does not seem to vary significantly over the period 2009 May–2010. The supernova hypothesis is thus unlikely.
4.2 44.28+61.1 – a newly detected SNR shell
This source, located at position 09h 55m 53|${^{\mathrm{s}}_{.}}$| 00 +69° 40′ 47|${^{\prime\prime}_{.}}$| 24 (J2000), was not visible in the 2002 MERLIN data. It has a peak flux density value of Speak = 0.18 mJy bm−1 and an integrated flux density of 0.40 ± 0.36 mJy from the combined field. Being shell like in shape (Fig. 9), it is most likely an SNR.
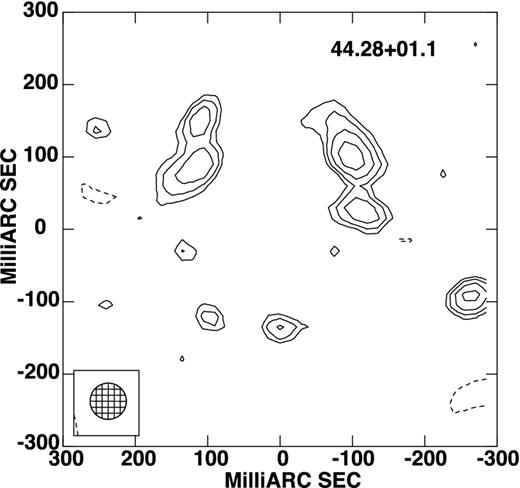
Contour plot at −1, 1, 1.414, 2, 2.828, 4, 5.656, 8, 11.282 × 99 μJy bm−1 of SNR 44.28+61.1. The beam size of 50 × 50 mas is shown in the bottom left-hand panel.
By measuring the source extent, the age of the SNR can be inferred. The radius of the source was determined using the aips annular profiles task IRING, giving r = 140 ± 5 mas (Fig. 10). At the distance of M82 (3.2 Mpc), this gives an estimated radius of 2.1 pc. Fenech et al. (2008) measured expansion velocities of SNRs in M82 to be between 2200 and 10500 km s−1, with a mean velocity of vexp = 5650 km s−1. Using the latter value, we can estimate the age of 44.28+61.1 to be ∼360 yr (assuming constant expansion).
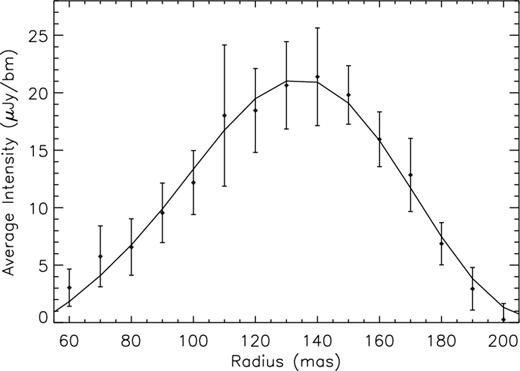
Azimuthally averaged radial intensity profile and best-fitting model (solid line) of SNR 44.28+61.1 obtained from aips annular profiles task IRING. The peak intensity occurs at r = 140 ± 5 mas, taken to be the radius of the shell.
5 DISCUSSION
5.1 Possible observational effects
Before discussing possible physical explanations for the long-term observed flux density decay of the sources in M82 (or lack thereof), it would be prudent to consider any observational explanations for any apparent variation. The data from Kronberg et al. (2000) are from VLA A-configuration observations of M82 with a resolution of 350 mas compared to the 50 mas resolution of the 2009–2010 MERLIN observations. As such, virtually all of the sources discussed that were observed in both sets of observations will be unresolved in these VLA data and resolved in these MERLIN data. As the MERLIN array lacks shorter baselines, it is comparatively insensitive to the larger spatial scales, potentially ‘resolving out’ some of the emission associated with a given SNR. It is however considered unlikely that this would explain the observed flux density decay for the varying sources, and such an effect would become more pronounced for the larger, fainter and more diffuse SNR. All of the larger, diffuse sources do not show any flux density variation. This is compounded by the fact that the decay is not only apparent between the VLA and MERLIN data, but continues within the MERLIN-only data.
The final observational consideration is that we are essentially measuring structurally evolving sources with a fixed system, i.e. with a fixed uv-distribution which therefore becomes sensitive to slightly different structures as a source evolves. However, it is unlikely that this would account for the flux density decreases observed, particularly over the time-scales considered. All of the varying sources are well defined, in general compact, and bright; thus such an effect would be more observable for higher velocity sources or those that are already more diffuse.
5.2 Physical explanation
Of the sources observed in the data presented here, two show short- and medium-term variations in flux density: 43.18+58.2 and 44.01+59.6. These sources are some of the most compact objects in M82 after 41.95+57.5, SN2008iz and the transient source 43.78+59.3, with measured sizes of 0.8 and 1.9 pc in MERLIN 2002 observations (Fenech et al. 2008).
As discussed in Fenech et al. (2010), the SNRs in M82 are expected to be the result of core-collapse supernova events with a massive, typically red supergiant (RSG), progenitor star. At the time of the supernova explosion, there will be a complex circumstellar environment consisting of a slow-moving dense RSG wind with a density profile of ρ ∝ r−2 followed by a wind-blown bubble of almost constant low density produced by the main-sequence low-density, high-velocity wind. Beyond this wind-driven bubble (WDB), there will exist potentially the remains of a collapsed H ii region and eventually the ambient ISM (Weiler et al. 2002, and references therein).
It is generally accepted that following the evolution through the wind-blown bubble, it is likely that there will be a peak in flux density as the supernova ejecta travels from the low-density WDB into the higher-density ISM (particularly in the case of M82). This will primarily be caused by the production of a thin-dense shell at the edge of the wind-blown bubble. There will however, also be a subsequent decline in flux density as the ejecta traverses this shell and emerges into the ISM, traditionally considered the transitional phase from a supernova to an SNR. It is possible that these transition phases could provide an explanation for the observed flux density changes.
M82 SNRs appear to be a more luminous population than those in the Milky Way and the Large Magellanic Cloud (LMC), and typically appear to settle into a constant flux evolution on shorter time-scales and at smaller diameters than their Galactic counterparts. This is commonly attributed to the higher density environment within the starburst region in which they are situated. The high pressures associated with starburst activity reduce the ability of mass-loss from the progenitor star to expand into the ISM. This implies that the denser the environment, the shorter the distance over which a shock has to travel to have fully traversed the circumstellar medium and sweep up sufficient material to enter Sedov evolution and become a well-established SNR. More extreme starburst galaxies, such as Arp 220, have shown a mixed population of compact sources covering SNe, SNRs and transition objects. They all typically show smaller sizes and higher luminosities, consistent with an extrapolation of evolution within an even denser environment than that found in M82.
A study of SNRs in Arp 220 by Batejat et al. (2011) determined that 3–5 of 18 sources, with sizes between 0.2 and 0.4 pc, show variations over the period 2006–2008 (i.e. there is a change in flux >50 per cent between the two epochs), corresponding to short time-scale changes in this work. These numbers are in accordance with our findings here, considering that Arp 220 is a more active starburst galaxy than M82. From fig. 5 of Batejat et al. (2011), the variable sources in Arp 220 and the compact variable sources in M82 fall into the range of sizes which is compatible with an SN to SNR transition (0.2–0.3 pc in Arp 220 and 0.7–2.0 pc in M82). This progression could explain the changes in flux density.
Seaquist & Stanković (2007) explore an alternative explanation for the compact non-thermal sources observed in M82, specifically that they could be WDBs associated with very young super star clusters as opposed to SNR. One of the primary motivations for presenting this hypothesis is the lack of flux density variability for the majority of the compact sources within M82 as reported by Kronberg et al. (2000). The work presented here has shown that two of the most compact sources (apart from SN2008iz and 41.95+57.5) show flux density variability in the short and/or medium term over the period 2002–2010, all of which have measured expansion velocities of ≥2700 km s−1 (Beswick et al. 2006; Fenech et al. 2008, 2010), suggesting ages of approximately a few hundred years. This can be added to the evidence provided by measured expansion velocities for many of these sources which contradicts the WDB hypothesis of Seaquist & Stanković (2007). The possibility that these compact sources are SNR in the transitional phase from circumstellar to ISM fits well with a similarly observed population of sources within Arp 220, taking into account the higher pressures involved in the more intense star formation environment within this galaxy. This would also suggest that the more diffuse non-thermal sources within M82 should show little variation in flux density as they would now be expanding into the roughly constant density ISM. This does not rule out the potential for some of the non-thermal compact sources to be WDBs and not SNR. It is interesting to note, however, that the two sources showing flux density variability with measured expansion velocities, pass the feasibility tests outlined in Seaquist & Stanković (2007), clearly suggesting that the proposed tests do not adequately distinguish between the WDB and SNR models.
Continued regular monitoring of these sources will give us more insights to their behaviour. It is now possible to carry this out with new sensitive instruments such as e-MERLIN and the JVLA, and we expect to get a more complete view of the evolution of SNRs in M82. This will allow the investigation of fainter and/or transient objects in star-forming galaxies such as M82.
6 SUMMARY AND CONCLUSION
We presented the results of the 2009–2010 monitoring sessions of the galaxy M82, obtained with MERLIN and e-MERLIN at 5 and 6 GHz, respectively. The data include eight epochs between 2009 May and 2010 December, and were compared with data from the 2002 April monitoring session of Fenech et al. (2008).
A total of 52 sources were detected, including three sources absent from the 2002 data: supernova SN2008iz, the transient source 43.78+59.3 and a new SNR shell, 44.28+61.1. Although the first two were previously observed (Brunthaler et al. 2009; Muxlow et al. 2010), the latter was first detected here.
Light curves for all sources have been compiled, including flux density measurements from 2002 (Fenech et al. 2008), 2005 (Argo 2006) and these new 2009–2010 data from 5 GHz MERLIN monitoring sessions. We have found that, in most of the sample, flux densities of SNRs and H ii regions in M82 stay relatively constant, in agreement with previous analysis (e.g. Kronberg & Sramek 1992; Wills, Pedlar & Muxlow 1998; Kronberg et al. 2000). Aside from SN2008iz and the well-known variable source 41.95+57.5, two sources show signs of changes in flux density in the short and medium term. These source are among the most compact SNR in M82, possibly showing that flux density variations are due to changes in the circumstellar and ISM in which the shocks travel. They could thus be transitioning from supernovae to SNRs, in analogy with recent results from Batejat et al. (2011) in Arp 220. In addition, the short-, medium- and long-term Gaussian distributions of flux density variation show an offset from zero. This is consistent with a constant or slight decrease in flux densities of the ensemble sources at all epochs, although within one sigma of the measurements.
MERLIN/e-MERLIN is a national facility operated by The University of Manchester on behalf of the Science and Technology Facilities Council (STFC).
REFERENCES
APPENDIX A FLUX DENSITY MEASUREMENTS
Normalized flux density (as described in Section 3.2) for the 2002, 2005 and 2009–2010, MERLIN/e-MERLIN monitoring sessions of M82. Peak and integrated flux densities are given in mJy/beam and mJy, respectively. Spectral index information was retrieved from McDonald et al. (2002). When unavailable, standard values of α = −0.7 for SNR and α = 0.0 for H ii regions were assumed. The 2010 6 GHz e-MERLIN data were converted to 5 GHz using the relation Sν ∝ να.
| Number | Name | 2009 combined | 2009-05-01 | 2009-05-26 | 2009-07-28 | ||||
|---|---|---|---|---|---|---|---|---|---|
| Speak | Sint | Speak | Sint | Speak | Sint | Speak | Sint | ||
| 1 | 39.10+57.3 | 0.54 | 4.50 ± 0.65 | 0.43 | 3.89 ± 1.20 | 0.71 | 2.72 ± 2.97 | 0.54 | 3.29 ± 0.75 |
| 2 | 39.28+54.1 | 0.23 | 0.23 ± 0.05 | 0.30 | 0.39 ± 0.09 | 0.43 | 0.27 ± 0.21 | 0.26 | 0.44 ± 0.05 |
| 3 | 39.40+56.2 | 0.23 | 1.13 ± 0.29 | 0.24 | 1.29 ± 0.53 | 0.47 | 1.01 ± 1.31 | 0.21 | 1.18 ± 0.33 |
| 4 | 39.64+53.3 | 0.16 | 0.32 ± 0.09 | 0.10 | 0.12 ± 0.17 | 0.10 | 0.13 ± 0.10 | ||
| 5 | 39.67+55.5 | 0.36 | 1.22 ± 0.22 | 0.29 | 1.16 ± 0.40 | 0.39 | 0.66 ± 0.99 | 0.39 | 1.34 ± 0.25 |
| 6 | 39.77+56.9 | 0.16 | 0.36 ± 0.10 | 0.22 | 0.25 ± 0.18 | 0.18 | 0.36 ± 0.11 | ||
| 7 | 40.32+55.2 | 0.28 | 1.35 ± 0.27 | 0.23 | 0.99 ± 0.51 | 0.39 | 1.03 ± 1.06 | 0.24 | 0.95 ± 0.32 |
| 8 | 40.61+56.3 | 0.19 | 1.27 ± 0.33 | 0.24 | 1.34 ± 0.61 | 0.29 | 0.57 ± 1.62 | 0.21 | 0.90 ± 0.38 |
| 9 | 40.68+55.1 | 0.53 | 7.19 ± 0.90 | 0.49 | 5.96 ± 1.67 | 0.70 | 4.85 ± 4.10 | 0.70 | 5.86 ± 1.04 |
| 10 | 40.94+58.8 | 0.26 | 0.73 ± 0.17 | 0.20 | 0.60 ± 0.32 | 0.20 | 0.48 ± 0.19 | ||
| 11 | 41.18+56.2 | 0.24 | 1.76 ± 0.44 | 0.26 | 1.43 ± 0.81 | 0.31 | 0.66 ± 1.23 | 0.27 | 1.52 ± 0.50 |
| 12 | 41.30+59.6 | 0.64 | 2.54 ± 0.29 | 0.57 | 1.89 ± 0.54 | 0.57 | 2.25 ± 1.32 | 0.53 | 1.69 ± 0.34 |
| 13 | 41.64+57.9 | 0.23 | 1.02 ± 0.22 | 0.23 | 1.24 ± 0.41 | 0.42 | 0.87 ± 1.02 | 0.26 | 1.22 ± 0.26 |
| 14 | 41.95+57.5 | 12.52 | 14.17 ± 0.19 | 10.80 | 12.63 ± 0.35 | 12.71 | 14.41 ± 0.87 | 10.95 | 12.34 ± 0.22 |
| 15 | 42.08+58.4 | 0.16 | 0.34 ± 0.09 | 0.34 | 0.48 ± 0.17 | 0.33 | 0.48 ± 0.43 | 0.16 | 0.24 ± 0.11 |
| 16 | 42.20+59.1 | 0.34 | 0.99 ± 0.19 | 0.36 | 0.50 ± 0.35 | 0.41 | 0.53 ± 0.87 | 0.21 | 0.35 ± 0.22 |
| 17 | 42.43+59.5 | 0.17 | 0.38 ± 0.15 | 0.31 | 0.50 ± 0.29 | 0.15 | 0.40 ± 0.18 | ||
| 18 | 42.48+58.4 | 0.32 | 1.37 ± 0.37 | 0.26 | 1.48 ± 0.69 | 0.37 | 0.87 ± 1.69 | 0.22 | 1.25 ± 0.43 |
| 19 | 42.61+60.7 | 0.20 | 0.67 ± 0.16 | 0.19 | 0.58 ± 0.30 | 0.56 | 0.64 ± 0.74 | 0.20 | 0.52 ± 0.19 |
| 20 | 42.67+55.6 | 0.21 | 0.81 ± 0.19 | 0.17 | 0.67 ± 0.35 | 0.25 | 0.76 ± 0.22 | ||
| 21 | 42.67+56.3 | 0.25 | 0.63 ± 0.13 | 0.22 | 0.57 ± 0.24 | 0.44 | 0.83 ± 0.58 | 0.25 | 0.61 ± 0.15 |
| 22 | 42.69+58.2 | 0.15 | 0.21 ± 0.06 | 0.13 | 0.13 ± 0.11 | 0.06 | 0.06 ± 0.07 | ||
| 23 | 42.80+61.2 | 0.25 | 0.55 ± 0.11 | 0.26 | 0.52 ± 0.20 | 0.20 | 0.46 ± 0.12 | ||
| 24 | 42.81+59.6 | 33.18 | 33.57 ± 0.17 | 30.99 | 32.48 ± 0.33 | 40.87 | 40.23 ± 0.80 | 27.24 | 28.34 ± 0.20 |
| 25 | 43.18+58.2 | 1.30 | 4.79 ± 0.33 | 0.91 | 4.29 ± 0.61 | 1.07 | 4.40 ± 1.50 | 1.28 | 3.77 ± 0.38 |
| 26 | 43.31+59.2 | 6.93 | 12.52 ± 0.22 | 5.99 | 10.85 ± 0.41 | 5.34 | 9.41 ± 2.97 | 5.77 | 10.52 ± 0.26 |
| 27 | 43.40+62.6 | 0.19 | 0.61 ± 0.16 | 0.19 | 0.69 ± 0.29 | 0.38 | 0.60 ± 0.71 | 0.19 | 0.48 ± 0.18 |
| 28 | 43.72+62.6 | 0.26 | 0.42 ± 0.09 | 0.25 | 0.25 ± 0.16 | 0.22 | 0.34 ± 0.39 | 0.16 | 0.19 ± 0.10 |
| 29 | 43.78+59.3 | 0.84 | 0.90 ± 0.09 | 0.62 | 0.81 ± 0.16 | 0.49 | 0.85 ± 0.39 | 0.59 | 0.64 ± 0.10 |
| 30 | 43.82+62.8 | 0.16 | 0.33 ± 0.09 | 0.15 | 0.17 ± 0.16 | 0.12 | 0.26 ± 0.10 | ||
| 31 | 44.01+59.6 | 13.73 | 25.88 ± 0.25 | 11.12 | 21.50 ± 0.46 | 13.52 | 24.84 ± 1.14 | 11.79 | 22.65 ± 0.29 |
| 32 | 44.08+63.1 | 0.13 | 0.15 ± 0.06 | 0.10 | 0.14 ± 0.11 | 0.10 | 0.13 ± 0.07 | ||
| 33 | 44.28+59.3 | 0.36 | 1.72 ± 0.32 | 0.48 | 1.60 ± 0.59 | 0.42 | 1.88 ± 1.45 | 0.36 | 1.16 ± 0.37 |
| 34 | 44.28+61.1 | 0.18 | 0.40 ± 0.11 | 0.21 | 0.40 ± 0.20 | 0.17 | 0.23 ± 0.12 | ||
| 35 | 44.34+57.8 | 0.22 | 0.98 ± 0.23 | 0.32 | 1.27 ± 0.42 | 0.49 | 0.76 ± 1.03 | 0.21 | 1.03 ± 0.26 |
| 36 | 44.40+61.8 | 0.26 | 1.19 ± 0.25 | 0.28 | 0.88 ± 0.46 | 0.52 | 1.00 ± 1.12 | 0.19 | 0.84 ± 0.28 |
| 37 | 44.51+58.2 | 0.26 | 2.38 ± 0.54 | 0.31 | 1.57 ± 1.00 | 0.40 | 0.69 ± 2.46 | 0.26 | 1.51 ± 0.62 |
| 38 | 44.89+61.2 | 0.32 | 1.16 ± 0.21 | 0.26 | 0.69 ± 0.39 | 0.42 | 0.80 ± 0.95 | 0.35 | 0.90 ± 0.24 |
| 39 | 44.93+64.0 | 0.20 | 0.39 ± 0.10 | 0.25 | 0.29 ± 0.18 | 0.22 | 0.38 ± 0.12 | ||
| 40 | 45.17+61.2 | 3.27 | 8.72 ± 0.44 | 2.46 | 7.05 ± 0.81 | 2.78 | 8.12 ± 2.00 | 2.91 | 6.81 ± 0.51 |
| 41 | 45.24+65.2 | 0.23 | 1.15 ± 0.26 | 0.30 | 0.98 ± 0.49 | 0.82 | 1.63 ± 1.19 | 0.30 | 0.83 ± 0.30 |
| 42 | 45.39+60.3 | 0.18 | 1.00 ± 0.26 | 0.19 | 0.82 ± 0.49 | 0.37 | 0.66 ± 1.19 | 0.15 | 0.58 ± 0.30 |
| 43 | 45.42+67.4 | 0.30 | 2.56 ± 0.55 | 0.30 | 1.60 ± 1.02 | 0.41 | 2.25 ± 2.53 | 0.29 | 1.22 ± 0.64 |
| 44 | 45.52+64.7 | 0.09 | 0.12 ± 0.05 | 0.11 | 0.13 ± 0.06 | ||||
| 45 | 45.62+67.0 | 0.26 | 1.54 ± 0.37 | 0.27 | 1.41 ± 0.68 | 0.51 | 1.04 ± 1.68 | 0.17 | 1.17 ± 0.42 |
| 46 | 45.75+65.3 | 0.21 | 2.24 ± 0.54 | 0.25 | 1.91 ± 1.01 | 0.55 | 2.30 ± 2.48 | 0.25 | 1.94 ± 0.62 |
| 47 | 45.79+64.0 | 0.22 | 0.49 ± 0.11 | 0.21 | 0.31 ± 0.21 | 0.21 | 0.41 ± 0.13 | ||
| 48 | 45.89+63.8 | 0.61 | 1.60 ± 0.20 | 0.48 | 1.23 ± 0.38 | 0.48 | 0.80 ± 0.93 | 0.50 | 1.19 ± 0.24 |
| 49 | 46.17+67.6 | 0.25 | 2.35 ± 0.57 | 0.29 | 1.65 ± 1.05 | 0.60 | 1.54 ± 2.59 | 0.29 | 1.07 ± 0.66 |
| 50 | 46.34+66.2 | 0.19 | 0.67 ± 0.17 | 0.28 | 0.67 ± 0.32 | 0.18 | 0.67 ± 0.19 | ||
| 51 | 46.52+63.9 | 0.44 | 2.68 ± 0.47 | 0.42 | 1.96 ± 0.88 | 0.43 | 1.87 ± 2.17 | 0.42 | 1.51 ± 0.55 |
| 52 | 46.70+67.1 | 0.23 | 2.29 ± 0.54 | 0.27 | 1.29 ± 0.99 | 0.71 | 1.32 ± 2.25 | 0.23 | 0.64 ± 0.62 |
– continued
| Number | 2009-08-19 | 2009-09-12 | 2009-09-25 | 2010-04-06 | ||||
|---|---|---|---|---|---|---|---|---|
| Speak | Sint | Speak | Sint | Speak | Sint | Speak | Sint | |
| 1 | 0.52 | 4.25 ± 1.80 | 0.63 | 4.23 ± 1.38 | 0.54 | 3.77 ± 1.20 | 0.45 | 3.71 ± 1.98 |
| 2 | 0.34 | 0.39 ± 0.13 | 0.21 | 0.36 ± 0.10 | 0.19 | 0.28 ± 0.09 | 0.21 | 0.22 ± 0.14 |
| 3 | 0.24 | 1.21 ± 0.80 | 0.18 | 1.09 ± 0.61 | 0.23 | 0.62 ± 0.53 | 0.39 | 0.54 ± 0.33 |
| 4 | 0.27 | 0.33 ± 0.25 | 0.21 | 0.23 ± 0.20 | 0.11 | 0.14 ± 0.17 | 0.22 | 0.27 ± 0.28 |
| 5 | 0.32 | 1.16 ± 0.60 | 0.34 | 1.15 ± 0.46 | 0.42 | 1.23 ± 0.40 | 0.33 | 0.62 0.49 |
| 6 | 0.27 | 0.35 ± 0.27 | 0.21 | 0.30 ± 0.21 | 0.23 | 0.36 ± 0.18 | 0.40 | 0.48 ± 0.29 |
| 7 | 0.34 | 0.76 ± 0.76 | 0.46 | 0.96 ± 0.58 | 0.29 | 0.91 ± 0.51 | 0.36 | 1.02 ± 0.83 |
| 8 | 0.35 | 1.13 ± 0.91 | 0.22 | 0.76 ± 0.70 | 0.34 | 0.82 ± 0.61 | 0.32 | 0.66 ± 0.34 |
| 9 | 0.80 | 5.86 ± 2.49 | 0.67 | 6.18 ± 1.91 | 0.76 | 4.90 ± 1.67 | 0.56 | 6.02 ± 2.73 |
| 10 | 0.33 | 0.75 ± 0.47 | 0.27 | 0.59 ± 0.36 | 0.31 | 0.57 ± 0.32 | ||
| 11 | 0.36 | 1.78 ± 1.20 | 0.35 | 2.10 ± 0.93 | 0.22 | 1.12 ± 0.81 | 0.35 | 0.85 ± 1.33 |
| 12 | 0.51 | 1.58 ± 0.80 | 0.79 | 2.18 ± 0.62 | 0.43 | 1.66 ± 0.54 | 0.32 | 0.83 ± 0.37 |
| 13 | 0.37 | 1.70 ± 0.62 | 0.29 | 1.33 ± 0.48 | 0.31 | 0.70 ± 0.41 | 0.42 | 0.70 ± 0.68 |
| 14 | 11.46 | 12.85 ± 0.53 | 10.44 | 11.75 ± 0.41 | 11.24 | 12.63 ± 0.35 | 10.98 | 12.99 ± 0.58 |
| 15 | 0.25 | 0.30 ± 0.26 | 0.18 | 0.26 ± 0.20 | 0.17 | 0.18 ± 0.17 | 0.26 | 0.32 ± 0.29 |
| 16 | 0.45 | 0.57 ± 0.53 | 0.49 | 0.65 ± 0.41 | 0.20 | 0.63 ± 0.35 | 0.29 | 0.61 ± 0.58 |
| 17 | 0.28 | 0.60 ± 0.43 | 0.27 | 0.60 ± 0.33 | 0.25 | 0.47 ± 0.29 | ||
| 18 | 0.38 | 1.91 ± 1.03 | 0.42 | 1.67 ± 0.79 | 0.30 | 1.43 ± 0.69 | 0.44 | 1.33 ± 1.13 |
| 19 | 0.34 | 0.89 ± 0.45 | 0.29 | 0.81 ± 0.34 | 0.16 | 0.48 ± 0.30 | 0.36 | 0.40 ± 0.49 |
| 20 | 0.44 | 0.93 ± 0.52 | 0.24 | 0.83 ± 0.40 | 0.31 | 0.48 ± 0.35 | ||
| 21 | 0.23 | 0.54 ± 0.36 | 0.33 | 0.62 ± 0.27 | 0.52 | 0.70 ± 0.39 | ||
| 22 | 0.15 | 0.16 ± 0.16 | 0.18 | 0.19 ± 0.12 | 0.12 | 0.16 ± 0.11 | ||
| 23 | 0.26 | 0.91 ± 0.30 | 0.47 | 0.81 ± 0.23 | 0.18 | 0.38 ± 0.20 | 0.33 | 0.47 ± 0.32 |
| 24 | 28.52 | 28.91 ± 0.49 | 24.52 | 25.38 ± 0.37 | 26.40 | 26.98 ± 0.33 | 19.56 | 21.60 ± 0.53 |
| 25 | 1.21 | 4.31 ± 0.91 | 1.02 | 3.98 ± 0.70 | 0.89 | 3.60 ± 0.61 | 0.81 | 2.70 ± 1.00 |
| 26 | 5.76 | 10.14 ± 0.61 | 6.01 | 10.93 ± 0.47 | 5.95 | 10.53 ± 0.41 | 5.83 | 10.27 ± 0.68 |
| 27 | 0.24 | 0.80 ± 0.44 | 0.21 | 0.67 ± 0.33 | 0.24 | 0.53 ± 0.29 | 0.37 | 0.69 ± 0.47 |
| 28 | 0.36 | 0.38 ± 0.24 | 0.15 | 0.24 ± 0.18 | 0.22 | 0.23 ± 0.16 | 0.22 | 0.29 ± 0.26 |
| 29 | 0.59 | 0.58 ± 0.24 | 0.53 | 0.50 ± 0.18 | 0.80 | 0.72 ± 0.16 | 0.56 | 0.60 ± 0.26 |
| 30 | 0.35 | 0.54 ± 0.25 | 0.24 | 0.35 ± 0.19 | 0.20 | 0.25 ± 0.16 | ||
| 31 | 12.01 | 22.52 ± 0.69 | 11.58 | 21.90 ± 0.53 | 12.50 | 23.48 ± 0.46 | 11.95 | 24.16 ± 0.76 |
| 32 | 0.09 | 0.11 ± 0.11 | ||||||
| 33 | 0.50 | 1.54 ± 0.88 | 0.39 | 1.25 ± 0.68 | 0.56 | 1.69 ± 0.59 | 0.28 | 1.03 ± 0.97 |
| 34 | ||||||||
| 35 | 0.35 | 1.37 ± 0.63 | 0.36 | 1.24 ± 0.48 | 0.21 | 0.48 ± 0.56 | 0.37 | 1.01 ± 0.69 |
| 36 | 0.25 | 0.93 ± 0.68 | 0.27 | 0.75 ± 0.52 | 0.25 | 0.79 ± 0.46 | 0.29 | 0.96 ± 0.75 |
| 37 | 0.38 | 1.35 ± 1.49 | 0.32 | 1.86 ± 1.14 | 0.35 | 1.04 ± 1.00 | 0.41 | 0.63 ± 1.64 |
| 38 | 0.43 | 0.67 ± 0.58 | 0.39 | 0.81 ± 0.44 | 0.27 | 0.81 ± 0.39 | 0.48 | 1.02 ± 0.63 |
| 39 | 0.23 | 0.24 ± 0.27 | 0.42 | 0.46 ± 0.21 | 0.19 | 0.22 ± 0.30 | ||
| 40 | 3.08 | 7.09 ± 1.21 | 2.72 | 6.39 ± 0.94 | 2.95 | 7.64 ± 0.81 | 2.40 | 6.32 ± 1.33 |
| 41 | 0.46 | 1.57 ± 0.72 | 0.36 | 1.23 ± 0.55 | 0.27 | 1.00 ± 0.49 | 0.37 | 0.71 ± 0.80 |
| 42 | 0.38 | 0.99 ± 0.72 | 0.31 | 0.82 ± 0.55 | 0.36 | 0.77 ± 0.49 | 0.36 | 0.99 ± 0.28 |
| 43 | 0.50 | 1.04 ± 1.53 | 0.33 | 1.74 ± 1.18 | 0.35 | 1.47 ± 1.02 | 0.48 | 1.57 ± 1.68 |
| 44 | ||||||||
| 45 | 0.43 | 2.09 ± 1.02 | 0.29 | 1.42 ± 0.78 | 0.23 | 0.94 ± 0.68 | 0.23 | 0.54 ± 1.12 |
| 46 | 0.51 | 3.07 ± 1.50 | 0.33 | 2.80 ± 1.16 | 0.35 | 2.09 ± 1.01 | 0.35 | 1.80 ± 1.65 |
| 47 | 0.37 | 0.58 ± 0.31 | 0.26 | 0.57 ± 0.24 | 0.28 | 0.59 ± 0.21 | 0.25 | 0.35 ± 0.34 |
| 48 | 0.41 | 0.96 ± 0.57 | 0.55 | 1.20 ± 0.43 | 0.41 | 0.98 ± 0.38 | 0.31 | 1.07 ± 0.62 |
| 49 | 0.33 | 1.89 ± 1.57 | 0.34 | 0.67 ± 1.21 | 0.27 | 0.81 ± 1.05 | 0.47 | 1.68 ± 1.72 |
| 50 | 0.38 | 1.16 ± 0.47 | 0.21 | 0.56 ± 0.36 | 0.21 | 0.39 ± 0.32 | ||
| 51 | 0.61 | 2.05 ± 1.32 | 0.37 | 1.96 ± 1.01 | 0.44 | 2.41 ± 0.88 | 0.47 | 1.44 ± 1.44 |
| 52 | 0.36 | 1.86 ± 1.48 | 0.34 | 2.25 ± 1.14 | 0.36 | 1.34 ± 0.99 | 0.35 | 0.48 ± 1.63 |
– continued
| Number | 2010-12-17 | 2002 | 2005 | α | |
|---|---|---|---|---|---|
| Speak | Sint | Sint | Sint | ||
| 1 | 0.52 | 4.22 ± 0.91 | 3.85 ± 0.31 | 3.00 ± 0.77 | −0.53 |
| 2 | 0.21 | 0.41 ± 0.11 | 0.51 ± 0.07 | 0.24 ± 0.17 | 1.64 |
| 3 | 0.25 | 0.63 ± 0.43 | 0.89 ± 0.22 | 0.49 ± 0.16 | −1.04 |
| 4 | 0.20 | 0.27 ± 0.17 | 0.11 ± 0.02 | 0.13 ± 0.05 | −0.71 |
| 5 | 0.40 | 0.80 ± 0.18 | 0.87 ± 0.08 | 0.57 ± 0.17 | 1.03 |
| 6 | 0.18 | 0.23 ± 0.07 | 0.19 ± 0.02 | ||
| 7 | 0.27 | 0.60 ± 0.16 | 0.27 ± 0.04 | −0.23 | |
| 8 | 0.25 | 0.78 ± 0.33 | 0.44 ± 0.07 | −0.72 | |
| 9 | 0.56 | 6.06 ± 0.99 | 6.60 ± 0.28 | 5.34 ± 1.06 | −0.54 |
| 10 | 0.19 | 0.48 ± 0.16 | 0.29 ± 0.07 | 0.44 | |
| 11 | 0.20 | 1.27 ± 0.41 | 0.90 ± 0.14 | 0.85 ± 0.28 | 0.87 |
| 12 | 0.48 | 2.04 ± 0.38 | 2.49 ± 0.28 | 1.88 ± 0.32 | −0.47 |
| 13 | 0.17 | 0.67 ± 0.19 | 0.26 ± 0.05 | 0.45 ± 0.13 | 1.32 |
| 14 | 10.04 | 12.34 ± 0.32 | 18.45 ± 0.23 | 17.25 ± 0.30 | −0.80 |
| 15 | 0.21 | 0.40 ± 0.14 | 0.35 ± 0.06 | 1.32 | |
| 16 | 0.25 | 0.89 ± 0.29 | 1.12 ± 0.16 | 1.16 | |
| 17 | 0.19 ± 0.02 | ||||
| 18 | 0.17 | 0.89 ± 0.32 | 1.05 ± 0.19 | >1.20 | |
| 19 | 0.24 | 0.37 ± 0.17 | 0.32 ± 0.07 | −0.70 | |
| 20 | 0.30 | 0.57 ± 0.30 | 1.20 ± 0.29 | −1.30 | |
| 21 | 0.91 ± 0.17 | ||||
| 22 | 0.16 | 0.33 ± 0.18 | 0.59 ± 0.14 | 0.48 ± 0.12 | 1.04 |
| 23 | 0.22 | 0.44 ± 0.12 | 0.59 ± 0.08 | 0.26 ± 0.10 | −0.63 |
| 24 | 13.35 | 14.77 ± 0.27 | |||
| 25 | 0.80 | 2.98 ± 0.33 | 4.23 ± 0.34 | 2.93 ± 0.37 | −0.44 |
| 26 | 5.69 | 10.12 ± 0.29 | 10.32 ± 0.11 | 10.81 ± 0.33 | −0.65 |
| 27 | 0.18 | 0.23 ± 0.08 | 0.49 ± 0.15 | −0.70 | |
| 28 | 0.18 | 0.20 ± 0.09 | 0.30 ± 0.04 | 0.18 ± 0.07 | |
| 29 | 0.86 | 1.02 ± 0.10 | −0.70 | ||
| 30 | 0.21 | 0.34 ± 0.14 | 0.35 ± 0.05 | 0.64 ± 0.17 | −0.70 |
| 31 | 12.40 | 23.74 ± 0.39 | 21.04 ± 0.22 | 25.25 ± 0.42 | −0.38 |
| 32 | 0.43 ± 0.07 | ||||
| 33 | 0.20 | 0.96 ± 0.33 | 1.78 ± 0.17 | 0.31 ± 0.12 | −0.72 |
| 34 | 0.14 | 0.19 ± 0.08 | |||
| 35 | 0.28 | 0.80 ± 0.29 | 1.03 ± 0.16 | −0.70 | |
| 36 | 0.26 | 0.97 ± 0.31 | 0.68 ± 0.17 | 0.07 | |
| 37 | 0.23 | 0.99 ± 0.35 | 1.57 ± 0.19 | 0.53 ± 0.18 | −0.15 |
| 38 | 0.23 | 0.81 ± 0.28 | 0.93 ± 0.10 | −0.45 | |
| 39 | 0.23 ± 0.05 | 1.10 | |||
| 40 | 2.61 | 6.49 ± 0.50 | 6.83 ± 0.21 | 6.53 ± 0.45 | −0.52 |
| 41 | 0.33 | 0.66 ± 0.16 | 1.15 ± 0.17 | −1.02 | |
| 42 | 0.48 ± 0.13 | ||||
| 43 | 0.37 | 1.30 ± 0.40 | 1.25 ± 0.15 | 0.82 ± 0.26 | −0.83 |
| 44 | 0.14 | 0.20 ± 0.11 | 0.19 ± 0.04 | ||
| 45 | 0.19 | 0.73 ± 0.30 | 0.92 ± 0.16 | ||
| 46 | 0.26 | 1.64 ± 0.57 | 1.65 ± 0.33 | −0.70 | |
| 47 | 0.18 | 0.29 ± 0.12 | 0.21 ± 0.03 | −0.55 | |
| 48 | 0.42 | 0.87 ± 0.25 | 1.34 ± 0.08 | 0.64 ± 0.19 | −0.38 |
| 49 | 0.18 | 1.08 ± 0.41 | 1.24 ± 0.28 | 0.66 | |
| 50 | 0.22 ± 0.03 | ||||
| 51 | 0.32 | 1.67 ± 0.48 | 0.70 ± 0.20 | −0.20 | |
| 52 | 0.24 | 1.18 ± 0.46 | 1.56 ± 0.41 | 0.77 ± 0.24 | −0.80 |
