


Abstract
We present spatially resolved kinematics of the interstellar Na i D λλ5890, 5896 doublet absorption and 12CO (1 → 0) emission across the inner ∼2 × 1 kpc of the disc of M82. These data were obtained with the DensePak integral field unit on the WIYN (Wisconsin, Indiana, Yale and NOAO) telescope and the Caltech Owens Valley Radio Observatory millimetre array. By measuring the Na i and CO (and Hα kinematics from a previous study) at the same spatial resolution, and employing the same line fitting method, we have been able to make meaningful comparisons between the ionized, neutral and molecular gas phases. We detect a component of the Na i line throughout the inner disc with velocities that are forbidden by the known galactic rotation. We interpret this as originating in counter-rotating or perhaps inflowing material. In the southern plume, we find clear evidence of entrained CO gas with kinematics consistent with that of Hα. On the northern side, the CO kinematics appear to trace more static clouds in the inner halo that could be pre-existing or tidal in origin. We find no evidence that Na i absorption is kinematically associated with the outflow. We conclude that a combination of lack of velocity resolution and confusion due to the high inclination of the system is acting to prevent detection. Thus, in the search for neutral outflows from galaxies, the signature high velocity components may easily be missed in observations at low spectral resolution and/or sensitivity, and particularly so in highly inclined systems.
1 INTRODUCTION
M82 is the archetype nearby (3.6 Mpc, |$1\,\text{arcsec} = 17.5$| pc; Freedman et al. 1994) starburst galaxy (O'Connell & Mangano 1978; O'Connell et al. 1995). The current (∼10 Myr) starburst activity is concentrated in an ∼500 pc (∼30 arcsec) region centred on the nucleus. From Hubble Space Telescope (HST) imaging, the starburst is known to consist of many young massive star clusters (O'Connell et al. 1995; McCrady, Gilbert & Graham 2003), and it is the energy from these clusters that drives the famous Hα- and X-ray-bright, kpc-scale, superwind (Shopbell & Bland-Hawthorn 1998; Ohyama et al. 2002; Stevens, Read & Bravo-Guerrero 2003; Strickland & Heckman 2007; Westmoquette et al. 2007b, 2009a).
The bipolar outflow (Shopbell & Bland-Hawthorn 1998; Engelbracht et al. 2006; Mutchler et al. 2007) can be observed easily due to the galaxy's almost edge-on inclination (i ∼ 80°; Lynds & Sandage 1963; McKeith et al. 1995). McKeith et al. (1995, hereafter McK95) presented deep optical and near-infrared long-slit observations of emission and absorption lines along M82’s minor axis and found clear line splitting in their emission lines. This was interpreted as originating from the front and back walls of a cone-shaped structure, inclined such that the southern cone is directed towards the observer.
Radial velocities along the major axis have been studied many times in the optical/near-IR (e.g. Burbidge, Burbidge & Rubin 1964; McKeith et al. 1993; Sofue et al. 1998; Shopbell & Bland-Hawthorn 1998; Castles, McKeith & Greve 1991; Westmoquette et al. 2007b), IR (e.g. Larkin et al. 1994; Achtermann & Lacy 1995) and radio (e.g. Wills et al. 2000; Walter, Weiß & Scoville 2002; Rodriguez-Rico et al. 2004). Overall, these studies have found an inner ∼5 arcsec region with a steep velocity gradient and an outer region >±25 arcsec of constant (or slowly increasing) velocities. These gradients are centred on the systemic velocity of the galaxy, vsys = +200 km s−1.
The steep inner region is attributed to the x2 orbits of an ∼1 kpc long stellar bar, known from near-infrared and H i studies (Larkin et al. 1994; Achtermann & Lacy 1995; Wills et al. 2000). The interaction between the outer x1 and inner x2 orbit families has resulted in the build-up of a torus of molecular and ionized gas and dust at a radius of ∼250 pc (Achtermann & Lacy 1995; Weiß et al. 2001).
Westmoquette et al. (2009a, hereafter Paper I) examined the ionized gaseous and stellar dynamics of M82’s disc and inner wind via DensePak and Gemini/GMOS spatially resolved optical integral field unit (IFU) spectroscopy. We found clear evidence for the wind emanating from the entire starburst zone. We also found a broad component in the ionized emission lines that we interpreted as tracing turbulent mixing interfaces between the hot wind and photoionized gas phases. In Westmoquette et al. (2009b, hereafter Paper II), we examined the nebular properties in more detail, and described the discovery of a distinct channel >100 pc in length identified within the inner wind, traced by the ionized gas and characterized by its dynamics and density morphology.
The central starburst is believed to be fuelled by the large amount of cold molecular gas present in the disc (Mtot = 2.3 × 10⁸ M⊙; Weiß et al. 2001; García-Burillo et al. 2002). Walter et al. (2002), however, discovered significant amounts of molecular material (1.3 × 10⁹ M⊙) outside the central 1 kpc disc. Some streamers were found to be well correlated with optical absorption and H i features, implying that the molecular gas has been partly disrupted by the tidal interaction with M81. However, CO line splitting was also detected for the first time, implying that there is also significant molecular material entrained in the wind (∼3 × 10⁸ M⊙).
While much work has been done on the distribution of ionized gas in nearby starburst outflows (e.g. Marlowe et al. 1995; Martin 1998; Westmoquette et al. 2007a; Sharp & Bland-Hawthorn 2010; Westmoquette et al. 2011), in comparison very little has been done (particularly on spatially extended scales) on the neutral phases in these same nearby examples. Cool neutral gas is most easily probed through absorption lines. Due to their advantage in (1) being able to be seen against a bright continuum source (continuum surface brightnesses are typically much larger than that of the emission lines) and (2) mitigating the ambiguity in the radial flow direction, absorption lines have been used extensively to probe outflows in more distant sources (z ≳ 1, e.g. Shapley et al. 2003; Fox et al. 2007; Weiner et al. 2009; Rubin et al. 2010; Kornei et al. 2012; Martin et al. 2012).
Since, in these samples, the absorption kinematics are often treated as direct probes of the outflow speed, it is important to examine whether this really is the case in nearby systems. Schwartz & Martin (2004) presented Keck/HIRES Na i D absorption line observations of a sample of nearby dwarf starbursts and found that the kinematics of Na i D and Hα were generally very different. Rupke, Veilleux & Sanders (2005) compared the ionized emission and Na i D absorption line profiles for a sample of 17 starburst-dominated Ultra Luminous Infrared Galaxies (ULIRGs), and also found a complicated situation. Only in some cases blueshifted wings were detected in both phases. In half of those, the ionized gas had a higher maximum velocity, while in the other half they were equivalent. The situation, therefore, is far from clear.
In this paper, we aim to determine the kinematics of both the cool neutral and molecular media across the entire inner ∼2 × 1 kpc of M82’s disc using spatially resolved (3 arcsec resolution) observations of the interstellar Na i D λλ5890, 5896 doublet absorption and the 12CO (1 → 0) (2.6 mm, 115 GHz) emission line. By comparing these results to those of the ionized gas (made at the same resolution; Westmoquette et al. 2009a), we can make a direct and meaningful comparison between the three gas phases.
2 OBSERVATIONS
2.1 DensePak observations
On 2001 April 14, we observed four fields covering the stellar disc of M82 with the DensePak instrument (Barden, Sawyer & Honeycutt 1998), a small fibre-fed integral field array attached to the Nasmyth focus of the WIYN (Wisconsin, Indiana, Yale and NOAO) 3.5-m telescope. It has 91 circular fibres, each with a diameter of 300 μm or 3 arcsec on the sky; the fibre-to-fibre spacing is 400 μm making the overall dimensions of the array |$30\text{ arcsec}\times 45$| arcsec. The format of the array, including the gaps between the fibres, is represented in the maps presented below. DensePak's fibre bundle is reformatted into a pseudoslit to feed the WIYN bench-mounted echelle spectrograph.
The spectrograph was set up to give a dispersion of 0.46 Å pix−1 over the wavelength range of 5820–6755 Å. This allowed us access to a number of optical nebular lines (analysed in Paper I and Paper II) and the Na i D λλ5890,5896 doublet which we examine here. Na i D absorption originates from warm neutral gas in the interstellar medium and stellar atmospheres. We refer the reader to Paper I for further details regarding the IFU position coordinates, exposure times and data reduction methodology. Fig. 1 shows the position of the DensePak fields overlaid on an HST/ACS F814W (I-band) image. The instrumental resolution is 44.7 ± 3.1 km s−1 (Paper I).

HST/ACS F814W (I-band) image with the DensePak IFU footprints overlaid, together with arrows labelling certain well-known regions within the central starburst. The 2.2 μm nucleus (Lester et al. 1990, |$\alpha = 09^{\rm h}\,51^{\rm m}\,43{.\!\!\!\!\!\!^{\mathrm s}}4$|, δ = 69°55′ 00′′, B1950) is marked by a white cross. Contours show the integrated 12CO flux (Walter et al. 2002).
2.1.1 Decomposing the Na i line profiles
Na i absorption is detected in every fibre of the DensePak fields, and the high S/N and spectral resolution of our data have allowed us to quantify the line profile shapes to a high degree of accuracy. Because of the coincidence of telluric Na i emission (mostly from the street lights in Tucson) with the interstellar absorption lines, accurately measuring the absorption profile shape is highly dependent on the sky subtraction quality. Thus, to avoid the introduction of artefacts that are always associated with attempting to remove the sky lines, we here perform our analysis on the original spectra (i.e. with no sky subtraction).
For each spectrum we simultaneously modelled the Na i doublet absorption together with the He i λ5876 nebular emission line and the three telluric emission lines at 5888.05, 5889.95 and 5895.92 Å (the latter two being the Na i doublet) using the idl χ2 fitting package pan (Peak Analysis Dimeo 2005; Westmoquette et al. 2007a). Milky Way absorption was filled in by the telluric emission so was not included in the fit. In order to limit the number of free parameters as much as possible, we fitted the Na i doublet (both emission and absorption) as a single model consisting of two Gaussians with wavelength separations equal to the lab-measured difference, and equal line widths specified to be greater than the instrumental resolution. The fluxes of the two lines of the doublet were left unconstrained. We fitted each of the Na i absorption profiles with a single- and double-component initial guess. Multi-component fits were run several times with different initial guess configurations (widths and wavelengths) in order to account for the varied profile shapes, and the one with the lowest χ2 fit statistic was kept. However, we note that the χ2 minimization routine employed by pan is very robust with respect to the initial guess parameters.
To determine whether the Na i doublet needed one or two components to fit its shape, we used a combination of visual inspection, the χ2 and the fit residuals. In the majority of spectra, two components were needed. In these cases, we named the stronger absorption component C1 and the weaker C2. Fig. 2 shows some example spectra in the Na i region, showing simultaneous fits to the He i λ5876 emission line, the Na i absorption lines and the three telluric emission lines (note that He i is not detected in two of these examples). These spectra were extracted from the spaxels labelled with the corresponding letters in Fig. 4 (see below).
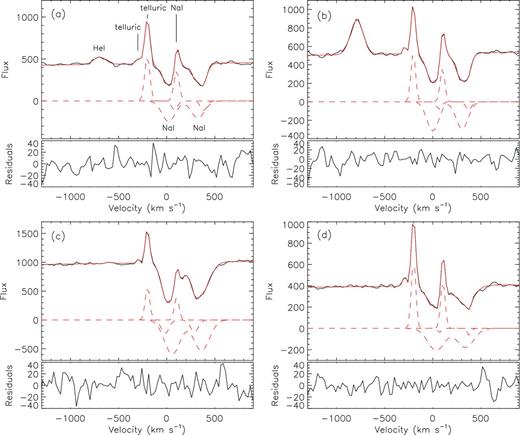
Examples of fits to the Na i lines, including the He i 5876 Å and telluric emission lines as labelled in panel (a). Zero velocity corresponds to the rest wavelength of Na i λ5890. The y-axes are in arbitrary but relative flux units. The location from which these spectra originate in the IFU fields is indicated with the corresponding letters in the left-hand panel of Fig. 4.
Due to the constraints imposed on the telluric line fits, formal errors on the Na i fit results are not straightforward to calculate. We estimate that uncertainties in the radial velocities of the Na i results are 5–10 km s−1 for high S/N spaxels and remain ≤30 km s−1 for the majority of spectra. Full width at half-maximum (FWHM) errors range between ≤10 km s−1 for high S/N spectra and remain below ∼50 km s−1 for most spaxels. Uncertainties in the absorption-equivalent widths (Weq) of the components range from 0.1 Å for the strongest absorption to ∼0.5 Å for the weaker components. In some cases, these high uncertainties arise from the λ5896 (redder) Na i emission line falling on the red wing of the bluer (λ5890) absorption line.
Fig. 3 shows the Na iWeq maps for components C1 and C2. The Weq of Na i C2 is a factor of approximately three to five times smaller than C1. As a check on the physicality of our final results, we measured the ratio of the equivalent widths of the two Na i lines for each fitted component, since a ratio of Weq, 5890/Weq, 5896 = 1 represents the optically thick limit, whereas a ratio of 2 represents the optically thin limit. As expected, in almost every case the ratio is ∼1. However, in spectra where the uncertainties in the Weq of the weaker component are high, this ratio is often <1 (Fig. 2d is an obvious case). While this reflects the inherent difficulty of fitting such a complex and blended set of lines, we believe that, although the equivalent widths of the weaker components may be uncertain, the kinematics are accurate.
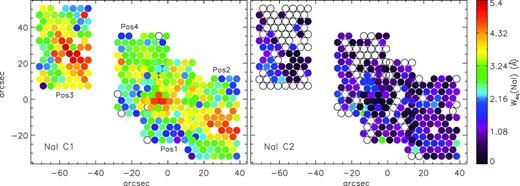
Map of the equivalent width of Na i absorption for the two line components. The (0,0) origin is centred on the 2.2 μm nucleus.
2.2 OVRO CO map
Observations of M82 in 12CO (1 → 0) (2.6 mm, 115 GHz) were made with the Caltech Owens Valley Radio Observatory (OVRO) millimetre array over a a |$2.5\text{ arcmin}$| × |$3.\,5\text{ arcmin}$| field at a spatial resolution of |$3.6\text{ arcsec}$|, and were presented in Walter et al. (2002). More details on the setup and data reduction methodology are given in that paper. Here we use these data to compare to our ionized and neutral phase measurements.
First we cropped the cube to the region coincident with our DensePak data, then binned it spatially to a resolution of 3 arcsec to match that of the DensePak fibres. We then masked any spaxels with integrated fluxes below 15 Jy beam−1 (equating to a line S/N below ∼3) in order to ensure that every spatial element in our final cube contained a significant CO line detection.
In order to produce measurements for the CO data that are comparable to our ionized and neutral gas measurements, we fitted the CO line using pan in much the same way as we have done for the ionized emission lines (Paper I) and Na i absorption lines. We found that we required two Gaussian emission components in the majority of spaxels in the cropped and masked cube. Whenever two components were needed, we assigned the component whose radial velocity was closest to vsys (+200 km s−1) to C1 and the higher velocity component to C2. We found that this resulted in a more coherent velocity map than if we had followed the convention adopted for Na i (where we assigned the stronger component to C1 and the weaker to C2 regardless of velocity).1 Fig. 6 shows the resulting line centroid velocity maps for the two components, and Fig. 5 shows some example fitted CO line profiles extracted from selected regions labelled with the corresponding letters in Fig. 6.
3 RESULTS
3.1 Radial velocity maps
In Fig. 4, we present the Na i line centroid radial velocity maps for the two identified line components. Recall that for Na i, the fainter component of any two-component fits was assigned to C2. The signature of galactic rotation is seen in the C1 component, with approaching velocities in the west and receding velocities in the east, although the velocity gradient is much shallower than that of the stellar or ionized emission lines (Paper I, and see below). In Paper I, we confirmed a 12° offset to the position angle of the ionized gas rotation axis, compared to both the stellar rotation axis and photometric major axis, that had first been seen by Rodriguez-Rico et al. (2004). The line connecting the maxima and minima of this offset rotation axis is shown with a dashed line in the Na i C1 map (Fig. 4). Despite the shallower velocity gradient compared to that of the ionized gas (see below), it is clear that the rotation seen in Na i C1 is consistent with same offset axis (blueshifted velocities in the west peak below the major axis, whereas redshifted velocities in the east peak above the major axis).
![Na i line centroid velocity maps for components C1 and C2 relative to vsys (= +200 km s−1). The (0,0) origin is centred on the nucleus. Letters in the left-hand panel show the location of spectra shown in Fig. 2. The galaxy major and minor axes are marked with solid black lines. Pseudoslits along these axes, together with two additional pseudoslits (labelled slits 2 and 4) offset by 15 arcsec to the south of the major axis and 20 arcsec to the east of the minor axis (drawn in red), were used to make the position–velocity diagrams of Figs 7 and 8. The pseudoslit widths are indicated by the dotted lines. The dashed line in the left-hand panel represents the PA of the gaseous (Hα, [S iii], P9) rotation axis (offset by ∼12°; determined from the emission line maps in Paper I).](https://oup.silverchair-cdn.com/oup/backfile/Content_public/Journal/mnras/428/2/10.1093/mnras/sts154/2/m_sts154fig4.jpeg?Expires=1750087465&Signature=vp6Zs2qvxY9WaxqfW-KT0vV76oxdL0e0G95rI9ATKG9rx7eabR2AAl7zxNT3uzuH6Ypq3CEJJ7DJxFGkyAykzQ7CriSUqaj3qE~tj9g37d~zVSz8BHORlB0Znqmx9svPjQ39bjVVsVmSP0UBC5hbIsiaPpbPb7Ak29KC-1v3gBZSJB383-s1CJUqx09WOjqvCePC5aeGW3H13-SwA83arycRWfxtB2uPa3V3rd~tfqPKJK0pbtxooNWxq~7L3qRI-1smdmNezdvJxZFhK3qvFZvbx~09ERi6vBkEJ4xNNNGBnxnsxUAujDxza8XXPoR5t7-IBuw32xDUmCUJ2IdYzw__&Key-Pair-Id=APKAIE5G5CRDK6RD3PGA)
Na i line centroid velocity maps for components C1 and C2 relative to vsys (= +200 km s−1). The (0,0) origin is centred on the nucleus. Letters in the left-hand panel show the location of spectra shown in Fig. 2. The galaxy major and minor axes are marked with solid black lines. Pseudoslits along these axes, together with two additional pseudoslits (labelled slits 2 and 4) offset by 15 arcsec to the south of the major axis and 20 arcsec to the east of the minor axis (drawn in red), were used to make the position–velocity diagrams of Figs 7 and 8. The pseudoslit widths are indicated by the dotted lines. The dashed line in the left-hand panel represents the PA of the gaseous (Hα, [S iii], P9) rotation axis (offset by ∼12°; determined from the emission line maps in Paper I).
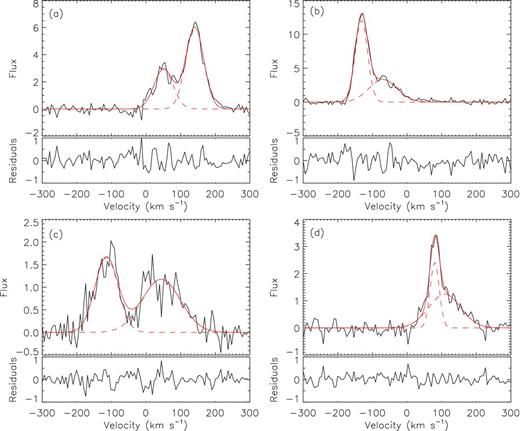
Examples of fits to the CO line from selected locations as indicated with the corresponding letters in the left-hand panel of Fig. 6. The fluxes are in units of Jy beam−1.
The dynamics of the fainter Na i component (C2) are much more complex. To the west of the minor axis, C2 is redshifted compared to C1 (e.g. Fig. 2b). To the east, some spaxels contain a blueshifted C2 component whereas others show a redshifted one. In position 3, a handful of spaxels along the midplane exhibit a blueshifted C2 component (e.g. Fig. 2 c), although most C2 velocities in the south of the position are redshifted with respect to C1 (e.g. Fig. 2 d).
In Fig. 6, we present the 12CO emission line radial velocity maps. Two line components are detected throughout the central 80 |$\text{arcsec }\times$| 60 arcsec (1400 pc × 1050 pc). Unlike the flux-based component assignments we used for Na i, for CO we assigned the components based on velocity, with the one closest to vsys as C1 and the higher velocity component as C2. The rotation of the central CO torus (Shen & Lo 1995) can clearly be seen, with the redshifted receding side in C1 and the approaching blueshifted side in C2.
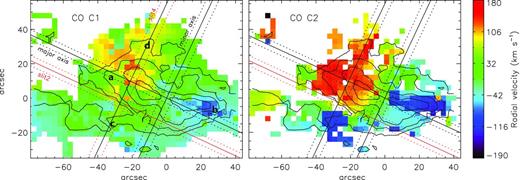
12CO (1 → 0) centroid velocity maps for components C1 and C2, relative to vsys = 200 km s−1. The overlaid contours represent the integrated CO flux, and clearly show the two molecular lobes. Letters in the left-hand panel show the location from which the spectra shown in Fig. 5 were extracted. The same pseudoslits as shown in Fig. 4 (used for the p–v diagrams of Figs. 7 and 8) are shown.
The differences between the Na i and 12CO maps and the Hα maps from Paper I clearly indicate that the gas kinematics within this central starburst region are very complex. To investigate these results in more detail, we define a number of pseudoslits along and parallel to the major and minor axes from which we extract the line component velocities. These are discussed in the following sections.
3.2 Major axis position–velocity graph
Position–velocity plots extracted from two 7|$\text{arcsec}$|-wide pseudoslits positioned along the galaxy major axis and offset 15 arcsec to the south are shown in Fig. 7 (left-hand and right-hand panels, respectively). The location of these pseudoslits are shown in both Figs 4 and 6. We plot our new Na i and 12CO measurements together with the Hα measurements from Paper I, the [N ii]λ6583 velocities from Castles et al. (1991) and the [S iii], P10 and Ca ii velocities from McKeith et al. (1993, + symbols).
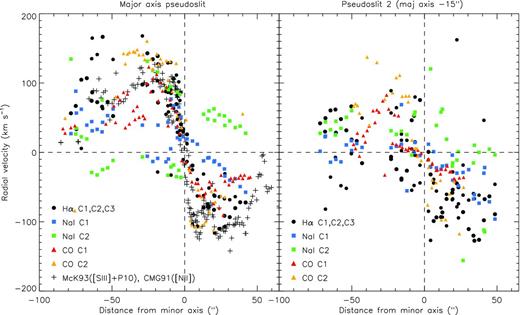
Major axis position–velocity diagrams for Na i, CO and Hα (Paper I), extracted from the corresponding 7 arcsec wide pseudoslits shown in Figs 4 and 6. Velocities are shown with respect to vsys. The optical and near-IR ionized gas velocities measured along the major axis by Castles et al. (1991) and McKeith et al. (1993) are plotted with + symbols.
A close inspection of these two plots reveals a number of points of interest. Between −20 and +5 arcsec on the major axis (the eastern side of the inner x2 bar region) the Hα, Na i and CO measurements are mostly in good agreement, indicating that we are seeing molecular, neutral and ionized gas all following the bar orbits. However, on the western side (mostly between −10 and +40 arcsec), the Na i C1 follows a distinctly different, shallower velocity gradient. In pseudoslit 2, the Na i C1 gradient is flatter still and between −20 and +20 arcsec is followed by the CO. These shallower gradients imply that this neutral and molecular gas must be located nearer to us along the line of sight (i.e. at larger galactocentric radii) where the radial component of the orbital velocity vector is less.
Between −65 and 0 arcsec in the major axis pseudoslit, we find a consistent area of blueshifted (10–60 km s−1) Na i C2 points, and between +10 and +45 arcsec we find a cluster of redshifted Na i C2 points (30–70 km s−1). Example line profiles and fits for these regions are shown in Fig. 2b and c. In the velocity map (Fig. 4), we see that these redshifted C2 velocities are present throughout the western section of the disc (as mentioned above). Together, these points appear to trace a component of neutral material with very different kinematics to the rest of the gas.
3.2.1 Minor axis position–velocity graph
Fig. 8 shows position–velocity plots from two 7arcsec-wide pseudoslits oriented along the minor axis (left-hand panel) and a parallel line 20 arcsec to the east (pseudoslit 4; right-hand panel). The location of these pseudoslits is also indicated in Figs 4 and 6. As for the major axis plots, we include our new Na i and CO measurements together with the Hα emission line velocities from Paper I. We also include the Hα, [N ii]λ6583 and [S iii]λ9532 data from McKeith et al. (1995).
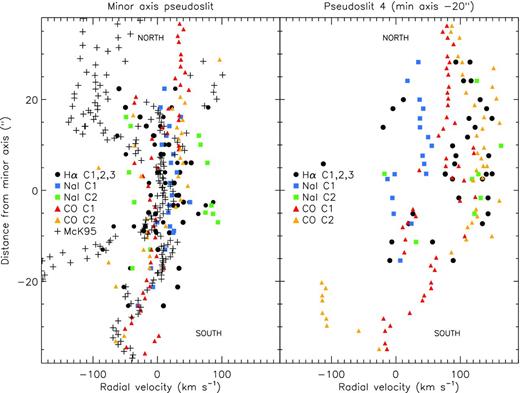
Minor axis position–velocity diagrams for Na i, CO and Hα (Paper I), extracted from the corresponding 7 arcsec wide pseudoslits shown in Figs 4 and 6. Velocities are shown with respect to vsys. The optical and near-IR ionized gas velocities measured along the major axis by McKeith et al. (1995) are plotted with + symbols.
From +10 arcsec northwards along the minor axis (left-hand panel), the CO stays at a very constant velocity and is considerably redshifted from the ionized gas. In the north of pseudoslit 4, CO C2 traces Hα, whereas CO C1 stays at a very constant velocity (from ∼15–35 arcsec), remaining on the blue side of C2. The position of these points in the two p–v diagrams suggests that they may be tracing the far-side of the northern wind outflow cone, although their very constant velocities are suggestive of more quiescent gas clouds in the outer disc. We discuss this below in Section 4.2.
From −10 arcsec southwards, the Na i and CO velocities agree well with ionized gas velocities, suggesting that here both the Na i and CO trace the far side of the wind cone. At the equivalent offsets in pseudoslit 4, the CO emission is composed of two distinct velocity components. The redshifted component (C2, becoming C1) accelerates at an approximately constant rate from −5 out to >−35 arcsec (>600 pc), consistent with a number of Hα points between 0 and −15 arcsec. Between 0 and −15 arcsec, the bluer component (C1; here blueshifted from C2 by ≳100 km s−1) traces the kinematics of Na i C1 and Hα, and then jumps to approximately −110 km s−1 from −20 arcsec southwards (and assigned to C2). These split line components are consistent with tracing the wind outflow, as was noted by Walter et al. (2002).
4 DISCUSSION
M82 is a complex system that is not easily interpreted. The kinematics of any one gas phase in the central starburst region are complex down to the resolution limit of any observation made to date. Understanding the relationship between the different gas phases is therefore challenging, particularly when the sensitivity, spatial resolution and/or observation method of the data are not matched. In this study, we have attempted to compare the neutral Na i absorption and 12CO emission kinematics to the ionized (Hα) emission line kinematics at the same spatial resolution, employing the same line fitting method for each. In the following, we discuss some of the salient points from our results in context with the literature and the M82 system as a whole.
4.1 Neutral gas in the wind
We find no evidence of Na i absorption that is kinematically associated with warm (∼104 K) ionized gas outflow from our DensePak data. This could be due to (1) there being no cool neutral gas in the outflow, (2) a lack of velocity resolution meaning that weak blueshifted outflow components are unresolved or washed out in our spectra or (3) that the high inclination of the system means that the absorption line is confused with multiple line-of-sight components. Regarding point (1), it would be rather surprising that the outflow does not entrain any cool neutral material, given that we know there is ionized and molecular gas in the flow.
We already know from Na i radial velocity measurements along sight-lines towards star clusters (Konstantopoulos et al. 2009) that the Na i is decoupled from the stars, clusters and ionized gas. Although the clusters measured by Konstantopoulos et al. (2009) were not strictly along the major axis, the overall Na i radial velocity distribution within the central ∼2 kpc of the disc is consistent with a flat gradient, suggesting that the absorbing neutral material is located further out in the disc (where the radial component of its orbital velocity is smaller). The high wind speeds in M82 should rapidly fragment clouds, so perhaps it would not be a surprise for Na i absorption from entrained clouds to be patchy (this effect can be seen in simulations such as Cooper et al. 2009). Having said that, strong signatures of entrained Na i absorbers are found in many other starburst systems (e.g. Rupke et al. 2005; Chen et al. 2010).
On points (2) and (3), the velocity resolution of our DensePak spectra (∼45 km s−1) certainly does prevent us from being able to see the finer details of the Na i absorption profile, known from previous higher resolution observations (Smith & Gallagher 2001; Schwartz & Martin 2004). In Fig. 9, we compare the Na i line profile of M82-F, a super-star cluster to the west of the nucleus (see Fig. 1), from our DensePak data to that measured by Smith & Gallagher (2001) using the Utrecht Echelle Spectrograph (UES) on the William Herschel Telescope (WHT) at a resolution of 8 km s−1 (R = 45 000). Whereas five sharp absorption components can be identified in the UES spectrum, at the lower resolution of our DensePak spectrum only two (broader) components can be resolved.
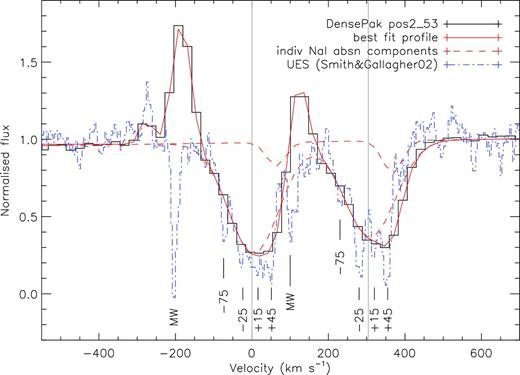
A comparison of the Na i profile of M82-F, a super star cluster to the west of the nuclear regions (see Fig. 1), from our DensePak data (resolution 45 km s−1) and that measured by Smith & Gallagher (2001) from their WHT/UES spectrum (resolution 8 km s−1). The velocity scale is relative to the blue component of the Na i doublet, and is shown relative to the systemic velocity of M82. The best-fitting profile and the individual components identified in the DensePak spectrum are shown in red. The vertical lines indicate the wavelengths corresponding to the systemic velocity for each of the Na i lines. Absorption components identified in the UES spectrum by Smith & Gallagher (2001) are marked, together with absorption from the Milky Way. In the DensePak spectrum, this Galactic absorption is filled by the telluric emission.
Schwartz & Martin (2004) observed a ∼4 |$\text{arcsec }\times$||$1.5\text{ arcsec}$| sight-line towards the centre of M82 clump A (centred at coordinates |$09^{\rm h}\,55^{\rm m}\,52{.\!\!\!\!\!\!^{\mathrm s}}\,6$|, +69° 40′ 47| ${.\!\!\!\!\!\!^{\prime\prime}}$| 0, J2000; private communication) at 11 km s−1 (R = 30 000) resolution with Keck/HIRES. They also found an extremely complex absorption system best fitted with five separate components, the two strongest being blueshifted by −90 and −35 km s−1.
These higher resolution observations show that the neutral gas kinematics in M82 are extremely difficult to disentangle, and great care must be taken. The presence of these narrow blueshifted components (in both the UES and HIRES spectra) suggests that there is indeed neutral gas entrained in the outflow which cannot be seen at the resolution of our DensePak spectra. Furthermore, the presence of so many components over a large range in velocities belies the fact that, due to the high inclination of the galaxy, these absorption profiles are likely to be quite confused by material along the line of sight, particularly in these central regions of the disc.
4.2 Molecular gas in the wind
By reanalysing the CO data from Walter et al. (2002) and performing a detailed multi-component line fit, we find conclusively that molecular CO is entrained in the wind in these inner regions. In the southern wind plume (Fig. 8), we identify two components of CO emission, equivalent to the line splitting seen in Walter et al. (2002). The strongest component traces the redshifted (far-side) wall of the outflow cone; however, a weaker component (C2) also traces the blueshifted side in some places (as seen in the pseudoslit 4 p–v plot). These results represent clear evidence that the inner wind contains entrained molecular gas that is coupled kinematically to the ionized gas phase.
A region of blueshifted (−100 km s−1) CO emission can be seen in the south of the C2 velocity map (Fig. 6) at coordinates around (−30, −10), or in the pseudoslit 4 p–v plot (Fig. 8, right-hand panel) between offsets of −20 and −35. By comparing this to the minor axis p–v diagram shown by Walter et al. (2002), we see that this component is equivalent to the faint blueshifted ‘prong’ of the p–v fork on the southern side (their Fig. 4). We therefore associate this component with the wind. Since this ‘prong’ is only seen at low surface brightness, we do not identify it as clearly here since we masked low S/N data in the CO cube (see Section 2.2). It is interesting to note that this component is not seen directly along the minor axis, but only to the east.
On the opposite (north) side of the disc, we also find redshifted (30–100 km s−1) CO emission in both C1 and C2 (seen in both minor axis pseudoslits). These velocities are partly consistent with the ionized gas measurements (particularly those from Paper I), although the measurements of McKeith et al. (1995) and Shopbell & Bland-Hawthorn (1998) that extend further out indicate a much faster acceleration in the cone back-wall than is seen in CO (see fig. 4 of Walter et al. 2002). The fact that these CO components stay at very constant velocity with increasing disc height implies that they may trace more static clouds in the inner halo that could be pre-existing or tidal in origin.
Wills, Pedlar & Muxlow (2002) found evidence for four expanding shells in the inner disc of M82 from their high-resolution Very Large Array (VLA) A-configuration H i data. The CO velocity splitting seen on the eastern side of the disc (see the major axis p–v plots in Fig. 7) is consistent with that measured by Wills et al. (2002) for their shells 1 and 2. On the western side, however, CO counterparts to the H i shells 3 and 4 cannot be identified, although CO line splitting consistent with the known molecular superbubble ∼10 arcsec west of the nucleus (Weiß et al. 1999) is clear.
4.3 A counter-rotating Na i component
Throughout the central regions (IFU positions 1, 2, 4), we see what appears to be a counter-rotating neutral gas component in the form of Na i C2 (see profile+fit examples; Figs 2b and c). These Na i C2 velocities can clearly be seen in the major axis p–v diagram (Fig. 7), and do not match anything seen in the ionized or molecular gas. Furthermore, the extent of these apparently counter-rotating Na i C2 velocities do not correspond to anything seen in optical imaging, including the dust lanes seen in the HSTI-band image (Fig. 1), or the CO map.
M82-F is located at a projected distance of ∼30 arcsec to the west of the nucleus and slightly above mid plane, just within the region where we find these unusual Na i velocities. As mentioned above, Smith & Gallagher (2001) observed M82-F at high spectral resolution (R = 45 000; 8 km s−1) and found a number of discrete narrow components in the Na i profile. Two of them are redshifted at 15 and 45 km s−1, and these correspond well with the C2 component identified in our DensePak spectra, which in this location is redshifted by 20–40 km s−1 (as shown in Fig. 9).
Wills et al. (2000) presented |$1.4\text{ arcsec}\times 1.2\text{ arcsec}$| spatial resolution VLA observations of M82 with a velocity resolution of ∼10 km s−1. For the few SN remnants (SNRs) that were clearly separated from other nearby sources, they were able to detect multiple H i absorption components and measure their velocities. SNR 39.10 + 57.3, located ∼ 5 arcsec west of the nucleus, 5 arcsec below the mid-plane, was found to have four velocity components at +60, +35, −10 and −120 km s−1 (relative to systemic). These redshifted components are consistent with our Na i C2 velocities. The H i profiles against the another three SNR discussed in their paper located ∼25 arcsec to the west of nucleus (41.95 + 57.5), and ∼20 and ∼25 arcsec east of the nucleus (45.17 + 61.2 and 6.70 + 67.1), however, did not exhibit any absorption components outside the allowed values of disc rotation.
What could this counter-rotating component represent? Smith & Gallagher (2001) comment that ‘this gas could be associated with infalling tidal debris or gas outflow’. Although the outflow interpretation is difficult to reconcile with the other known wind tracers, the possibility that this component represents gas inflow is very interesting. Some simulations of galactic-shock accretion of gas in an oval potential, such as a nuclear bar, have produced highly eccentric streaming motions towards the nucleus, some portion of which are counter-rotating (Wada, Sakamoto & Minezaki 1998).
The H i gas filaments in the halo of M82 are found in the velocity range of −70 to 70 km s−1 relative to systemic (Yun, Ho & Lo 1993). Some of the Na i features could, therefore, originate in extraplanar gas. In particular, the anomalous Na i velocities on the western side of M82 could represent an extension of the north-western H i filament across M82 (Yun et al. 1993). As the south-western H i filament appears to join M82 at velocities close to the rotation speed, it is difficult to unambiguously distinguish between absorption from this filament and the outer disc of M82. The possibility remains, however, that the south-western H i filament is feeding gas into M82.
Nevertheless, the edge on inclination and the superposition of disc and bar orbits with complex projection effects make it impossible to be sure from these data whether this counter-rotating component is indeed a sign of gas inflow or not. Higher sensitivity H i imaging at good spatial and velocity resolution of the central few kpc of the disc would be needed to investigate this further.
4.4 Consequences for interpreting Na i outflows versus ionized gas
Gas outflows have been identified in many star-forming galaxies from low to high redshift (Heckman, Armus & Miley 1990; Pettini et al. 2002; Tremonti, Moustakas & Diamond-Stanic 2007; Weiner et al. 2009). Because of observational constraints, it is common to measure a single outflow speed for a galaxy from either an integrated spectrum or a single long-slit pointing. Typically these are derived from measurements of interstellar absorption lines (such as Na i, e.g. Rupke et al. 2005; Chen et al. 2010), but it is also common to use ionized emission lines (e.g. Förster Schreiber et al. 2009). Very few studies discuss the implications of using neutral versus ionized and absorption versus emission lines on determining the presence of galaxy outflows and their velocities.
This study highlights the inherent complexities of the relationship between the ionized and neutral phases, and therefore the assumptions of similarity between these phases and techniques. M82 is one of the nearest and best studied examples of a starburst and superwind system, and one that is often used as a template for more distant objects that cannot be resolved as well. However, spatially resolved Na i and Hα kinematics show that they cannot be used as equivalent tracers of the same gas. In Hα, a double-peaked line profile characteristic of the expanding superwind is clearly detected 10–20 arcsec (few 100 pc) above and below the midplane (McKeith et al. 1995, Paper I). In Na i, however, we find no clear evidence of an equivalent outflow component.
In Fig. 10 we show the summed Na i and Hα-[N ii] profiles over DensePak IFU positions 1, 2 and 4 (i.e. the central ∼1 kpc × 1 kpc of the disc), together with our best-fitting multi-Gaussian fit and the fit residuals. For Na i, only one absorption component can be identified, with a velocity centroid of +23 km s−1 (relative to systemic) and FWHM = 174 km s−1 (mostly reflecting broadening due to rotation). Since no blueshifted component is seen, from this spectrum alone one would conclude that M82 does not host an outflow. In contrast, three line components can be identified in the Hα and [N ii] lines, including two separated narrow components characteristic of outflowing material, and a broad (FWHM = 320 km s−1) underlying component.
![The summed Na i and Hα-[N ii] spectra from DensePak IFU positions 1, 2 and 4 (i.e. the central ∼1 × 1 kpc of the disc), shown together with the best fit to the emission and absorption lines, the individual components to the fit and the residuals. For Na i only one absorption component can be identified with a velocity centroid of +23 km s−1 (relative to systemic) and FWHM = 174 km s−1. In contrast, three components can be identified in the Hα and [N ii] lines.](https://oup.silverchair-cdn.com/oup/backfile/Content_public/Journal/mnras/428/2/10.1093/mnras/sts154/2/m_sts154fig10.jpeg?Expires=1750087465&Signature=ywvv~GSy9J8O6M~OaYOtJW5MCt0RqWwMbIrd7llkfBRbEp9RmMv9VtJoyH-m~FUWmBHlCr5HqxmsY5vbuPLFaCdf0G4Qf~YryVWf51fjwBsdT3QqIcvne6stfGETqNPW8T9xMTutluN8OTxEY-ztwd7md710BJfI-o6a7-haEZRgJ9~ou4ZpTG~Wn5HC~yoX4Z0N3BFGWxqj0LLYrvNKhTzC4HpKX-cUNc14I4ZKy736tV2ft1bDK7ItzuonQBbx1KtU1AY7ZlMrsH1fmUYweoGyUgi0bedKGK30Krh7nrMb2L6PQTOwj1ZMBlSbsRNBES3scv0aW6EMWmORmIQfDg__&Key-Pair-Id=APKAIE5G5CRDK6RD3PGA)
The summed Na i and Hα-[N ii] spectra from DensePak IFU positions 1, 2 and 4 (i.e. the central ∼1 × 1 kpc of the disc), shown together with the best fit to the emission and absorption lines, the individual components to the fit and the residuals. For Na i only one absorption component can be identified with a velocity centroid of +23 km s−1 (relative to systemic) and FWHM = 174 km s−1. In contrast, three components can be identified in the Hα and [N ii] lines.
We have shown that at higher resolution the absorption profile can break up into many narrow components (Section 4.1), and it may be that the summed profile would do the same. However, not all studies looking for absorption line outflows are done at high resolution (for example the DEEP2 spectra used by Weiner et al. 2009 were taken at R = 5000, which is similar to this study, and the LRIS spectra analysed by Kornei et al. 2012 were taken at R ∼ 700). Even then, the lines of sight that can be probed by absorption line studies rely on a bright background source, and this may not correspond with a region in which an outflow can be detected. For example, the high-resolution pencil-beam studies of Smith & Gallagher (2001) and Schwartz & Martin (2004) did not cover regions in M82 where the Hα outflow is most obvious (McKeith et al. 1995; Shopbell & Bland-Hawthorn 1998; Westmoquette et al. 2009a).
In conclusion, the high spectral resolution (R ≳ 10 000) observations are clearly preferable in order to search for signatures of a wind, so that the Na i line profile is sampled at a sufficient level. We have shown that high velocity components are hard to find in highly inclined systems, and may easily be missed in observations of similar systems at a similar spectral resolution to ours.
5 SUMMARY
We present spatially resolved (3 arcsec resolution) observations of the interstellar Na i D λλ5890,5896 doublet absorption obtained with the DensePak IFU on the WIYN telescope, and compare them to the 12CO (1 → 0) (2.6 mm, 115 GHz) emission obtained with the OVRO millimetre array, across the inner ∼2 × 1 kpc of the disc of M82. By measuring the Na i, CO and ionized gas (Hα) kinematics (from Paper I) at the same spatial resolution, and employing the same line-fitting method, we have been able to make meaningful comparisons between the three gas phases. Our main conclusions are the following.
In general, the Na i kinematics do not match those of Hα or CO, although in the eastern part of the inner bar region the three tracers do match one another closely, indicating that we are seeing molecular, neutral and ionized gas all following the bar orbits. The Na i rotation curve is flatter both along the mid-plane and at disc heights of a few hundred pc. The likely explanation of this is that the Na i line, being in absorption, probes gas that is located in front of the continuum source (the starburst), and is therefore biased towards material further out along the line of sight and thus with a lower radial component of its orbital velocity. Despite this, however, the rotation seen in Na i C1 is consistent with the same offset axis as that found from the radio and optical recombination lines (Rodriguez-Rico et al. 2004, Paper I) of PA = 12°.
We detect a component of the Na i line with velocities that are forbidden by the known orbital rotation of the galactic disc. Hints of this component were seen in high spectral resolution Na i observations of the cluster M82-F (Smith & Gallagher 2001) and the H i absorption profile towards an SNR to the south-west of the nucleus (Wills et al. 2000). We interpret this as a material that is counter-rotating or perhaps inflowing towards the starburst. These velocities have not been found in any observation at any other gas temperature phase, suggesting that this material must be cold. To investigate this further, higher sensitivity H i observations of the inner few kpc of the disc are needed.
We find a clear indication of entrained CO gas in the outflow with kinematics consistent with that of the Hα-emitting wind, thereby confirming the result of Walter et al. (2002). It is possible that this CO line splitting follows the expanding shells detected in H i absorption measurements by Wills et al. (2002), and certainly traces the known molecular superbubble identified by Weiß et al. (1999). The existence of such structures might be expected to result from the massive and highly clumped young complexes in the M82 starburst zone. The breakout of hot gas from such high pressure bubbles would offer a likely source for the hot superwind.
However, we find no evidence that Na i absorption is kinematically associated with the outflow. Since it would be rather surprising that the outflow does not entrain any neutral material (given that we know there is ionized and molecular gas in the flow), we conclude that a combination of (1) lack of velocity resolution and (2) confusion of the absorption profile due to the high inclination of the system is acting to prevent the detection. This view is supported by the observation of narrow, blueshifted Na i components at higher resolution (R > 30 000) along select sight-lines towards M82 (Smith & Gallagher 2001; Schwartz & Martin 2004).
Thus, in search for neutral outflows from galaxies, high velocity components may easily be missed in observations at similar spectral resolution to ours. This is particularly true for highly inclined systems. Often, the inclination of a galaxy is not known (especially for more distant systems) so a non-detection of high velocity Na i absorption can simply be an inclination effect. Higher spectral resolution (R ≳ 10 000) is always preferable when studying ISM absorption lines, and particularly so in these situations.
The research leading to these results has received funding from the European Community's Seventh Framework Programme (/FP7/2007-2013/) under grant agreement No. 229517. JSG gratefully acknowledges partial support of this research by grant NSF AST0708967 to the University of Wisconsin-Madison.
In Na i, the stronger component dominates the absorption profile and is the one that mainly follows galactic rotation (see Section 3.1), whereas in CO the relative strength of the two components varies much more, meaning that a velocity-based assignment is more appropriate.
