


Abstract
We investigate the formation and evolution of circumstellar discs in turbulent cloud cores until several 104 yr after protostar formation using smoothed particle hydrodynamics (SPH) calculations. The formation and evolution process of circumstellar disc in turbulent cloud cores differs substantially from that in rigidly rotating cloud cores. In turbulent cloud cores, a filamentary structure appears before the protostar formation and the protostar forms in the filament. If the turbulence is initially sufficiently strong, the remaining filament twists around the protostar and directly becomes a rotation-supported disc. Upon formation, the disc orientation is generally misaligned with the angular momentum of its host cloud core and it dynamically varies during the main accretion phase, even though the turbulence is weak. This is because the angular momentum of the entire cloud core is mainly determined by the large-scale velocity field whose wavelength is comparable to the cloud scale, whereas the angular momentum of the disc is determined by the local velocity field where the protostar forms and these two velocity fields do not correlate with each other. In the case of disc evolution in a binary or multiple stars, the discs are misaligned with each other at least during the main accretion phase, because there is no correlation between the velocity fields around the position where each protostar forms. In addition, each disc is also misaligned with the binary orbital plane. Such misalignment can explain the recent observations of misaligned discs and misaligned protostellar outflows.
1 INTRODUCTION
Many circumstellar discs are observed in star-forming regions. They are by-products of star formation and are directly connected to planet formation. Thus, it is important for understanding star and planet formation to clarify the formation and evolution of circumstellar discs. Recent studies on protostar and disc formation in a collapsing molecular cloud core suggest that the circumstellar disc forms at a very early phase of star formation (Bate 1998; Walch et al. 2009; Inutsuka, Machida & Matsumoto 2010; Machida, Inutsuka & Matsumoto 2010; Bate 2011), and is more massive than the protostar for at least 104 yr after protostar formation (Inutsuka et al. 2010). During this phase, the circumstellar disc is gravitationally unstable and develops non-axisymmetric spiral arms. However, these studies have examined the formation and evolution of the circumstellar disc in the rigidly rotating cloud core.
Molecular clouds, which typically have a scale >0.1 pc, usually display complex internal motions that are observed as a broad emission-line profile. The internal motion in a molecular cloud is believed to be caused by turbulence. Although a detailed generation process of the internal motions is still unclear, observed line profiles in molecular clouds are consistent with Gaussian velocity fields with a Kolmogorov spectrum (Dubinski, Narayan & Phillips 1995; Klessen 2000). Observations also indicate the existence of turbulence even for molecular cloud cores, which typically have a scale of 0.1–0.01 pc. Goodman et al. (1993) showed that the specific angular momentum of a molecular cloud core is roughly proportional to j ∝ R1.6, which is derived from observations of molecular cloud cores with a size of 0.06–0.6 pc. This scaling law is in good agreement with the scaling j ∝ R1.5, which is produced by a turbulence field with velocity power spectrum P(k) ∝ k−4. Note that when the molecular cloud core rotates rigidly, the specific angular momentum should obey the scaling law of j∝R2. Burkert & Bodenheimer (2000) pointed out that random Gaussian velocity fields with power spectra of P(k)∝k−4 can reproduce the observed projected rotational properties of molecular cloud cores.
The evolution of a circumstellar disc during Class 0–I phases may be strongly affected by the velocity field of the molecular cloud core because it is mainly determined by mass accretion from the (turbulent) envelope. Thus, it is important to investigate the disc evolution in turbulent molecular cloud cores for a comprehensive understanding of the evolution of circumstellar discs.
In addition to formation and evolution of the circumstellar disc around a single protostar, cloud turbulence is also expected to affect the formation and evolution of circumstellar discs in binary systems. In a collapsing cloud core, fragmentation may occur, causing a binary system to appear. In a rigidly rotating cloud core, discs in the binary system are aligned with each other by definition and also with the binary orbital plane (see Tsukamoto & Machida 2011). On the other hand, observational evidence indicates misalignment of binary discs. For example, Davis, Mundt & Eisloeffel (1994) observed protostellar jets with different orientations in a binary system. Roccatagliata et al. (2011) recently observed two discs in a protobinary system. In their observation, the primary protostar has an almost face-on disc, whereas the secondary disc is edge-on towards the observer. Thus, the disc orientation around the primary protostar is almost perpendicular to the orientation of the disc around the secondary protostar. With observations of many wide binary systems, Hale (1994) showed that the stellar rotational equatorial plane is often misaligned with the binary orbital plane. These observations indicate that in wide binary systems, the disc plane is frequently misaligned with the binary orbital plane. However, simulations starting from a molecular cloud core with simple systematic rotation cannot explain these observations.
The gravitational collapse of a turbulent molecular cloud core has been studied by several groups. Matsumoto & Hanawa (2011) calculated the gravitational contraction of turbulent cloud cores and showed the morphological evolution of the collapsing cloud core before protostar formation. With long-term calculations (until ∼105 yr after the protostar formation), Goodwin, Whitworth & Ward-Thompson (2004a,b) showed that fragmentation frequently occurs even in a weakly turbulent environment. Recently, Walch et al. (2010) calculated the evolution of turbulent cloud cores and showed that protostar and circumstellar disc formation in turbulent cloud cores is different from that in rigidly rotating cloud cores. They showed that protostars form from a filamentary structure and pointed out that the formation condition for a binary or multiple stellar system rarely depends on the total angular momentum of the host cloud core. Walch, Whitworth & Girichidis (2012) investigated the evolution of low-mass cold cores. They focused on the relationship between the evolution of the core and the maximum wavelength (or minimum wavenumber) of the turbulence and found that the maximum wavelength of the turbulence is a critical parameter for the evolution of cloud cores. In their simulation, the turbulent energy is fixed and the dependence of the disc evolution on the turbulent energy is still unclear.
In this study, we investigate circumstellar disc formation in a turbulent cloud core over >104 yr. We have already reported the disc formation in cloud cores with systematic rotation (or rigid rotation) in Tsukamoto & Machida (2011) in which we calculated the cloud evolution with different classical cloud parameters (e.g. Miyama, Hayashi & Narita 1984) representing the cloud thermal (α) and rotational (β) energies. In the present study, which is complementary to that of Tsukamoto & Machida (2011), we investigate the effects of turbulence strength on the evolution of the protostar and circumstellar disc with one cloud parameter representing thermal (α) energy and one representing turbulent (γturb) energy. We also investigate disc evolution and its orientation in a binary system. This paper is organized as follows. In Section 2, we describe the numerical method and initial conditions. In Section 3, we present the numerical results. Finally, in Section 4, we discuss our results.
2 NUMERICAL METHOD AND INITIAL CONDITIONS
2.1 Numerical method
Our simulations were conducted using the smoothed particle hydrodynamics (SPH) code, which we used in our previous study (Tsukamoto & Machida 2011). The code includes an individual time-step technique and uses the Barnes–Hut tree algorithm to calculate the self-gravity with an opening angle θ = 0.5. We include an artificial viscosity as prescribed by Monaghan (1997) with αv = 1 and also use the Balsara switch (Balsara 1995). Our code was parallelized with Message Passing Interface (MPI) and was verified using several standard test problems.
In addition, to calculate the evolution of the circumstellar disc for ≳ 104 yr, we adopted the sink particle technique described by Bate, Bonnell & Price (1995). We assume that a protostar forms when the particle density exceeds the threshold density, ρsink = 4 × 10⁻⁹ g cm−3. Next, a sink particle with an accretion radius of 1 au is dynamically introduced.
2.2 Initial settings
2.2.1 Model parameters
2.2.2 Turbulence realization
Model parameters.
| Model | α | γturb | R (au) | βeff | ρinit (g cm−3) | Mach numbera | Fragmentation |
|---|---|---|---|---|---|---|---|
| 1 | 0.6 | 0.1 | 5900 | 1.3 × 10⁻² | 6.9 × 10⁻¹⁹ | 0.66 | N |
| 2 | 0.6 | 0.06 | 5900 | 7.9 × 10⁻³ | 6.9 × 10⁻¹⁹ | 0.50 | N |
| 3 | 0.6 | 0.03 | 5900 | 4.1 × 10⁻³ | 6.9 × 10⁻¹⁹ | 0.36 | N |
| 4 | 0.4 | 0.3 | 3933 | 4.1 × 10⁻² | 2.3 × 10⁻¹⁸ | 1.4 | N |
| 5 | 0.4 | 0.1 | 3933 | 1.4 × 10⁻² | 2.3 × 10⁻¹⁸ | 0.80 | N |
| 6 | 0.4 | 0.06 | 3933 | 8.5 × 10⁻³ | 2.3 × 10⁻¹⁸ | 0.63 | N |
| 7 | 0.2 | 0.3 | 1967 | 4.0 × 10⁻² | 1.9 × 10⁻¹⁷ | 2.0 | Y |
| 8 | 0.2 | 0.1 | 1967 | 1.3 × 10⁻² | 1.9 × 10⁻¹⁷ | 1.1 | Y |
| 9 | 0.2 | 0.06 | 1967 | 8.2 × 10⁻³ | 1.9 × 10⁻¹⁷ | 0.87 | Y |
aMach number is the rms of the turbulent velocity in the initial cloud core.
Using the parameters α and γturb, we constructed nine models and calculated the evolution of the circumstellar disc for each model. The model names and parameters are listed in Table 1.
Note that we adopted the turbulent velocity field and the uniform density field as the initial state. Thus, the velocity field and density field of our initial conditions are not self-consistent. We will discuss how this inconsistency would affect our results in Section 4.5.1.
Note also that some models have somewhat unrealistic parameter. Model 7 has large initial Mach number that is much larger than typically observed, and models 8 and 9 are highly gravitationally unstable (α + γturb = 0.26, 0.3). We will discuss the validity of these initial conditions in Section 4.5.2.
3 RESULTS
In this section, we first give an overview of evolution process of circumstellar disc in turbulent core and how it changes in response to the strength of turbulence. We adopt model 4 (α = 0.4 and γturb = 0.3) as a typical model with strong turbulence and model 6 (α = 0.4 and γturb = 0.06) as a typical model with weak turbulence, and investigate them both in detail. It is observed that whether the initial velocity field is supersonic (M > 1) or subsonic (M < 1) is not important for the evolution processes. Next, we investigate the evolution of the disc orientation for all models and, finally, we investigate the formation process of binary or multiple systems in a turbulent cloud core and the evolution process of circumstellar discs in a binary system.
3.1 Overview
3.1.1 Disc evolution in strongly turbulent core
In this subsection, we show how the circumstellar disc evolves in a turbulent cloud core that initially has relatively strong turbulence. As a typical case, we chose model 4 with parameters α = 0.4 and γturb = 0.3 and an initial rms Mach number of 1.4. Fig. 1 shows the time evolution of the surface density around the centre of the cloud core. In the figure, the z-axis is chosen to be parallel to the angular momentum of the entire initial cloud core.
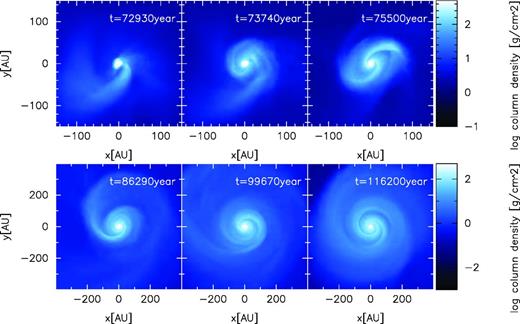
Time sequence of the logarithm of the face-on surface density before and after protostar formation for model 4 (α = 0.4 and γturb = 0.3). The z-axis (i.e. the line-of-sight direction) is set parallel to the angular momentum of the entire initial cloud core. The top-left and top-middle panels show snapshots approximately 2.6 × 10³ and 1.8 × 10³ yr before protostar formation, respectively. The top-right panel shows a snapshot just when the protostar forms. The bottom-left, bottom-middle and bottom-right panels show snapshots 1.1 × 10⁴, 2.1 × 10⁴ and 4.1 × 10⁴ yr after protostar formation, respectively. The elapsed time in the calculation is shown in each panel.
Before protostar formation, the first (adiabatic) core (Larson 1969; Masunaga & Inutsuka 2000) appears. The central region of high-density gas in the top-left and top-middle panels of Fig. 1 corresponds to the first core. These panels show that filamentary structure accompanies the first core, which then coils around the first core and changes directly to a circumstellar disc. The second collapse occurs at t = 75 500 yr (top-right panel). By this epoch, the two spiral arms already develop. Although we cannot recognize the filamentary structure in the top-right panel, a weak large-scale filament remains around the disc at this epoch. In addition, the gas accretion from the filamentary structure on to the disc continues. After protostar formation, this large-scale filament (the structure which resides at ∼200 au) coils around the disc and directly connects to the disc’s spiral arm (bottom-left panel). Finally, as seen in the bottom-right panel of Fig. 1, the filamentary structure accretes on to the disc and disappears.
Previous studies, which assumed the rigidly rotating cloud core with large rotational energy (β of the rigidly rotating core is comparable to βeff of the turbulent core), have shown that the first core has enough angular momentum to develop a bar-mode instability and trailing spiral arms appears. The spiral arms remove the angular momentum from the central region. With the angular momentum transfer, the central density becomes high and the second collapse occurs. Then, the remnant of the first core which increases in size with the spiral arms becomes a circumstellar disc. (Bate 1998, 2011; Machida & Matsumoto 2011). However, the disc formation mechanism seen in Fig. 1 differs from that found in previous studies.
The first core formed in the turbulent cloud core has less angular momentum than that formed in the rigidly rotating cloud core because the gravitational collapse tends to occur at a stagnation point of the velocity field around which the rotational energy of the gas is relatively low. As a result, the first core cannot develop the bar-mode instability even with the strong turbulence. Instead, the filamentary structure, which forms before the first core formation, twists around the first core or protostar and, then, becomes directly a rotationally supported disc.
Fig. 2 shows the radial profiles of the surface density and the radial velocity, for which each value is azimuthally averaged. The origin is set at the position of the protostar (or the position of the gas particle that has maximum density before the second collapse). The velocity is measured in the standard of rest of the protostar. The solid line in the top panel shows the surface density profile ∼1.8 × 10³ yr before the second collapse, which corresponds to the top-middle panel of Fig. 1. At this epoch, the disc surrounding the first core ranges from 10 to 50 au. As described above, the filamentary structure, which formed before protostar formation, changes directly into the disc. The dashed line in the top panel of Fig. 2 is the surface density profile at which the second collapse just begins. The disc radius reaches ∼100 au at this epoch. The dotted line shows the surface density profile at ∼1.1 × 10⁴ yr after the second collapse. At this epoch, as seen in the bottom panel of Fig. 2, a positive radial velocity arises at approximately 200–300 au. This flow is caused by the strong m = 1 mode of the spiral arm which is generated at approximately 100 au. This type of outward flow appears repeatedly and readjust the surface density towards the stable configuration.
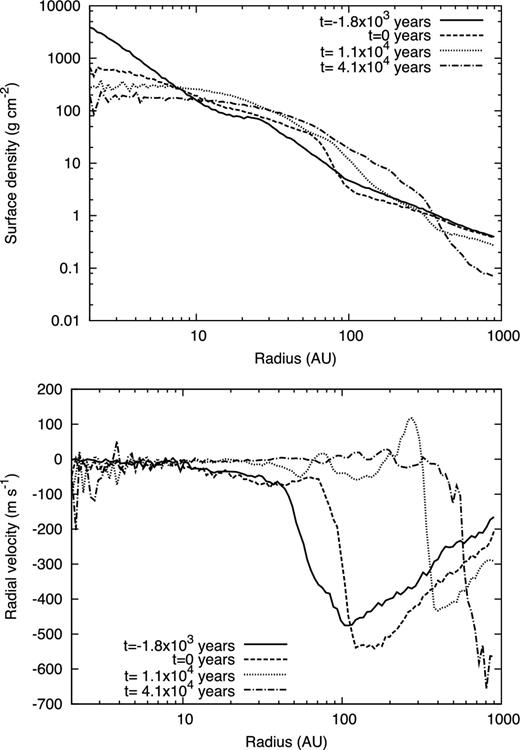
Radial distribution of surface density (top) and radial velocity (bottom) for model 4. Lines corresponds to 1.8 × 10³ yr (solid line) before protostar formation, 0 yr (dashed line), 1.1 × 10⁴ yr (dotted line) and 4.1 × 10⁴ yr (dot–dashed line) after protostar formation.
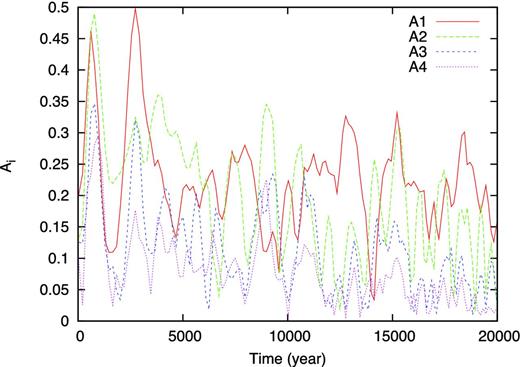
Evolution of Fourier amplitudes of surface density at 100 au against elapsed time after protostar formation for model 4.
Fig. 4 shows the time evolution of an edge-on view of the centre of the cloud core for model 4. The figure indicates that the disc orientation varies during main accretion phase. We discuss the evolution of the disc orientation further in Section 3.2.
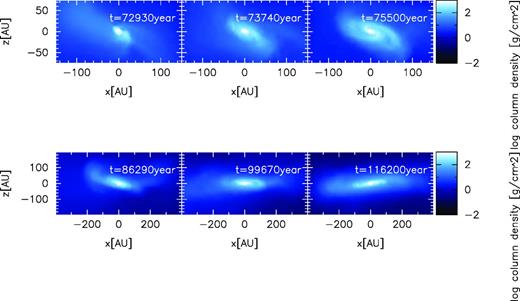
Same as Fig. 1, but edge-on view.
As we showed above, the evolution process of a circumstellar disc in a strongly turbulent core is different from that in a rapidly rotating core in many respects. As we will see below, the evolution process becomes similar to that of a rigidly rotating cloud core as the turbulent energy decreases. However, note that the dynamical change of the disc orientation also occurs even in the weakly turbulent core.
3.1.2 Disc evolution in weakly turbulent core
As a typical case for the formation and evolution of a circumstellar disc in a weakly turbulent cloud core, we chose model 6 that has parameters of α = 0.4 and γturb = 0.06. The initial rms Mach number is 0.63. Compared with model 4 (strong turbulent case), model 6 has the same thermal energy but a smaller turbulent energy.
Fig. 5 shows a face-on view of the time evolution of the centre of the cloud core. Before protostar formation (top-left panel), some filaments appear and form a complicated structure. However, the density amplitude of filaments appearing in this model is much weaker than what appears in the models which initially have strong turbulence. As the mass accretion on to disc proceeds, the circumstellar disc becomes massive and develops the spiral arms (bottom panels). Finally, the radius of the circumstellar disc reaches ≳100 au. The filaments that appear in the early evolution phase (top panels) are attributed to anisotropic gas accretion in a weakly turbulent environment, whereas the spirals that appear in the later evolution phase (bottom panels) develop because of gravitational instability of the disc itself.
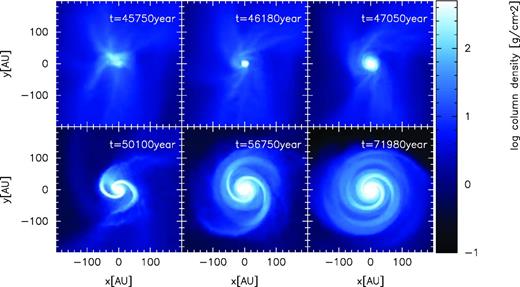
Time sequence of logarithm of face-on surface density before and after protostar formation for model 6 (α = 0.4 and γturb = 0.06). The z-axis is parallel to the angular momentum of the entire initial cloud core. Top-left panel shows a snapshot approximately 4.3 × 10² yr before protostar formation. Top-middle panel shows a snapshot just when the protostar forms. Top-right, bottom-left, bottom-middle and bottom-right panels show snapshots 8.7 × 10², 3.9 × 10³, 1.1 × 10⁴ and 2.6 × 10⁴ yr after protostar formation, respectively. The elapsed time in the calculation is shown in each panel.
Fig. 6 shows the disc evolution when viewed edge-on. The results indicate that the disc orientation varies with time even with the weak turbulence. As we will see in Section 3.2, the dynamical change of the disc orientation generally occurs independent of the strength of the turbulence. The fluctuation of the disc orientation is a significant feature of disc evolution in turbulent cloud cores.
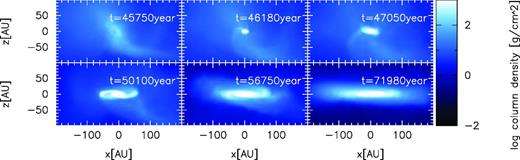
Same as Fig. 5, but edge-on view.
Fig. 7 shows the radial profiles of the surface density (top) and radial velocity (bottom) for model 6; the solid, dashed, dotted and dot–dashed lines correspond to the top-middle, bottom-left, bottom-middle and bottom-right panels in Fig. 5, respectively. The top panel of Fig. 7 shows that the disc gradually increases in size and surface density with time. In addition, the figure shows that a disc-like structure of size ∼10 au already exists before and immediately after protostar formation (solid line). This indicates that the remnant of the first core changes directly into the circumstellar disc. Thus, the formation and evolution processes of the circumstellar disc in weakly turbulent cloud cores are qualitatively the same as those in slowly and rigidly rotating cloud cores seen in previous works (see e.g. Machida et al. 2010; Bate 2011). In the bottom panel of Fig. 7, a positive radial velocity arises in the range of 50–100 au at ∼5.0 × 10³ yr after the second collapse. This outward flow in the disc is due to the m = 2 mode of spiral arms.
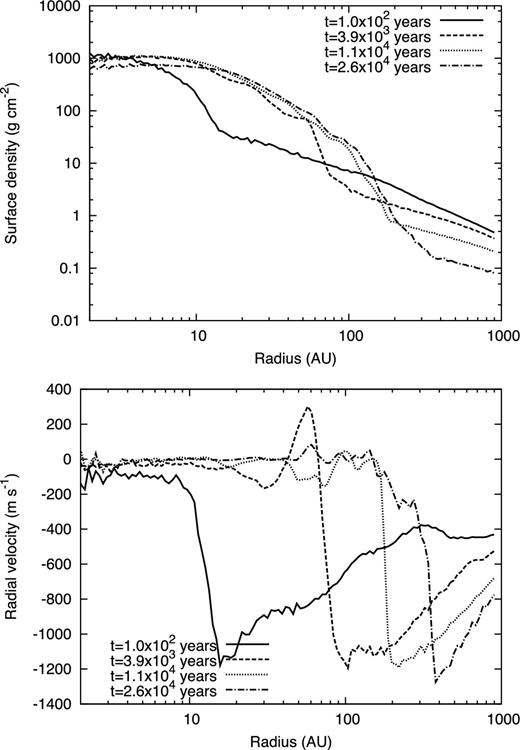
Radial distribution of surface density (top) and radial velocity (bottom) for model 6. Lines correspond to 1.0 × 10² yr (solid), 3.9 × 10³ yr (dashed), 1.1 × 10⁴ yr (dotted) and 2.6 × 10⁴ yr (dot–dashed) after protostar formation.
Fig. 8 shows the Fourier amplitudes of the surface density at 100 au for 2 × 10⁴ yr after protostar formation for model 6. For t ≲ 5 × 10³ yr, the disc radius is smaller than 100 au. Thus, these amplitudes during this epoch originate not from the circumstellar disc but from anisotropic accretion from the infalling envelope. After the circumstellar disc grows sufficiently, unlike the model which has strong turbulence, the m = 2 mode dominates the other modes, especially for t ≳ 1 × 10³ yr, as shown in the bottom-right panel of Fig. 6.
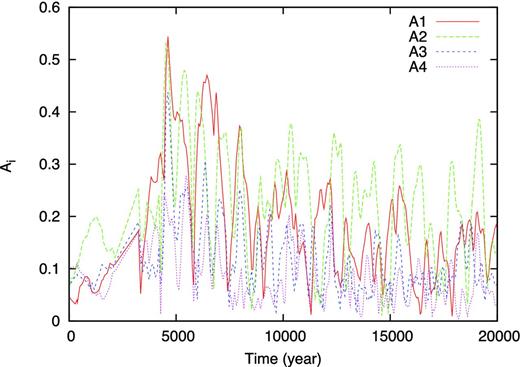
Evolution of Fourier amplitudes of surface density at 100 au versus elapsed time after protostar formation for model 6.
As seen in previous studies (Laughlin, Korchagin & Adams 1998; Lodato & Rice 2005), without gas accretion on to the disc, the gravitational instability of the disc tends to develop the m = 2 spiral arms. Because of the weak turbulence in this model, the gas falls almost isotropically on to the circumstellar disc. Thus, the prominence of the m = 2 mode is attributed to the gravitational instability of the disc. On the other hand, in the model with the strong turbulence, the m = 1 density perturbation mode is dominant in the disc. This m = 1 mode is considered to be caused by anisotropic gas accretion on to the circumstellar disc. Note that the initial density perturbation of the disc strongly affects the non-linear development of the spiral arms (Laughlin & Bodenheimer 1994). These major modes play an important role in angular momentum transfer and readjust the surface density towards a more stable configuration.
3.2 Evolution of disc orientation
Fig. 9 shows the time evolution of the angle of orientation of the disc angular momentum with respect to the angular momentum of the entire initial cloud core for non-fragmentation models (models 1–6). Because the disc is mainly supported by rotation, the orientation of the disc angular momentum roughly corresponds to the disc orientation. The disc angular momentum (disc orientation) is parallel to the angular momentum of the initial cloud core when θ = 0°. In the figure, the origin of time is set to the epoch when the protostar forms. This figure shows that the disc orientation is generally misaligned with respect to the total angular momentum of its host core at its formation and dynamically changes during the main accretion phase regardless of the strength of the turbulence. In each model, the angle of orientation of the disc is 30°–60° towards the angular momentum of the initial cloud core at the protostar formation epoch (t = 0). As the accretion proceeds, the angle of orientation gradually decreases, reaching θ ≲ 15° within several 104 yr for all models. It is expected that the disc orientation will be aligned with the angular momentum of the cloud core when the gas accretion ceases.
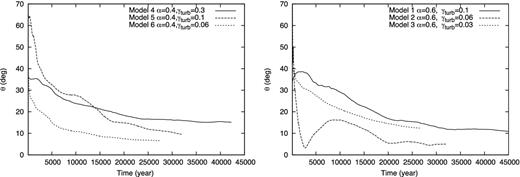
Time evolution of the orientation of disc angular momentum. The orientation angle θ = 0° corresponds to the orientation of the angular momentum of the initial cloud core. Left-hand panel shows models having α = 0.4, in which the solid, dashed and dotted lines correspond to models with parameters of γturb = 0.3, 0.1 and 0.06, respectively. Right-hand panel shows models having α = 0.6, in which the solid, dashed and dotted lines correspond to models with γturb = 0.1, 0.06 and 0.03, respectively.
The right-hand panel of Fig. 9 shows that the angle of orientation for model 2 (α = 0.6 and γturb = 0.06) varies irregularly with time. In the model, a very compact disc (≲ 10 au) forms at first. It accretes on to the protostar and disappears in a short duration of ∼103 yr. Then, another larger disc forms by the subsequent mass accretion. Reflecting this disc disappearance, model 2 shows an irregular evolution of disc orientation. This irregular evolution in the early disc evolution stage may be unrealistic because of artificial treatment of the accretion on to the sink particle. However, this treatment for sink particle does not qualitatively change our claim that the disc orientation angle dynamically changes with time.
3.3 Fragmentation and evolution of discs in binary system
In models 7–9, fragmentation of filament occurs and a binary or multiple stellar system appears, whereas only a single protostar forms in models 1–6. The fragmentation process in a turbulent cloud core differs considerably from that in a cloud core with initial rigid rotation. Fig. 10 shows the density distribution when the protostars form for models 7–9. The figure indicates that the binary or multiple system forms by fragmentation of the filament. The figure also shows that the discs in a binary or multiple systems are not aligned with each other. For these fragmentation models, fragmentation tends to occur near the edge of the filament. This fragmentation process is possible to be explained by the focal point scenario suggested by Burkert & Hartmann (2004).
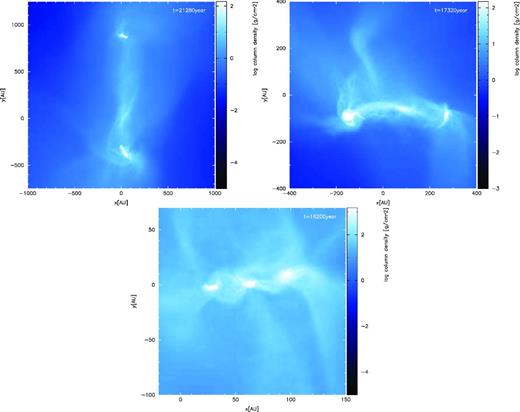
Logarithm of face-on surface density when a binary or multiple system appears in model 7 (top left, γturb = 0.3), model 8 (top right, γturb = 0.1) and model 9 (bottom, γturb = 0.06). Models 7–9 have the same initial thermal energy of α = 0.2.
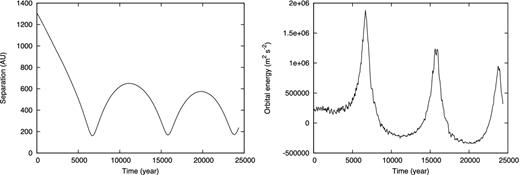
Time evolution of the separation between primary and secondary protostars (left) and the orbital energy (right) for model 7.
Fig. 12 shows an edge-on snapshot around the binary system at the end of the simulation (t = 2.5 × 10⁴ yr after the second protostar formation). Because the disc orientation around each protostar is mainly determined by the local velocity field at which the protostar forms, the discs are not aligned with each other. The misalignment is also seen in model 8. Thus, it seems that the misalignment between discs is a general feature of binary/multiple systems which form via filament fragmentation and initially have large separation (≳ 100 au).
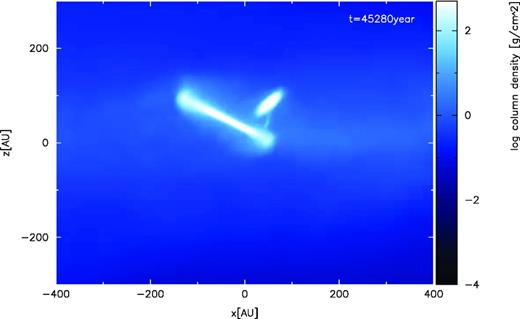
Surface density distribution at the end of calculation for model 7 (α = 0.2 and γturb = 0.3). Calculation stops 2.5 × 10⁴ yr after the secondary protostar forms.
The left-hand panel of Fig. 13 shows the evolution of the orientation angle of the discs from the angular momentum direction of the host core and the mutual inclination between the primary and secondary discs. In this study, we call the circumstellar disc around the primary protostar the primary disc and that around the secondary protostar the secondary disc. The angle of the primary disc orientation is ∼90° in the very early phase of disc formation, and it decreases with time (right-hand panel). The sudden increases at t = 6 × 10³, 1.6 × 10⁴ and 2.4 × 10⁴ yr are due to close encounters, as seen in Fig. 11. At each close encounter, the angle variation for the secondary disc is larger than that for the primary disc, which is because the secondary disc is less massive than the primary disc. Thus, the secondary disc is strongly affected by the tidal interaction. As seen in the right-hand panel of Fig. 13, the primary and secondary discs are inclined from the orbital plane by approximately 50° and 30° at the end of the simulations.
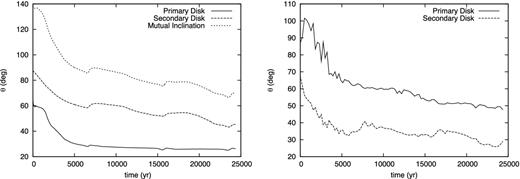
Left-hand panel shows time evolution of the angle of disc orientation with respect to angular momentum of initial cloud core for primary (solid line) and secondary (dashed line) discs, and mutual inclination between the primary and secondary discs (dotted line). Right-hand panel shows the time evolution of the inclination of the primary (solid line) and secondary (dashed line) discs towards the binary orbital plane.
4 DISCUSSION
4.1 Dynamical change of disc orientation
As shown in Fig. 9, the disc orientation is generally misaligned with the angular momentum of its host cloud core and dynamically changes during the main accretion phase even in a weakly turbulent cloud. This is because the angular momentum of the entire cloud core is determined mainly by the velocity field, whose wavelength is comparable to the cloud scale, λ ∼ Rcloud. On the other hand, the angular momentum of the disc is determined by the local velocity field, whose wavelength is much smaller than the cloud size, λ ≪ Rcloud. There is no phase correlation between these scales. This nature is independent of the strength of turbulence. The disc orientation changes due to the mass accretion which brings the angular momentum. The variation in the disc orientation during the main accretion phase can explain the precessing outflow (e.g. Cunningham, Moeckel & Bally 2009) because the outflow is believed to be driven by the circumstellar disc.
4.2 Misaligned discs in binary systems
When large-scale fragmentation occurs and the binary system initially has a wide separation, discs tend to be misaligned because there is no correlation between the velocity fields in different regions. Thus, when a wide binary system forms in a turbulent cloud core, discs are expected to be misaligned with each other and also misaligned with the binary orbital plane at their formation epoch. Our simulation showed that the misalignment can maintain at least for several 104 yr. Roccatagliata et al. (2011) recently observed a protobinary system embedded in a common envelope and showed that the discs are highly misaligned (edge-on and face-on discs). They suggested that such a binary system is formed by fragmentation of two different parts of the collapsing molecular cloud core. Our study can naturally explain such misaligned discs in a binary system. Misaligned discs are also observed even in a multiple stellar system (Ratzka et al. 2009). Our result also indicates that such a system can form via fragmentation of the collapsing cloud core in a turbulent environment, as seen in Fig. 10.
We can also expect the disc orientation in a binary system from observations of molecular outflows or optical jets. Chen et al. (2008) observed a low-mass protostellar binary system and discovered two high-velocity bipolar molecular outflows that were nearly perpendicular to each other, showing a quadruple morphology. They concluded that the discs in a wide binary system are not necessarily co-aligned after fragmentation. A quadrupolar morphology and misaligned outflows are often observed in young binary systems (Mizuno et al. 1990; Gueth, Schilke & McCaughrean 2001; Lee et al. 2002; Carrasco-González et al. 2008). Because outflows or jets are expected to be driven by the disc, misaligned discs are expected to show misaligned outflows. Therefore, observations of wide binary systems and our results support the idea that a binary/multiple system forms via dynamical fragmentation of the filament in a turbulent molecular cloud core.
4.3 Further disc evolution and implications for planet formation in binary system
Tidal interaction between discs and protostars in binary system is essential for further evolution of disc orientation in binary system. Papaloizou & Terquem (1995) showed that perturbation of the secondary star can align the primary disc towards the binary orbital plane. Bate et al. (2000) also showed that the disc can be aligned with the binary orbital plane on the precession time-scale owing to tidal interaction. Thus, whether the disc is aligned with the orbital plane depends on the parameters of the binary system (especially on the orbital period). On the other hand, observations of main-sequence binary systems indicate that the stellar rotational equatorial planes (which may reflect the orientations of the discs) in wide binary systems (≳40 au) are often misaligned with the binary orbital plane (Hale 1994). Thus, in a wide binary system, disc misalignment is often maintained even after the main accretion phase.
When disc misalignment remains after the main accretion phase, it is important for planet formation and the orbital evolution of planets in a binary system. When planet formation in a binary system is investigated, it is conventionally assumed that each disc is aligned with the binary orbital plane (Marzari & Scholl 2000; Tsukamoto & Makino 2007). However, when the disc and the binary orbital plane are mutually misaligned, the planet formation processes drastically change. By the Kozai effect (Kozai 1962), inward migration of planetesimals occurs. Thus, a compact dense planetesimal disc forms (Xie et al. 2011). On the other hand, the Kozai migration mechanism (Fabrycky & Tremaine 2007) seems to be preferable for explaining the existence of close-in planets if disc misalignment generally occurs. Narita et al. (2010) recently found that the orbital plane of the planets is generally not aligned with the orbital plane of the binary system. This also seems to be explained by the idea that the discs were misaligned with the binary orbital plane during the formation epoch.
4.4 Comparison with disc evolution simulations in turbulent cloud core
Goodwin et al. (2004a,b) investigated the evolution of turbulent cloud cores. As we mentioned in Section 2.2.2, they considered an ensemble of simulations with different random number seeds, and showed that fragmentation frequently occurs even with a moderate accretion rate that is realized in cloud cores with initially weak turbulence (α = 0.45 and γturb = 0.05). Their results are qualitatively the same as ours: fragmentation occurs in turbulent cloud cores and turbulence promotes fragmentation. However, the fragmentation condition shown in Goodwin et al. (2004a, b) seems to be quantitatively different from ours, because fragmentation only occurs with high accretion rate (α ≤ 0.2 and γturb > 0.06) in our simulations. This difference may originate in the difference of initial conditions. In their study, the initial cloud cores with a Plummer-like density profile has a total mass of M = 5.4 M⊙. On the other hand, in our study, the initial cloud cores with a uniform density profile has a total mass of M = 1 M⊙. Thus, although it is difficult to quantitatively compare our results with Goodwin et al. (2004a,b), the difference in initial conditions may somewhat change the fragmentation condition. It is also possible that the different numerical resolutions may also affect the fragmentation condition. They resolved the cloud core with 25 000 particles, whereas we resolved it with 520 000 particles. Mass resolutions in their study and in our study are mres = 2.1 × 10⁻⁴ and 1.9 × 10⁻⁶ M⊙, respectively, which implies that spatial resolution in our simulation is approximately five times higher than in theirs. As discussed in Nelson (2006), there is a possibility that the lower spatial resolution may enhance disc fragmentation.
Walch et al. (2010) investigated the evolution of turbulent cloud cores whose mass is Mcore = 6.1 M⊙. They fixed the mean Mach number of cloud cores to be |$\mathcal {M}=1$| and changed the minimum and maximum turbulent wavelength and random seeds. In their study, the sum of the thermal and kinetic energies exceeds the gravitational energy (i.e. α + γturb > 1). Thus, initial cloud cores are gravitationally unbound as a whole. The cloud begins to collapse after the energy dissipates by radiative cooling. By this approach, the consistency of the density distribution and the velocity field can be realized before the collapse begins. However, it is difficult to control the accretion rate on to the disc with simple parameters. Note that, in our study, the accretion rate can be controlled by the parameters α and γturb because we adopted cloud cores that were initially gravitationally unstable. They pointed out that initial differences of the angular momentum rarely affect the evolution of the cloud and circumstellar disc. Rather, a filamentary structure appearing in turbulent cloud cores affects the evolution of the protostar and disc. Their results seem to be in agreement with ours. However, whereas a clear spiral arm often develops after disc formation in our simulation, most of the discs formed in their simulations do not develop the spiral arms. This difference may come from difference in the accretion rate.
The evolution of low-mass very cold cores with a cloud mass of Mcore = 1.28 M⊙ was investigated in Walch et al. (2012). They focused on the relationship between the evolution of the core and the maximum wavelength of the turbulence. They pointed out that the dynamical fragmentation of filaments is a major process for binary formation in turbulent cloud cores. They demonstrated that binary formation via disc fragmentation is rare in the early phase of protostar formation which seems to be in agreement with our results. Their initial conditions are very cold and turbulence is very weak. Thus, discs formed in their simulations are very compact compared with ours (see Fig. 1 or Fig. 5, and fig. 2 of Walch et al. 2012). In this study, we focused on the relationship between the evolution of the circumstellar disc and the turbulent energy of the cloud core. Furthermore, we showed how the disc orientation varies in time, which is not mentioned in their study.
4.5 Validity of initial conditions
4.5.1 Inconsistency between the velocity and density field and possible effects on the results
As described in Section 2, we imposed the turbulent velocity field (Gaussian random field) on the uniform density field. Thus, they are not self-consistent when the simulation begins. Thus, it is expected that the velocity field do work to establish self-consistent density field during the early phase of cloud evolution and the turbulence would decay. This decay could change the effective turbulent energy for the simulations. Another possible effect is that the density field could be still inconsistent even after the disc formation because our initial conditions are gravitationally bounded (α + γturb < 1) and gravitational collapse immediately begins. In this subsection, we discuss whether these effects change our results.
In Fig. 14, to investigate how much the turbulence decays, we show the time evolution of the velocity dispersion in the isothermal phase (maximum density of cloud is less than the critical density, ρmax < ρc) for model 4 as an example. In the figure, the velocity dispersion slightly decreases due to the loss of turbulence energy for t ≲ 60 000 yr. Then, it turns to increase at t ∼ 60 000 yr, and continues to increase for ≳60 000 yr. This increase is attributed to the infall motion of the cloud. This figure indicates that the decrease of turbulent energy before the cloud collapse is not so large. Thus, it is expected that this energy loss rarely affects the subsequent cloud evolution significantly. We confirmed that the turbulent energy loss in other models is also small.
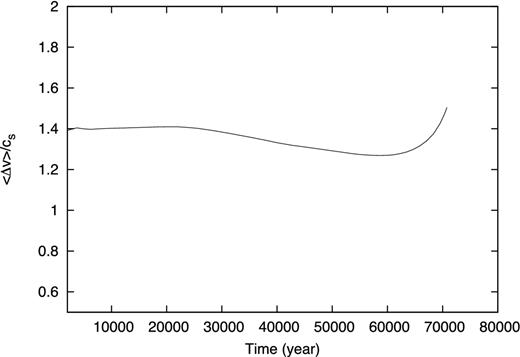
Velocity dispersion, Δv, as a function of time in the isothermal collapse phase is shown.
Next, we discuss how the inconsistent density field affects the evolution of the system. In this study, we showed (i) anisotropic accretion enhances the low-order mode of spiral arms in the disc, (ii) the disc orientation dynamically changes during the main accretion phase and (iii) the orientation of the discs is mutually misaligned and also misaligned with the orbital plane in binary system if the binary stars form in different region (or initial separation is sufficiently large). They are all originated from the anisotropic gas accretion on to the disc. The inconsistent density field would be smoother than a more realistic (or self-consistent) density field. Thus, if the self-consistent density field is adopted for the initial conditions, it is expected that the anisotropic accretion may be enhanced Thus, all the above features should be more stressed but not suppressed. Therefore, our results are not changed by the inconsistent density field.
4.5.2 Validity of high mach number or highly gravitationally unstable initial conditions
In this study, to comprehensively understand the relation between turbulence and disc evolution, we adopted a wide range of parameters and investigated the disc formation both around single star and in binary system. To investigate the disc evolution process around the binary system, we adopted a bit artificial initial conditions: initial cloud core of model 7 has a large Mach number (|$\mathcal {M}>1$|) which is much larger than the typical observed value in cloud cores with masses of the order of 1 M⊙, and cores of models 8 and 9 are in highly gravitationally unstable state (α + γturb = 0.3 and 0.26). If our results and conclusions are closely related to the artificial aspects of these initial conditions, it is problematic.
However, we would like to emphasize that our finding is not related to it. The main results we obtained from the simulations of models 7, 8 and 9 are that the disc orientation of binary system generally misaligned each other and from orbital plane if the initial separation of protostars is sufficiently large. This is because there is no correlation between the local velocity fields where the protostars form. It is a fundamental property of turbulence that there is no correlation between the local velocity fields around the different positions. Thus, such a misalignment may occur in the actual molecular cloud core in which binary system forms. This should be confirmed by the observation, and we think the observations we mentioned above (Hale 1994; Roccatagliata et al. 2011) seem to support our results.
We thank S. Inutsuka, T. Tsuribe, K. Osuga, K. Tomisaka, S. Okuzumi and K. Tomida for the fruitful discussions. We also thank the anonymous referee for valuable comments. The snapshots were produced by splash (Price & Monaghan 2007). The computations were performed on a parallel computer, the XT4 system at CfCA of NAOJ and SR16000 at YITP in Kyoto University. YT is financially supported by Research Fellowships for Young Scientists from JSPS.
