


Abstract
We investigate whether there is any correlation between the X-ray afterglow luminosity and the prompt emission properties of a carefully selected sub-sample of bright Swift long Gamma-ray bursts (GRBs) nearly complete in redshift (∼90 per cent). Being free of selection effects (except flux limit), this sample provides the possibility to compare the rest frame physical properties of GRB prompt and afterglow emission in an unbiased way. The afterglow X-ray luminosities are computed at four different rest frame times (5 min, 1 h, 11 h and 24 h after trigger) and compared with the prompt emission isotropic energy Eiso, the isotropic peak luminosity Liso and the rest frame peak energy Epeak. We find that the rest frame afterglow X-ray luminosity do correlate with these prompt emission quantities, but the significance of each correlation decreases over time. This result is in agreement with the idea that the GRB X-ray light curve can be described as the result of a combination of different components whose relative contribution and weight change with time, with the prompt and afterglow emission dominating at early and late time, respectively. In particular, we found evidence that the plateau and the shallow decay phase often observed in GRB X-ray light curves are powered by activity from the central engine. The existence of the LX - Eiso correlation at late times ( ) suggests a similar radiative efficiency among different bursts with on average about 6 per cent of the total kinetic energy powering the prompt emission.
1 Introduction
Gamma-ray bursts (GRBs) are rapid, intense flashes of gamma-ray radiation occurring at an average rate of one event per day at cosmological distances. The high energy prompt emission is followed by a broad-band (X-rays to radio ranges) afterglow (Costa et al. ; Frail et al. ; van Paradijs et al. ; Bremer et al. ; Heng et al. ) that can be observed up to weeks and months after the onset of the event. The Swift satellite (Gehrels et al. ) is operative since 2004 and provided, so far, uniform observations of prompt and afterglow emission for hundreds of GRBs. Among the most interesting uses of the Swift legacy, there are the statistical studies aimed at searching for the existence of correlations among the physical parameters of GRBs. From the study of the GRB prompt properties, robust correlations among the spectral parameters of the prompt emission and its energetic and luminosity have been found (Amati et al. ; Ghirlanda, Ghisellini & Lazzati ; Yonetoku et al. ). Furthermore, many studies searching for correlations among GRB prompt and afterglow emission have been presented so far in the literature, based on the comparison of the observed properties (see, e.g., Gehrels et al. and references therein) or of the rest-frame properties, selecting GRBs for which a redshift could be measured (Berger, Kulkarni & Frail ; Ghirlanda et al. ; Nysewander et al. ; Kann et al. , ; Racusin et al. ; Bernardini et al. ; Margutti et al. ). Although this second approach enable us to physically characterize these objects, it can be affected by observational biases, given that almost 2/3 of Swift GRBs are lacking a redshift measurement. Such correlation studies are of key importance for the understanding of the physics of GRB emission mechanisms and of their relation to their progenitors and to the surrounding environment.
In this paper, we investigate the existence of correlations among afterglow emission and prompt spectral properties of a carefully selected sub-sample of Swift long GRBs presented in Salvaterra et al. (). This sample is nearly complete in redshift (∼90 per cent) and, consisting of 58 GRBs, is large enough to allow significant statistical studies.
The paper is organized as follows. In Section , we describe the properties of the GRBs composing the complete sample of Salvaterra et al. (). In Section , we compare these properties and discuss our findings. Our conclusions are presented in Section . Throughout the paper, we assume a standard cosmology with h = ΩΛ = 0.7 and Ωm = 0.3.
2 The Sample: Selection and Correlations
Jakobsson et al. () proposed to select among long GRBs (those with duration above ∼2 s; Kouveliotou et al. ) detected by Swift only those with favourable observing conditions for ground-based optical follow-up 1aimed at redshift determination. This sample has a completeness in redshift of ∼53 per cent. Salvaterra et al. () restricted this sample to those events with a peak photon flux P ≥ 2.6 ph s−1 cm−2, measured in the 15–150 keV energy band by the Swift Burst Alert Telescope (BAT). This further criterion selects 58 GRBs, 52 with a measured redshift (a completeness level of 90 per cent, which increases up to 95 per cent considering events with some constraint on z). Being free of selection effects (except flux limit), such sample provides the possibility to compare the rest-frame physical properties of GRB prompt and afterglow emission in an unbiased way.
2.1 Correlation analysis
The obtained afterglow X-ray luminosities were compared with the prompt emission isotropic energy Eiso, the isotropic peak luminosity Liso and the rest frame peak energy Epeak reported in a companion paper by Nava et al. () for the bursts of our sample. As a result, we obtained 46 GRBs for which all the quantities LX, Eiso, Liso and Epeak were determined (79 per cent of the sample). GRBs with limits on the redshift were not included in our analysis.
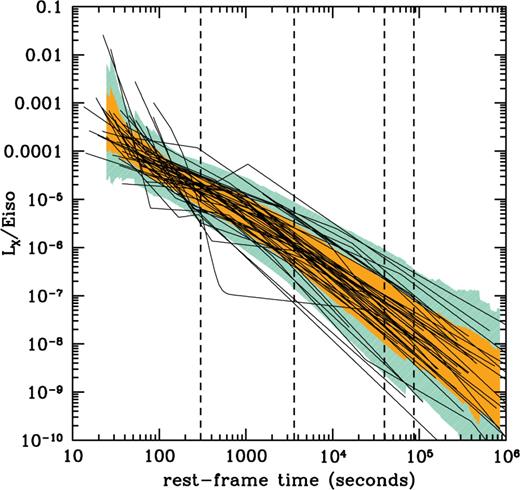
Best fit of the X-ray luminosity light curves of the 46 GRBs analysed in this paper normalized to their Eiso. The X-ray luminosities were computed for each GRB in the common rest frame 2-10 keV energy band following the procedure described in Section 2. The rest frame times at which we computed LX-Eiso, LX-Epeak and LX-Liso correlations are marked with vertical dashed lines. The dark (light) shaded area represents the 1σ (2σ) scatter around the mean value of the Liso/Eiso distribution at a given rest-frame time trf.
The list of GRBs included in our sample, together with their rest frame X-ray afterglow luminosities, is presented in Table 1.
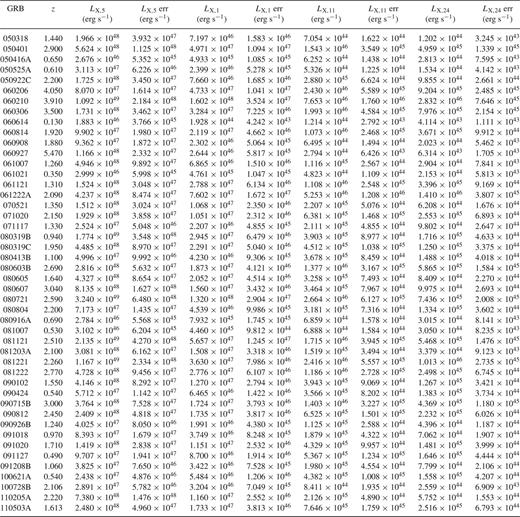
X-ray luminosities in the 2-10 keV rest frame energy band computed at four different rest frame times (5 min, 1 h, 11 h and 24 h) for the GRBs studied in this paper (see Section 2 for details). Errors are at the 90 per cent confidence level.
3 Results and Discussion
The results of our correlation analysis and linear fitting are reported in Table 2 and plotted in Fig. 2. As a general trend, we note that the afterglow X-ray luminosity at early times (trf =5 min and trf =1 h) strongly correlates with the prompt emission quantities Eiso and Liso with null probabilities of less than 10−4 and small dispersion (∼0.3 dex). At later times (trf =11 and trf =24 h), the correlations become less strong, although still significant (Pnull ∼ 10−2), with an increase in the dispersion (0.4–0.5 dex). The correlation between the X-ray luminosity and Epeak seems to follow the same trend, even if in this case the significance is lower at all sampled times (although with probabilities > 95 per cent). We also tested if these correlations are affected by evolutionary effects and if their slopes change with redshift. Being complete in redshift, our sample represents an ideal test bench to perform this kind of check. To this end, we divided the sample into two redshift bins (z < 1.8 and z > 1.8), each one consisting of 23 events, and repeated the analysis described in Section (the results are reported in Table 3). No significant change (within 2σ c.l.) is found in the slopes of each individual bin with respect to the ones obtained for the whole sample, excluding any dependence on the redshift for the correlations.
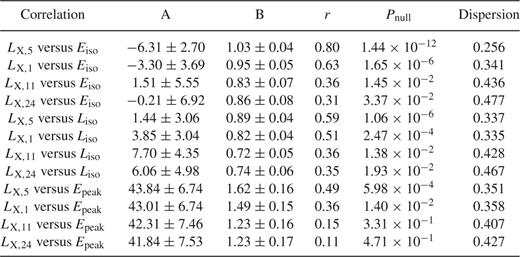
Correlation fits and coefficients. Data distributions were fitted with the function y = 10AxB (see Section 2.1 for details). Errors are at 1σ confidence level.
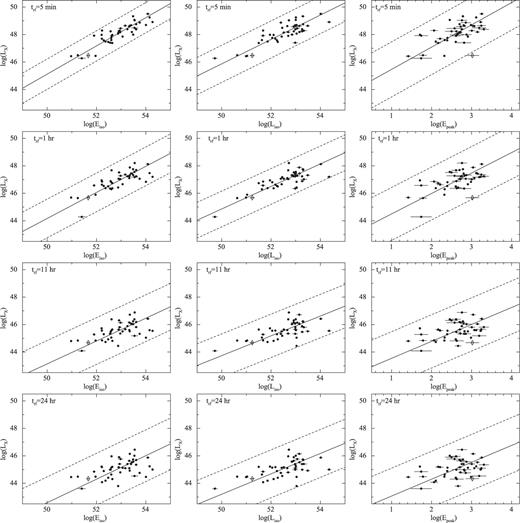
The LX-Eiso, LX-Liso and LX-Epeak correlations studied in the present paper at different rest-frame times. The solid lines represent the best fit obtained with the method described in Section 2.1. The 3σ scatter of the distribution data points lies within the dashed lines. GRB061021, found to be an outlier of the Epeak-Eiso correlation (Nava et al. 2012), is marked with a diamond.
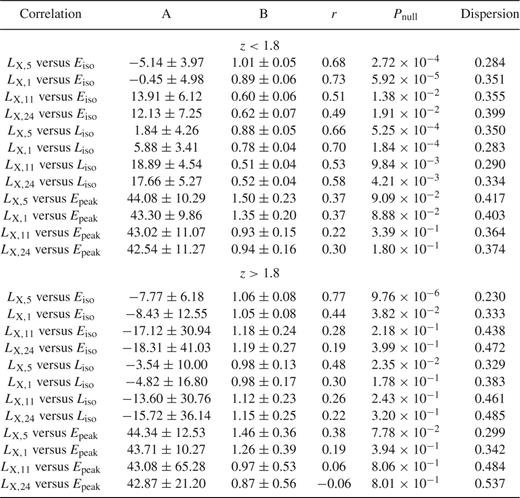
Correlation fits and coefficients for the GRBs of our sample divided into two redshift bins (z < 1.8 and z > 1.8; see Section 3 for details). Data distributions were fitted with the function y = 10AxB (see Section 2.1 for details). Errors are at 1σ confidence level.
3.1 Early time correlations
The so-called canonical X-ray light curve of GRBs (Nousek et al. ; O'Brien et al. ; Zhang et al. ) shows a double broken power-law profile with an initial steep decay (typically at (t − t0)obs < 300–500 s), followed by a plateau phase and ends (at (t − t0)obs > 103–104 s) with a ‘normal’ afterglow decay. While there is general consensus on the association of the initial steep decay with the tail of the prompt emission (Kumar & Panaitescu ; Tagliaferri et al. ) and of the normal decay with pure external forward shock afterglow emission (Sari, Piran & Narayan ; Chevalier & Li ), the nature of the plateau decay phase is still debated. The usual explanation of this phase is that the observed emission is a combination of external forward shock (afterglow) and energy injection coming from late-time activity of the central engine (see, e.g., Zhang et al. and references therein). However, not all the GRBs display the canonical X-ray light curve5 but almost all the events can be described with a combination of some of the three different kinds of power-law decays described above (see, e.g., Evans et al. ; Bernardini et al. ). It has been shown that the steep decay phases can be considered equivalent independently of the morphology of the light curve where they are observed and that this is also valid for the normal decay phases (Evans et al. ; Bernardini et al. ). For the sake of simplicity, in the following we will consider for our purposes also the plateau phase of the canonical X-ray light curves and the shallow decay frequently observed in the broken power-law X-ray light curves as equivalent (as also suggested by Bernardini et al. ).
As discussed above, we found the strongest correlations when we compare the early-time X-ray luminosity at trf =5 min with Eiso and Liso. We plot again these early-time correlations in Fig. 3 using different markers for the different light curve decay phases (steep, plateau/shallow, normal). At this epoch, almost 2/3 of the X-ray light curves are in the plateau/shallow decay phase (29 events out of 46), two shows still a steep decay and the remaining (14/46) display the normal decay6. This result clearly shows that the plateau/shallow phase, as the steep decay, is likely dominated by the central engine activity, as suggested by Zhang et al. (). This conclusion is further supported by the fact that at later times the fraction of events showing the normal afterglow decay increases significantly (80 per cent at trf =1 h and more than 90 per cent at  h) together with the dispersion of the correlations. This might indicate the rise of an additional emission component, afterglow dominated. Such a trend is also clear from Fig. 1, where we plotted the X-ray light curves of all 46 GRBs normalized by their Eiso. On the other hand, Fig. 3 also tells us that a significant fraction (30 per cent) of GRBs of our sample shows a normal afterglow decay already at trf = 5 min. This provides a lower limit for the rest frame time when the onset of the afterglow occurred, and implies Lorenz factors of the order of Γ ≥ 200 for these events. GRBs with such large values of Γ are expected to be highly energetic (Sari & Piran ; Panaitescu & Kumar ; Mészáros ; Ghirlanda et al. ). To test this, we compared the distributions of Eiso of the events showing a normal afterglow decay at trf =5 min with those showing a plateau (or a steep decay). Although the value of Eiso of GRBs showing a normal decay at early time is on average higher (by a factor of ∼3), a Kolmogorv–Smirnov (K-S) test gives a 22 per cent probability, likely indicating that the two distributions are drawn from the same population. A similar conclusion can be drawn from the same K-S test performed on the distributions of Liso, which gives a probability of 70 per cent.7
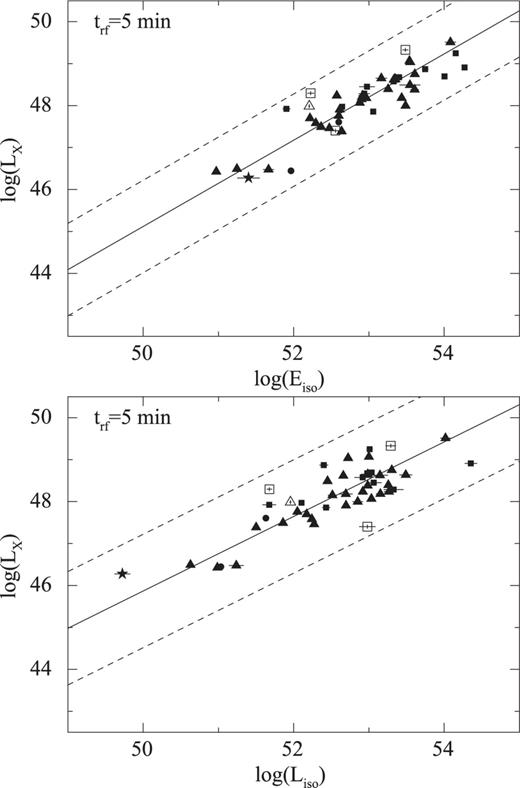
Same as Fig. 2. The different X-ray light curve decay phases are indicated: steep decay (dots), plateau/shallow decay (triangles), normal decay (squares) and odd (GRB 060614; star). Empty symbols indicate extrapolated luminosities.
Combining the slopes that we found in our correlations at trf =5 min, we are in good agreement with the corresponding slopes of the Epeak − Eiso and Epeak − Liso correlations (Amati et al. ; Yonetoku et al. ). This is in line with the work presented by Nava et al. () where it is shown that these two correlations also hold for our complete sample of GRBs. In their analysis, Nava et al. () pointed out the presence of one outlier (GRB 061021) of the Epeak - Eiso correlation. Indeed, as can be seen in Fig. 2, we find that GRB 061021 is consistent with the LX - Eiso and LX - Liso correlations at any time, while it falls outside the 3σ region of the LX - Epeak correlation. We therefore argue that the inconsistency of GRB 061021 with the Epeak - Eiso correlation is likely due to the hardness of its prompt emission spectrum (high Epeak). To this regard, we note that, our sample being limited to bright events (Section ), faint GRBs like GRB 980425 and GRB 031203 are not included. These two peculiar GRBs are well-known outliers of both the Epeak - Eiso and Epeak - Liso correlation (while they are consistent with the three-parameter  correlation recently reported by Bernardini et al. () and Margutti et al. ().
3.2 Late time correlations
 h (Table 2) can be used to constrain the radiative efficiency of the GRB prompt emission. From equation (B9) of Panaitescu & Kumar (), for GRBs with known luminosity distance, the X-ray luminosity in the 2–10 keV rest frame energy band at Trf =1 d is
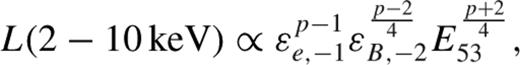
 ; Chevalier & Li ). Replacing the rest-frame X-ray luminosities at trf = 24 h reported in Table 1, in equation we can thus compute the total kinetic energy for each GRB of our sample and estimate the ratio Eiso/EK, iso, i.e. the radiative efficiency of the GRB prompt emission. For typical εe and εB values of 10−1 and 10−2, respectively, and assuming p ∼ 2.3, we find an average Eiso/EK, iso = 0.06 (σ = 0.14), in line with the values presented in past works for long and short GRBs (Freedman & Waxman ; Berger et al. ; Granot, Konigl & Piran ; Berger ; Nakar ; Zhang et al. ; Nysewander et al. ). The distribution of the Eiso/EK, iso values for the GRBs of our sample is shown in Fig. 4.
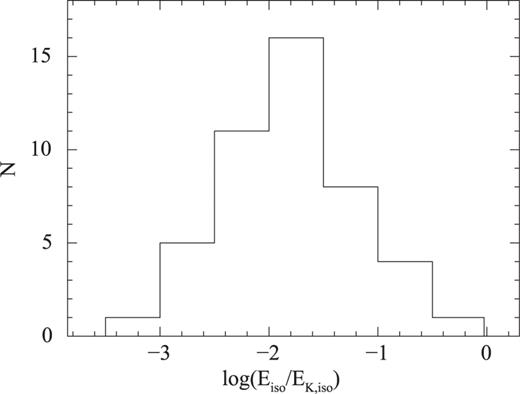
A histogram of the ratio between the prompt emission isotropic energy (Eiso) and the total kinetic energy (EK,iso) of the GRBs of our sample.
3.3 The contribution of prompt and afterglow emission to the GRB X-ray light curve
According to the standard GRB fireball model (Mészáros and references therein), a central engine is supposed to produce a number of relativistic internal shocks, which interact with each other giving rise to the prompt high-energy emission, while a broad-band afterglow emission is expected to arise from an external shock when the relativistically expanding fireball is decelerated by the surrounding medium. The observed decrease of the significance of each correlation with time (Table 2) finds a natural explanation if we assume that the GRB X-ray light curve is the result of a combination of different components whose relative contribution and weight change with time (see, e.g., Willingale et al. ), with the prompt (internal shock) and afterglow (external shock) emission dominating at early and late times, respectively. As a result, the early X-ray luminosity (being dominated by the prompt emission) correlates well with the prompt emission quantities Eiso, Liso and Epeak. On the other hand, at late time, the increase in the scatter of the LX - Eiso, LX - Liso and LX - Epeak correlations can be interpreted as due to the rising of an additional component (the afterglow).
4 Conclusions
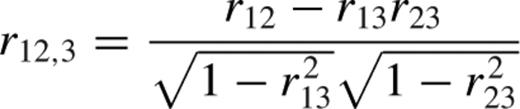
The statistical study of the rest-frame properties of GRBs gives the best opportunity to characterize the physics of these events, although such studies are often biased by the fact that almost 2/3 of GRBs are lacking a redshift measurement. In this paper, working with a sample of GRBs complete in redshift (∼90 per cent), we investigated the existence of correlations among the GRB X-ray afterglow luminosities and rest-frame prompt emission properties in an unbiased way. We tested the correlations between luminosities or between luminosity and energy performing a partial correlation analysis against the common dependence on the redshift (see Section ) and obtained the following main results.
The afterglow X-ray luminosity LX at early times (trf =5 min and trf =1 h) strongly correlates with the prompt emission isotropic energy (Eiso) and the peak luminosity (Liso). At later times (trf =11 h and trf =24 h), the LX - Eiso and LX - Liso correlations become weaker (but still significant). A similar trend is observed between LX and Epeak, even if in this case the significance of the correlation is lower at all times (although with correlation probabilities > 95 per cent).
The strongest correlations are found comparing the early-time X-ray luminosity at trf =5 min with Eiso and Liso. At this epoch, the majority of the X-ray light curves display a steep or a plateau/shallow decay. This suggests that the initial steep decay and the plateau (shallow decay) phase observed in GRB X-ray light curves are powered by activity from the central engine.
GRBs showing the normal afterglow decay already at trf =5 min, although expected to have high value of the Lorenz factor, do not show a significant excess in their Eiso and Liso with respect to the other events.
The existence of the LX - Eiso correlation at late times suggests a similar radiative efficiency (∼6 per cent) among different bursts, where brighter bursts have on average more kinetic energy.
The resulting slopes of our correlation are in agreement with the Amati and Yonetoku correlations (see also Nava et al. ). The inconsistency of GRB 061021 with the Epeak - Eiso correlation is likely due to the hardness of its prompt emission spectrum (high Epeak).
The decrease of significance of these correlations with time indicates that the early X-ray luminosity is still dominated by the prompt emission, while at late times the most significant contribution to the X-ray luminosity is given by the external shock afterglow emission.
Acknowledgments
This work made use of data supplied by the UK Swift Science Data Centre at the University of Leicester. We acknowledge the Italian Space Agency (ASI) for financial support through the grant I/011/07/0.
References
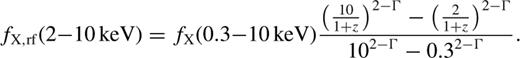
The measure of the X-ray afterglow flux at 11 and 24 h post-burst in the observer's frame is a choice commonly made in the literature for statistical studies focused on the study of late-time ‘pure’ afterglow emission (see, e.g., De Pasquale et al. ; Jakobsson et al. ; Gehrels et al. ; Gendre, Galli & Boër ; Nysewander, Fruchter & Pe'er ). For this work, we kept the same time bins converting them in the rest frame.
This is true also for the events of our complete sample, where only 18 of the 46 light curves studied in this work show the canonical morphology.
We are not considering here GRB 060614, whose light curve shows an odd profile (see Section ).
Also in this case, the average value of Liso is a factor of ∼3 higher for GRBs showing a normal decay at trf =5 min.
