


Abstract
In this paper, we report on the discovery of an optical flare observed in the R band from the red-dwarf eclipsing binary CU Cancri, whose component stars are at the upper boundary of full convection (M1= 0.43 M⊙ and M2= 0.4 M⊙, where M⊙ is the solar mass). The amplitude of the flare is the largest among those detected in the R band (∼0.52 mag) and the duration time is about 73 min. Like flares observed on the Sun, quasi-periodic oscillations were seen during and after the flare. Three more R-band flares were found by follow-up monitoring. In total, this binary was monitored photometrically by using an R filter for 79.9 h, which has revealed an R-band flare rate of about 0.05 flares per hour. Together with other strong chromospheric and coronal activities (i.e. very strong Hα and Hβ emission features and an extreme ultraviolet and X-ray source), these detections indicate that it has very strong magnetic activity. Therefore, the apparent faintness (∼1.4 mag in the V band) of CU Cnc, compared with other single red dwarfs of the same mass, can be plausibly explained by the high coverage of dark spots.
1 INTRODUCTION
Although M-type stars (i.e. red dwarfs with masses less than 0.6 M⊙, where M⊙ is the solar mass) are the most populous stellar objects in the Galaxy, to date, only about a dozen eclipsing red-dwarf binaries in detached systems have been detected and studied in detail. This is because of the low probability of finding them and because of their very low intrinsic brightness (e.g. Torres & Ribas 2002; Blake et al. 2008; Irwin et al. 2009; Morales et al. 2009). The fundamental stellar properties of these binaries (in particular, their masses and radii) can be measured with high precision (better than 2 per cent). Therefore, these binaries can play a key role in our understanding of stellar physics near the bottom of the main sequence in the Hertzsprung–Russell diagram.
With an orbital period of 2.771468 d, CU Cancri (= GJ 2069A, HIP 41824) is one of the few known extremely low-mass eclipsing binaries (e.g. Ribas 2003; Blake et al. 2008; Irwin et al. 2009; Morales et al. 2009). It is a nearby (d= 12.8 pc) 11.9-mag spectroscopic binary system with M3.5 Ve components, where the ‘e’ refers to the Balmer lines being in emission in the quiescent state (e.g. Reid, Hawley & Gizis 1995; Delfosse et al. 1999b). Photometric monitoring with the 0.7-m Swiss telescope at the European Southern Observatory has revealed that it is an eclipsing binary (Delfosse et al. 1999a). Subsequent investigations have suggested that this eclipsing binary has a fainter visual companion at an angular distance of ∼12 arcsec, with common proper motion (Giclas, Slaughter & Burnham 1959) and radial velocity (Delfosse et al. 1999b). This fainter companion is also a double system.
Ribas (2003) has published the complete light curves in the R and I bands and has determined the absolute parameters of CU Cnc by combining the photometric elements with the existing spectroscopic solutions. The derived orbital inclination is i= 86°.34(±0.03), which indicates that it is a total eclipsing binary and that the absolute parameters can be determined with high precision. The results were M1= 0.4333(±0.0017) M⊙, M2= 0.3980(±0.0014) M⊙, R1= 0.4317(±0.0052) R⊙ and R2= 0.3908(±0.0094) R⊙. It has been found that the two components in the binary are fainter than other stars of the same mass, with a magnitude difference of about 1.4 mag in the V band and 0.35 mag in the K band. As discovered for other eclipsing binary stars, most theoretically evolutionary models underestimate the radii of the component stars by as much as 10 per cent.
Ribas (2003) has obtained high-resolution spectra that reveal very strong Hα and Hβ emission features (double lines). Like that of YY Geminorum, the Hα equivalent width of CU Cnc is large, but this is not unreasonable when compared with young red dwarfs (e.g. Soderblom, Duncan & Johnson 1991). However, the strong Hα emission in the two binary systems is more related to the tidal spin-up caused by orbital synchronization rather than age (e.g. Ribas 2003). Apart from showing Hα chromospheric emission, CU Cnc also displays strong X-ray and extreme ultraviolet (EUV) emission (e.g. Schmitt, Fleming & Giampapa 1995; Voges et al. 1999). The calculation of LX/LBol by Ribas (2003) yielded a value of 10−3, which is very close to the value of YY Gem. As for the dark-spot activity of CU Cnc, the analysis of the light curve by Ribas (2003) indicates that there are two spots – one on each component. The spot on the primary component appears to be relatively small – it has a radius of 9° and it is 450 K cooler than the photosphere – while the secondary component has a much larger spot (with a radius of 31° and a temperature difference from the surrounding photosphere of 200 K).
Flares are known as sudden and violent events that release magnetic energy and hot plasma from stellar atmospheres. These are observed on magnetically active stars and, much more closely, on the Sun. Observations have shown that flares on M-type stars occur more frequently than those on G- and K-type stars (e.g. Moffett 1974; Lacy, Moffett & Evans 1976; Henry & Newsom 1996). However, no flare activities have previously been observed on CU Cnc. Here, we report on the flares of CU Cnc observed recently in the R band, including a flare with the largest amplitude and showing quasi-periodic oscillations.
2 OPTICAL FLARES FROM CU CNC
With the aim of furthering our understanding of the properties of the variations of light curves and the orbital period changes of red-dwarf eclipsing binaries (e.g. YY Gem, TU Boo, CU Cnc, FS Aur, NSVS 02502726 and DV Psc), we have monitored these photometrically using two Andor DW436 2K CCD cameras mounted on the 1.0-m and 60-cm telescopes at the Yunnan Astronomical Observatory. During the monitoring of CU Cnc with the 60-cm telescope on 2009 October 28, we were lucky to detect a large flare in the R band (see Fig. 1). The integration time for each CCD image was 90 s. The coordinates were  and δ2000=+19°23′49″5 for the comparison star, and
  and δ2000=+19°26′59″3 for the check star. The observed images were reduced by using phot (measure magnitudes for a list of stars) of the aperture photometry package of iraf.1
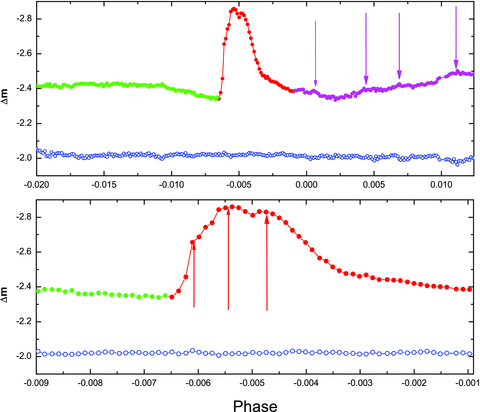
A very energetic R-band flare from CU Cnc is shown, where the solid dots in different colours represent the magnitude difference between CU Cnc and the comparison star. The energetic flare (red dots) was observed on 2009 October 28. It occurred during the primary eclipse, indicating that it might be from the secondary component. Green solid dots represent the brightness in the quiescent state, while blue open circles represent the difference between the comparison star and the check star. The magenta arrows in the upper panel show the times of the four smaller post-flare eruptions. Details of the properties of the flare are displayed in the lower panel, where three small eruptions (the arrows) are detected during the flare. This suggests that there is a quasi-periodic oscillation in the flare. The phases of the observation were calculated with the linear ephemeris given by Ribas (2003): T(Min. I) = HJD 245 0208.5068 + 2.771468 ×E.
 ), which suggests that it is not from random noise in the light curve. After this flare, four smaller eruptions were observed subsequently, indicating that there are post-flare quasi-period pulsations, which have also been observed in subsequent solar flares (e.g. Grechnev, White & Kundu 2003). The maximum relative luminosity at the flare peak can be calculated by using
Three more flares in the R band were found by follow-up monitoring with the 60-cm telescope. We used the following criteria. (i) A flare should last for several minutes and it should contain more than one data point, because a peak represented by a single data point could be a result of cosmic rays from the direction of the stars. (ii) The amplitude of the peak should be no less than  (three times the photometric error of about
  ). The flare observed on 2009 December 10 occurred just after the secondary eclipse (as shown in Fig. 2), and the other two flares took place out of eclipses. We do not know whether the three R-band flares are from the more massive component or the less massive component. All three flares are shown in Fig. 2, where the phases of the observations have been computed based on the ephemeris given by Ribas (2003).
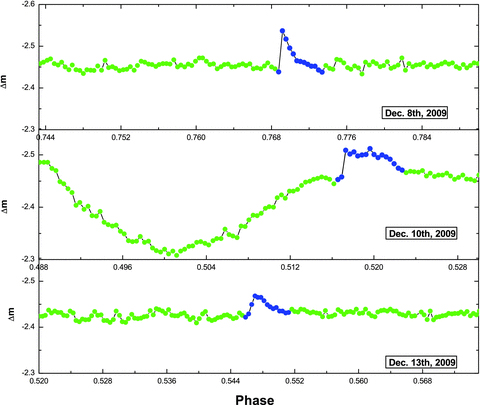
Three R-band flares of CU Cnc observed on 2009 December 8, 10 and 13. The phases of the observation were calculated using the linear ephemeris given by Ribas (2003).
In all, we were monitoring CU Cnc for 90.8 h. Meanwhile, the R filter was used for 79.9 h, revealing an R-band flare rate of 0.05 flares per hour. The log of the photometric monitor of CU Cnc is listed in Table 1. The flare rate of CU Cnc is comparable with that of the other cool eclipsing binary star, CM Draconis (e.g. Kim et al. 1997). However, because the four flares were observed in the R band, this indicates that they are energetic flares. We suspect that the true flare rate might be higher than this value, because less energetic flares cannot be found in the R band.
Log of the photometric monitor for CU Cnc.
| Date | Start ut | End ut | Filter | Flare | Telescope |
| 2007 December 8 | 19:00:31 | 19:58:03 | R | No | 1.0-m |
| 2008 March 28 | 14:56:31 | 17:39:51 | I | No | 1.0-m |
| 2009 October 28 | 20:04:29 | 22:34:18 | R | Yes | 60-cm |
| 2009 November 22 | 18:35:59 | 20:29:45 | R | No | 60-cm |
| 2009 November 28 | 16:57:26 | 22:14:32 | V | No | 1.0-m |
| 2009 November 29 | 16:36:07 | 19:18:42 | R | No | 60-cm |
| 2009 November 30 | 17:13:44 | 18:15:13 | R | No | 60-cm |
| 2009 December 1 | 16:24:45 | 22:31:08 | R | No | 60-cm |
| 2009 December 3 | 16:50:52 | 22:02:32 | V | No | 1.0-m |
| 2009 December 7 | 16:13:10 | 20:29:47 | R | No | 60-cm |
| 2009 December 8 | 15:58:09 | 22:50:54 | R | Yes | 60-cm |
| 2009 December 9 | 16:10:47 | 22:59:43 | R | No | 60-cm |
| 2009 December 10 | 16:08:36 | 22:53:47 | R | Yes | 60-cm |
| 2009 December 11 | 17:09:30 | 22:48:37 | R | No | 60-cm |
| 2009 December 12 | 15:46:17 | 23:03:46 | R | No | 60-cm |
| 2009 December 13 | 16:16:59 | 20:18:19 | R | Yes | 60-cm |
| 2009 December 14 | 15:40:24 | 21:53:20 | R | No | 60-cm |
| 2009 December 15 | 15:38:29 | 23:02:50 | R | No | 60-cm |
| 2009 December 16 | 15:38:04 | 20:09:29 | R | No | 60-cm |
| 2009 December 17 | 15:38:09 | 20:40:32 | R | No | 60-cm |
3 DISCUSSION AND CONCLUSIONS
Because flares are most readily observed in the U and B bands, the fact that the four flares were observed in the R band suggests that they are highly energetic. Among all of the R-band flares observed so far (see Table 2), the flare from CU Cnc, which took place on 2009 October 28, has the largest amplitude, indicating that it is one of the most energetic giant flares. The detection of four R-band flares, especially the very energetic flare from CU Cnc, reveals that this is a strong magnetically active system.
Flares of cool stars observed in the R band.
| Star name | Flare amplitude Δm | Total duration (min) | Reference |
| V405 And | 0.12 | 80 | Vida et al. (2009) |
| CU Cnc | 0.52 | 73 | This paper |
| CU Cnc | 0.10 | 17 | This paper |
| CU Cnc | 0.05 | 23 | This paper |
| CU Cnc | 0.04 | 38 | This paper |
| FR Cnc | 0.21 | 41 | Golovin et al. (2007) |
| WY Cnc | 0.045 | 64 | Kozhevnikova et al. (2006) |
| CM Dra | 0.23 | 60 | Nelson & Caton (2007) |
| CM Dra | 0.04 | 135 | Nelson & Caton (2007) |
| CM Dra | 0.08 | 135 | Nelson & Caton (2007) |
| CM Dra | 0.09 | 135 | Nelson & Caton (2007) |
| CM Dra | 0.02 | 34 | Nelson & Caton (2007) |
| CM Dra | 0.02 | 40 | Nelson & Caton (2007) |
| CM Dra | 0.21 | 92 | Kozhevnikova et al. (2004) |
| CM Dra | 0.10 | 70 | Kozhevnikova et al. (2004) |
| CM Dra | 0.03 | 21 | Kozhevnikova et al. (2004) |
| CM Dra | 0.21 | 34 | Kozhevnikova et al. (2004) |
| DV PSc | 0.02 | 13.5 | Zhang, Zhang & Zhu (2010) |
| XY UMa | 0.04 | 30 | Zeilik, Elston & Henson (1982) |
Quasi-periodic pulsations are a common feature of the flare energy release process of the Sun, which can be seen in all observational bands with periods from a fraction of a second to several minutes (e.g. Nakariakov & Melnikov 2009). As for stellar flares, a few cases of quasi-periodic oscillations have been reported. Rodonò (1974) detected white-light intensity oscillations (13 s) during a flare on the red-dwarf star Π Tau and Π Peg. Mathioudakis et al. (2003) observed 5-min white-light intensity oscillations in a flare on the RS CVn-type eclipsing binary, Π Pegasi. During the observation, quasi-period pulsations with a mean period of 3 min were discovered on the flare with the largest amplitude. Observational evidence has revealed that there are post-flare oscillations. This is the first time that quasi-periodic oscillations have been detected during and after the flaring energy release of a close eclipsing binary star. The physical mechanisms that cause this are unclear.
At least 80 per cent of all stars in the Galaxy are red dwarfs. However, despite the fact that these are the most common stars, their physical properties are poorly understood. A serious problem in this field is the significant discrepancy between the theoretical and observational mass–radius relations (i.e. the observed radius is about 10 per cent larger than that computed from theoretical models; e.g. Torres & Ribas 2002; Blake et al. 2008; Irwin et al. 2009; Morales et al. 2009). Some authors have realized that this discrepancy could attribute to the strong magnetic activities of the components in short-period red-dwarf eclipsing binaries (e.g. Mullan & Macdonald 2001; Chabrier, Gallardo & Baraffe 2007; López-Morales 2007; Devor et al. 2008; Morales, Ribas & Jordi 2008; Morales et al. 2010; Torres, Andersen & Giménez 2010). Mullan & Macdonald (2001) have investigated the effects of the magnetic field on stellar structure and they have pointed out that the active M-type dwarfs predicted by their magnetic models tend to have larger radii.
To resolve the mass–radius discrepancy, two scenarios have been considered (e.g. Chabrier et al. 2007). One scenario is that the magnetic field and rotation can induce a reduction in the efficiency of large-scale thermal convection in the interior, which can thus lead to less efficient heat transport. The other scenario is that the magnetic dark-spot coverage decreases the star’s radiating surface and it also yields a smaller effective temperature and a larger radius. Either one of these scenarios, or a combination of the two, can predict a larger radius than standard stellar models, but the effect of dark spots is significant over the entire low-mass domain (e.g. Chabrier et al. 2007; Morales et al. 2010). However, it is shown that high spot coverage (up to 50–100 per cent) needs to be assumed in order to solve the significant discrepancy (Morales et al. 2010). From an observational point of view, in order to explain the observations of M-type dwarfs in the young open cluster NGC 2516, the required spot coverage is about 50 per cent in rapidly rotating M-type dwarfs (e.g. Jackson, Jeffries & Maxted 2009). Reiners, Basri & Browning (2009) have claimed that there are very high filling factors for the magnetic field in rapidly rotating M-type dwarfs.
However, by modelling the light curve of CU Cnc, Ribas (2003) has obtained a significantly lower spot coverage than we have obtained in our results. This could be because the coverage of dark spots for red-dwarf eclipsing binaries might be underestimated during the photometric solution, because photometric changes of eclipsing binaries that are applied to determine the spot parameters are only sensitive to the contrast between areas with different effective temperatures and not to the total surface covered by spots (Morales et al. 2010). However, perhaps the axial symmetry of the spots also plays a role. Both components in CU Cnc are at the upper boundary of full convection. M-type dwarfs near the boundary, like the two in CU Cnc, exhibit large-scale magnetic fields, which are very axisymmetric poloidal and nearly dipolar with very little temporal variation (Morin et al. 2010). It is possible that the stable and enhanced large-scale magnetic fields are associated with the extremely high dark-spot coverage discovered in CU Cnc.
As shown in Fig. 2, the out-of-eclipse brightness of CU Cnc is changed by 0.035 mag from 2009 December 8 to December 13. This is evidence for dark-spot activity, revealing a change of dark-spot coverage by about 6.7 per cent. Because of the tidal locking and the effect of the close companions, the magnetic activity levels of close binaries are much higher than those of single stars with the same mass. Strong magnetic activity might significantly affect the structure and evolution of eclipsing binaries, and the physical properties of these objects might be different from single stars (e.g. Mullan & Macdonald 2001; Chabrier et al. 2007).
To check whether or not similar faintness was observed in other M-type eclipsing binary stars, we have compared the parameters of some eclipsing binaries (Torres & Ribas 2002; Ribas 2003; Maceroni & Montalbán 2004; Creevey et al. 2005; López-Morales & Ribas 2005; Hebb et al. 2006; López-Morales et al. 2006; Vaccaro et al. 2007; Blake et al. 2008; Devor et al. 2008; Irwin et al. 2009, 2011; Morales et al. 2009; Dimitrov & Kjurkchieva 2010; Kraus et al. 2011). The mass–luminosity relation is shown in Fig. 3. For comparison, the parameters of some single stars, as given by Xia, Ren & Fu (2008) and Preibisch & Mamajek (2008), are also shown in the figure; the solid dots refer to eclipsing binaries and open circles represent single stars. Also, the solid stars denote the positions of the components in CU Cnc. The masses of the single stars were estimated with their colours (or spectral types) and magnitudes by considering their evolutionary tracks (e.g. Baraffe et al. 1998). As displayed in Fig. 3, even those single stars that are still young and magnetically active are usually brighter than the components of short-period eclipsing binaries with the same mass, which indicates high dark-spot coverage on the component stars. However, because the masses have been measured/estimated in completely different ways, it would be premature to conclude that eclipsing binaries are fainter at the same mass. Moreover, the photometric solutions of the eclipsing binaries were obtained with several different software packages (e.g. Wilson & Devinney 1971; Popper & Etzel 1981; Southworth, Maxted & Smalley 2004; Prsa & Zwitter 2005). In the future, further comparisons are required between the brightness of M-type components in eclipsing binaries and single red dwarfs, and uniform solutions of eclipsing binaries using the same method are needed.
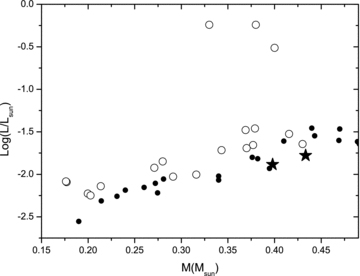
Mass–luminosity relation for M-type stars with similar components to CU Cnc. The solid dots represent the eclipsing binaries, while open circles refer to single stars. The positions of the components in CU Cnc are shown as solid stars.
Footnotes
iraf is distributed by the National Optical Astronomy Observatories, which are operated by the Association of Universities for Research in Astronomy under cooperative agreement with the National Science Foundation.
This work is partly supported by the Chinese Natural Science Foundation (grant nos. 11133007, 10973037, 10903026 and 11003040) and by the West Light Foundation of the Chinese Academy of Sciences. New CCD photometric observations of the system were obtained with the 60-cm and 1.0-m telescopes at the Yunnan Astronomical Observatory.
REFERENCES
