


Abstract
We present the results of an ionized gas turbulent motions study in several nearby dwarf galaxies using a scanning Fabry–Perot interferometer with the 6-m telescope of the Special Astrophysical Observatory of the Russian Academy of Sciences (SAO RAS). Combining the ‘intensity–velocity dispersion’ diagrams ( ) with two-dimensional maps of radial velocity dispersion, we found a number of common patterns pointing to the relation between the value of chaotic ionized gas motions and processes of current star formation. In five out of the seven analysed galaxies, we identified expanding shells of ionized gas with diameters of 80–350 pc and kinematic ages of 1–4 Myr. We also demonstrate that the
  diagrams may be useful for the search of supernova remnants, other small expanding shells or unique stars in nearby galaxies. As an example, a candidate luminous blue variable (LBV) was found in UGC 8508. We propose some additions to the interpretation, previously used by Muñoz-Tuñón et al. to explain the
  diagrams for giant star formation regions. In the case of dwarf galaxies, a major part of the regions with high velocity dispersion belongs to the diffuse low surface brightness emission, surrounding the star-forming regions. We attribute this to the presence of perturbed low-density gas with high values of turbulent velocities around the giant H ii regions.
1 INTRODUCTION
The study of the gas component of dwarf galaxies is important and challenging for several reasons. First, due to the shallow potential well and a lack of spiral density waves, such galaxies provide a good opportunity for studying the interaction of young stellar groups with the interstellar medium. The ionizing radiation of OB stars, as well as the kinetic energy of stellar winds and supernova explosions are heating the gas, forming the cavities, bubbles, shells, ordered outflows and chaotic turbulent motions in the gaseous disc. Secondly, it is important to be able to properly account for the influence of these effects on the gaseous medium in order to estimate the circular rotation curve from the observed distribution of radial velocities. The information about an accurate rotation curve is critical to study the distribution of dark matter and the mass function of dwarf galaxies within various cosmological tests.
Two-dimensional (2D) distributions of the parameters of neutral and ionized hydrogen yield the most complete and detailed data on the structure and kinematics of the interstellar medium. We managed to compare the kinematics of neutral and ionized gas for several dwarf galaxies of the Local Group using the ‘position–velocity’ diagram, allowing us to identify expanding shells (Lozinskaya, Moiseev & Podorvanyuk 2003; Lozinskaya et al. 2008). For more distant objects, the analysis of the velocity field and the shapes of Hα and 21-cm line profiles (van Eymeren et al. 2009a,b) allows us to identify gas outflows above the galactic plane. The advantage of the radio interferometry method in the 21-cm line is the capability to map the H i distribution far beyond the optical discs of galaxies, see e.g. the results of the Faint Irregular Galaxies GMRT Survey (FIGGS) (Begum et al. 2008) and THINGS (Oh et al. 2011) surveys. However, the typical angular resolution of such observations (beam = 10–30 arcsec) often provides an excessively smooth picture and does not allow us to study the motions of gas on small spatial scales. In contrast to radio observations, using 3D spectroscopy in the optical emission lines we can study the kinematics of ionized gas with a much higher resolution 1–3 arcsec. However, it is limited only to the regions having enough ultraviolet (UV) photons to ionize the gas.
Until recently, most of the 2D data on the kinematics of gas in dwarf galaxies were obtained from the radio observations in the H i line. Lately though, the situation is changing. The results of optical studies of the kinematics not only for individual objects but also for small samples of galaxies are published (Ostlin et al. 1999; Moiseev, Pustilnik & Kniazev 2010). Velocity fields of ionized gas in 200 galaxies of different morphological types, 23 of which belong to the dwarf irregular (dIrr) galaxy type, were constructed within the Gassendi Halpha Survey of SPirals (GHASP) (Epinat, Amram & Marcelin 2008) with the scanning Fabry–Perot interferometer (FPI). The growing accuracy of measurements allowed us to build and analyse not only the radial velocity fields, but also the 2D maps of ionized gas velocity dispersion (σ) in some dwarf galaxies with violent star formation. The σ maps of such galaxies were published, resulting from the observations using the methods of integral field spectroscopy (see e.g. Bordalo, Plana & Telles 2009; Lagos et al. 2009; Monreal-Ibero et al. 2010) or interferometry with the scanning FPI (Lozinskaya et al. 2006; Martínez-Delgado et al. 2007; Moiseev et al. 2010). Although such data as yet exist for less than two dozen objects, the number of constructed σ maps will be growing. That way, we are preparing to publish the results of observations of another few dozen of dwarf galaxies (Moiseev, Tikhonov & Klypin, in preparation).
The nature of the supersonic (σ > 10–20 km s−1) turbulent motions of ionized gas observed in dwarf galaxies is the subject of a long-standing debate (see discussion and references in Bordalo & Telles 2011). Thus, a number of authors (Terlevich & Melnick 1981; Melnick, Terlevich & Terlevich 2000) believe that the intensity-weighted mean velocity dispersion of ionized gas ( ) in dwarf galaxies and in giant H ii regions is determined by virial motions, i.e. by the total mass of the system. On the other hand, in their recent paper Green et al. (2010) show that in a wide range of galaxy luminosities
  is determined only by the current star formation rate (estimated from the flux in the Hα emission line) and does not correlate with the mass of the galaxy. In this case,
  is a characteristic of mechanical energy, inferred to the gas by the stellar winds and supernova explosions in the process of current star formation. For neutral gas velocity dispersion, a similar conclusion was earlier made by Dib, Bell & Burkert (2006).
To address this and other problems, related to the interaction of stellar populations and interstellar medium, we must be able to correctly interpret the structures observed in the ionized gas velocity dispersion maps. Among the few studies on this subject, let us mention the papers by Yang et al. (1996) and Muñoz-Tuñón et al. (1996), who thoroughly examined two giant star formation regions NGC 604 and NGC 588 in the disc of the M33 galaxy. They proposed a method for interpreting the observed distributions of points on the ‘line intensity–velocity dispersion’ diagram ( ) in terms of evolution of ionized shells in stellar groups. Later, with the aid of these and other similar diagrams, Martínez-Delgado et al. (2007) examined the behaviour of ionized gas in three more distant blue compact dwarf (BCD) galaxies.
How universal is this method? This paper is a subsequent attempt to thoroughly consider the nature of the structures, observed in the ionized gas velocity dispersion maps. The observational data presented here were obtained at the 6-m telescope of the Special Astrophysical Observatory of the Russian Academy of Sciences (SAO RAS) within the project devoted to the internal kinematics of ionized gas in dwarf galaxies of the Local Volume (D < 10 Mpc). To correctly interpret the results of this project, it seems to be necessary to consider the most typical features observed in the σ maps. In order to make a detailed analysis, we have selected seven most nearby galaxies (D= 1.8–4.3 Mpc) from the total sample, where we managed to study fairly well both the bright H ii regions, and faint diffuse Hα emission between them. It is important that there are H i distribution maps published for all the selected galaxies, which allows us to compare the distributions of ionized and neutral fractions of the interstellar medium. In order to better understand the features of the σ distribution, we employ the data on two more nearby dIrr galaxies, IC 10 and IC 1613, we previously studied in detail.
2 OBSERVATIONS AND DATA REDUCTION
2.1 Observations with the scanning FPI
The observations were made at the prime focus of the 6-m telescope of SAO RAS using a scanning FPI, installed inside the SCORPIO focal reducer (Afanasiev & Moiseev 2005). The operating spectral range around the Hα line was cut by a narrow-band filter with a bandwidth of a full width at half-maximum  Å. Most of the observations were made with the FPI501 interferometer, providing in the Hα line a free spectral range between the neighbouring interference orders Δλ= 13 Å and spectral resolution (FWHM of the instrumental profile) of about 0.8 Å (35 km s−1), with the scale of 0.36 Å channel−1. In 2009 November, a new interferometer FPI751 was used, having Δλ= 8.7 Å and a spectral resolution of 0.4 Å (18 km s−1) at the scale of 0.21 Å channel−1.
Between 2005 and 2009 we used the EEV 42-40 and E2V 42-90 CCD detectors, providing the image scale of 0.71 arcsec pixel−1 in 4 × 4 on-chip binned mode. In 2002, a TK1024 CCD detector was used operating in on-chip binned 2 × 2 pixel mode, yielding the image scale of 0.56 arcsec pixel−1.
During the scanning process, we have consistently obtained 36 interferograms of a given object (40 for FPI751) at different distances between the FPI plates. The seeing at different nights ranged from 1 to 3 arcsec. The data reduction was performed using the software package running in the idl environment. Following the primary reduction, airglow lines subtraction, photometric and seeing corrections using the reference stars and wavelength calibration, the observational data were combined into the data cubes, where each pixel in the field of view contains a 36- (or a 40-) channel spectrum. The detailed description of data reduction algorithms and software is presented in Moiseev (2002) and Moiseev & Egorov (2008). All galaxies except VII Zw 403 were observed in two scanned cycles in order to remove parasitic ghost reflection, as described by Moiseev & Egorov (2008).
The log of observations is given in Table 1, listing the following data: the name of the galaxy; the distance, scale (pc arcsec−1) and absolute stellar magnitude MB according to Karachentsev et al. (2004); the epoch of observations; the type of interferometer; total exposure time; resulting angular resolution (ω) after the smoothing by a 2D Gaussian (typical FWHM = 1.0–2.0 pixels) in order to increase the signal-to-noise ratio (S/N) in the regions of low surface brightness. This value was estimated from foreground stars’ images in the final data cube.
Log of the observations.
| Name | D (Mpc) | Scale (pc arcsec−1) | MB | Date | FPI | Exp. time (s) | ω | |
| (arcsec) | (pc) | |||||||
| DDO 53 | 3.56 | 17 | −13.21 | 26.2.2009 | FPI501 | 200 × 36 | 3.3 | 57 |
| DDO 99 | 2.64 | 13 | −13.41 | 26.2.2009 | FPI501 | 180 × 36 | 3.8 | 49 |
| DDO 125 | 2.54 | 12 | −14.07 | 18.5.2005 | FPI501 | 180 × 36 | 3.0 | 37 |
| DDO 190 | 2.79 | 14 | −14.13 | 04.3.2009 | FPI501 | 100 × 36 | 3.3 | 45 |
| UGC 8508 | 2.56 | 12 | −12.92 | 16.5.2005 | FPI501 | 200 × 36 | 3.0 | 37 |
| UGCA 92 | 1.80 | 9 | −14.48 | 10.11.2009 | FPI751 | 180 × 40 | 2.5 | 22 |
| VII Zw 403 | 4.34 | 21 | −13.87 | 29.11.2002 | FPI501 | 300 × 36 | 2.2 | 46 |
2.2 Velocity dispersion measurements
Referring to the velocity dispersion of ionized gas (σ) in the present paper, we mean the standard deviation of the Gaussian, describing the profile of the Hα emission line after accounting for the FPI instrumental profile and subtracting the contribution of thermal broadening in the H ii regions. We used the method described in detail in Moiseev & Egorov (2008).
The width of the instrumental profile of the FPI was measured from the calibration lamp line spectrum. The observed Hα line profiles were fitted by the Voigt function, which gives a good description of the observed profile. From the results of profile fitting, we constructed 2D radial velocity fields of ionized gas, radial velocity dispersion maps free from the effects of the instrumental profile (σreal), as well as the galaxy images in the Hα emission line and in the continuum. The flux maps were calibrated to the absolute scale of surface brightness (erg s−1 cm−2 arcsec−2) by normalizing to the total flux of the galaxy in the Hα line, known from the literature (Moiseev et al., in preparation).
The accuracy of velocity dispersion was estimated from the measurements of the S/N using the relations given in fig. 5 of Moiseev & Egorov (2008). On the σ maps, we masked the regions with a weak signal, where the formal error of velocity dispersion measurements exceeded 6–9 km s−1 (which corresponds to the S/N ≤ 7). Meanwhile the line flux maps were constructed confidently enough even for weaker lines, down to S/N ≈ 2–3.
In the case of UGC 8508, using the formula (1) we get to σ2 < 0 in the centre of several H ii regions. This is most likely caused by a smaller value of thermal broadening there due to Te < 104 K. For this galaxy we adopted σtr= 7.5 km s−1 that corresponds to Te≈ 6800 K.
In most of the objects, the observed line profile is very well described by a single-component Voigt profile.
Of all the galaxies considered, only UGC 8508 and UGCA 92 have regions in which the Hα profile reveals two components with their velocity separation larger than or comparable to the spectral resolution limit (35 and 18 km s−1, respectively).
3 ![formula]() DIAGRAMS
DIAGRAMS
Fig. 1 shows the monochromatic images in the Hα line, the σ maps, as well as the  diagrams for all the galaxies. Our diagrams differ from those built earlier (Muñoz-Tuñón et al. 1996; Yang et al. 1996; Martínez-Delgado et al. 2007): instead of the peak line intensity (Ipeak), we use the total flux in the line (I), having a clearer physical meaning (the luminosity per area unit). Since the σ maps were masked by the fixed S/N level, and the noise level in the outer regions is mainly determined by the sky background, the left-hand side boundary of the point cloud in the diagrams is an inclined line I∼σIpeak, where Ipeak= constant. The main advantage of using I against Ipeak is that the total flux obviously does not depend on spectral resolution. In order to understand the difference of result using I instead of Ipeak, we have created both types of diagrams for the sample galaxies and we conclude that all the shell-like features are preserved on the diagrams. We also abandoned the linear scale of intensities and use the log I, since the observed surface brightness difference is 2–3 orders of magnitude, which is significantly larger than the brightness range inside the giant H ii regions in Muñoz-Tuñón et al. (1996).
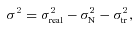
Results of observations with the FPI for each galaxy. The top row: the image in the Hα line in logarithmic values of intensity (left) and the velocity dispersion map with superimposed contours of the Hα image (right). The ellipses with numbers mark the shell-like structures, the parameters of which are given in Table 2. For DDO 125 and UGC 8508 the ellipses without numbers show large-scale cavern, discussed in the text. The cross marks the centre of the image in the continuum. The bottom row: the intensity–velocity dispersion diagram (left). The red horizontal line marks the intensity-weighted mean velocity dispersion  . The right-hand plot shows the location of regions, marked by different colours on the
  diagram. The contours correspond to the isophotes in the Hα line, their values (in log of erg s−1 cm−2 arcsec−2) are given in brackets on the right-hand bottom figures. (The full version of this figure for all galaxies is published in the electronic edition of the Journal).
The characteristic features, commented on below, are illustrated with different colours in the diagrams. The horizontal lane in dark blue has a relatively low velocity dispersion σ and high surface brightness. The boundaries of brightness are chosen so that the highlighted regions contain 50 per cent of the total luminosity of the galaxy in the Hα emission line. By red, yellow and green colours we show the regions with increased σ, trying to wherever possible identify the shell structures. The red line in the diagrams marks the level of mean velocity dispersion across the galaxy, intensity-weighted in the ith pixel:  . When we further refer to ‘high’ or ‘low’ velocity dispersion, we have in mind
  and
and  , respectively. For instance, other regions with
  are shown by orange, whereas low-luminosity regions with low σ are marked in grey.
Fig. 1 also contains maps indicating the locations of regions, marked on the corresponding  diagrams.
3.1 DDO 53
The kinematics of ionized gas in this galaxy was previously investigated with the scanning FPI by Dicaire et al. (2008), but the authors were only able to measure the distribution of radial velocities in the bright H ii regions, whereas our data include the regions of faint diffuse emission. The σ map clearly reveals a pattern, typical of all galaxies we observed: the minimum value of velocity dispersion is seen in the centres of bright H ii regions, while in the space between the star formation regions and in the outer parts of the galaxy, σ reaches its maximal values up to 40–50 km s−1, which clearly points to the supersonic nature of motions.
The shape of the  diagram resembles the scheme given by Muñoz-Tuñón et al. (1996)– a horizontal lane (marked in dark blue in Fig. 1) with
  and several inclined lanes with much larger σ values. According to the interpretation of Muñoz-Tuñón et al. (1996), such lanes must correspond to individual thin expanding shells: the maximal velocity dispersion (or even a double profile) and the minimal surface brightness at the centre of the shell; increasing I and decreasing σ with the growing distance from the centre until the inner edge of the shell is reached. The best example of such a shell is given by a structure adjacent to the north of the brightest H ii region; in the diagram it is coloured yellow (centre) and dark green (periphery). This shell-like structure is also evident in the Hα surface brightness distribution. In the figure we marked it as #1, its diameter is approximately d≈ 14 arcsec (240 pc). For all the shells we identified, Table 2 gives the estimates of the sizes along the major and minor axes (d1, d2), the maximal velocity dispersion σmax and the kinematic ages tkin= 0.5d1/σmax.
Shell parameters.
| Name | Size (pc) | σmax (km s−1) | tkin (Myr) |
| DDO 53 #1 | 240 × 240 | 39 | 3.0 |
| DDO 53 #2 | 150 × 140 | 37 | 2.0 |
| DDO 53 #3 | 150 × 150 | 37 | 2.0 |
| DDO 125 #1 | 200 × 200 | 27 | 3.6 |
| DDO 125 #2 | 160 × 120 | 25 | 3.1 |
| UGC 8508 #1 | 350 × 350 | 40 | 4.2 |
| UGCA 92 #1 | 180 × 130 | 39 | 2.2 |
| UGCA 92 #2 | 190 × 110 | 31 | 3.1 |
| UGCA 92 #3 | 90 × 90 | 31 | 1.4 |
| UGCA 92 #4 | 170 × 170 | 40 | 2.1 |
| VII Zw 403 #1 | 190 × 190 | 33 | 2.8 |
The points from the second, less contrast peak in the diagram (marked in red and green) have to correspond to a younger shell according to the model by Muñoz-Tuñón et al. (1996). On our maps the points of this peak mainly lie in two shells, designated nos. #2 and #3. According to Table 2, their kinematic age is in fact about 1.5 times shorter than that of the shell #1. On the other hand, the points from the most apparent peak on the diagram (orange colour, high σ and relatively low surface brightness) do not belong to any individual knots or shells, but form a common diffuse envelope which surrounds bright H ii regions.
3.2 DDO 99
Unlike the previous case, the  diagram for DDO 99 has a simpler shape – there are no pronounced features, except for the horizontal lane and a broad triangular region with a high σ. Some kind of a hint for a possible shell is a tiny cloud of points in the diagram with log I > −15.7, σ > 21 km s−1 (marked in green). On the map of the galaxy, these points are grouped mainly on the edge of the southern star formation region; the size of this possible shell is comparable to the spatial resolution of ∼50 pc. The remaining regions of increased σ (plotted in orange in the figure) are distributed on the periphery of H ii regions.
3.3 DDO 125
The distribution of ionized gas here reveals several shells and loops, associated with two bright star formation regions to the north and south of the galactic centre. These two H ii regions are located diametrically on the edge of a giant cavity, sized around 600 pc (denoted in Fig. 1 as ‘cavern’), inside of which there are almost no sources of gas ionization. In the centre of the cavity the H i density is also reduced (see Section 5), indicating that the gas was depleted or swept out during the previous burst of star formation. The size of the cavity and the features of mutual distribution of H i and H ii are very similar to the complex of giant shells and arcs in the galaxy IC 1613 (Lozinskaya et al. 2003; Silich et al. 2006), with a diameter from 300 pc to 1 kpc. We were unable to find any kinematic evidence for the expansion of shell DDO 125 #1, as it is not identified on the  diagram. At once the σ distribution easily reveals more compact shells DDO 125 #1 and #2, which coincides with the northern and southern H ii regions (coloured red and green in the figure). Our estimate of its age is
  . Other regions with high σ, marked in the map with orange, are embordering the bright star-forming regions.
3.4 DDO 190
The distribution of the ionized gas velocity dispersion and the  diagram here resemble the picture observed in DDO 99. Namely, the points with high σ surround bright H ii regions; velocity dispersion in H ii regions is comparable to
  . Only a few low-contrast peaks of the velocity dispersion around the elongated H ii region in the northern part of the galaxy can be regarded here as a vague hint to the shell (in terms of the model by Muñoz-Tuñón et al. 1996). These possible shells with sizes comparable to the spatial resolution of our observations are coloured green in the diagram.
3.5 UGC 8508
The observed distribution of σ is very similar to previous objects: a minimal velocity dispersion inside the H ii regions surrounded by the diffuse gas with increased σ. In addition, the  diagram reveals an inclined lane, which should correspond to a shell according to Muñoz-Tuñón et al. (1996).
Indeed, most of the points of this lane (marked in Fig. 1 with red and green) are concentrated within a huge arch of H ii regions on the edge of the western part of the disc of ionized gas. Morphologically and kinematically this resembles a half of an unclosed expanding shell with a diameter of approximately 350 pc. The kinematic age of this shell, we designated as UGC 8508 #1, is about 4 Myr (Table 2).
In a recent paper, Warren et al. (2011) showed that the eastern half of the galaxy has a cavity in the H i distribution with a diameter of about 550 pc, so that the bright H ii regions are located along its borders. However, this region (denoted as ‘cavern’ in our figure) is not distinguishable by the kinematics of ionized gas – velocity dispersion is small, except for several spots with increased σ in the heart of this cavity, where almost no Hα emission is present. They are difficult to be interpreted as a separate shell, most likely we are dealing with an increase of turbulent velocities on the border of H ii regions.
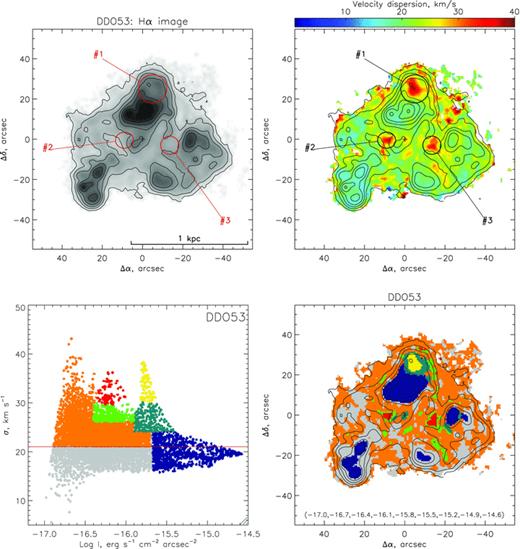
A group of points, forming a ‘horizontal sequence’ in the upper right part of the  diagram, caught our eye, since the surface brightness here is considerably greater than that for the other points with a large velocity dispersion (σ= 35–40 km s−1). All the points, marked brick-red in our scheme, are grouped within the single Hα knot on the eastern edge of the disc. Its FWHM in the image is equal to the size of stellar images, i.e. it cannot be spatially resolved. The Hα line profile has a distinct two-peak structure here with the distance between peaks of about 80 km s−1. The examples of emission line profiles are shown in Fig. 2. The mean systemic velocity of the knot is about 100 km s−1, in agreement with line-of-sight velocities of the nearest side of the galaxy disc (∼80 km s−1), i.e. it seems to belong to UGC 8508. Our first explanation based on the Hα double component profiles was that we observe a single remnant of the supernova explosion (similar to the SNR S8 in IC1613, see below). However, our new spectroscopic observations revealed that it is a good candidate to unique emission star – luminous blue variable (see Appendix A).
The regions possessing emission line profiles with a two-component structure, overlapped on the Hα images: UGC 8508 (left) and UGCA 92 (right).
3.6 UGCA 92
We observe here the most significant asymmetry in the distribution of ionized gas relative to the centre among all the galaxies of our sample. In the Hα line image, several shells and arcs are seen, most of which are related to the bright star formation region in the eastern part of the galaxy. There, five H ii regions form a closed elongated loop in the centre of which a maximum in the σ distribution is observed. One can discern a broad inclined lane on the  diagram (coloured green and orange), the corresponding points lying inside the above-mentioned loop of H ii regions. Meanwhile, in the centre of the loop, where the velocity dispersion is maximal and intensity is minimal, the Hα line profiles have a noticeable right wing, so that they can be decomposed into two components – a more intense blue one and a 1.5–2 times fainter red one (see Fig. 2). The separation between the components is ΔV= 45–57 km s−1, decreasing from the centre to edges. This multicomponent profile structure could not be a result of spatial smoothing procedures (‘beam smearing’), because the peak velocity in the H ii regions that formed this loop is constant ±10 km s−1. The observed features indicate that we are dealing with a shell (designated as UGCA 92 #2), expanding at a rate of
  ; this value coincides with the maximal velocity dispersion in this region (see Table 2). The velocity dispersion distribution easily reveals three more expanding shells of similar size and age. It is possible that the external arch structures in the western and eastern parts of the galaxy have the same nature; however, we failed to measure their expansion velocity.
3.7 VII Zw 403
We present here the re-analysed data first described in Lozinskaya et al. (2006). An empty spot near the centre is caused by masking the trace of a bright parasitic reflex (see Moiseev & Egorov 2008 for details on the ghost reflex). Galaxy VII Zw 403 is one of the most well described in the literature objects of our sample. According to Lynds et al. (1998) the age of the latest burst of star formation here is 4–10 Myr, which closely coincides with the estimates of the kinematic age of shells, associated with bright regions of star formation (at least 3–4 Myr old, according to Lozinskaya et al. 2006). On the other hand, the velocity dispersion of ionized gas in the H ii regions themselves is small:  ). The
  diagram confidently reveals an inclined lane (marked with green and orange) which, according to the model by Muñoz-Tuñón et al. (1996), must point to the presence of an expanding shell.
The distribution of points on the map of the galaxy shows that this shell (VII Zw 403 #1) is located between the bright H ii regions in the centre of the galaxy and is adjacent to region 4 according to the numbering of Lynds et al. (1998). The kinematic age of the shell coincides with the estimates by Lozinskaya et al. (2006) given above.1 Other regions of increased velocity dispersion are located at the periphery of the H ii regions and in the outer parts of the disc of ionized gas. The local gas kinematics is difficult to explain in terms of individual shells. Thus, several spots with high velocity dispersion in the northern part of the galaxy are more likely associated with the emission arcs of relatively low surface brightness, detected by Silich et al. (2002) and Lozinskaya et al. (2006). According to the cited authors, these arcs were caused by the feedback of the stellar population aged t≈ 10 Myr, formed at the early stages of the last burst of star formation.
4 THE EFFECT OF SPATIAL RESOLUTION
Yang et al. (1996) and Muñoz-Tuñón et al. (1996) have discussed and interpreted the  diagrams, constructed for the giant complexes of star formation in the nearby galaxy M33. The spatial resolution of their observations was ω≈ 3.5 pc. In this work we study more distant galaxies with a much rougher resolution (see the last column in Table 1). It is hence clear that we are losing the data on the small-scale kinematics of gas. How seriously may this affect the shape of the
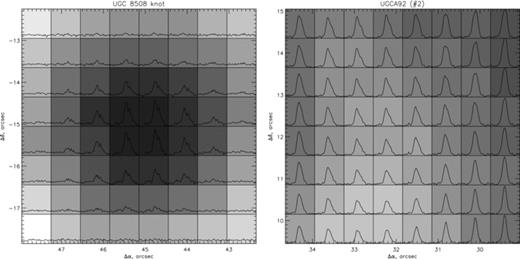
  diagrams and the distribution of velocity dispersion? In order to analyse the effects of spatial resolution on the observed kinematics, we examined two nearby and well-studied dIrr galaxies of the Local Group: IC 10 and IC 1613. We have earlier observed both galaxies at the 6-m telescope with the same equipment as described in Section 2. The spatial size of regions, encompassed by current star formation, is about 1 kpc, just like in the galaxies described above (hereinafter the ‘main sample’). A detailed description of the distributions of ionized and neutral gas, the identification of the expanding H i and H ii bubbles and a discussion of the relation between these bubbles and young stellar groups are given in Lozinskaya et al. (2008) and Egorov, Lozinskaya & Moiseev (2010) for IC 10, and in Lozinskaya et al. (2003) for IC 1613. The spatial resolution of our observations of ionized hydrogen in the Hα emission line was 5 and 8 pc, correspondingly.
To imitate the effect of low resolution, the original data cubes for IC 10 and IC 1613 in the Hα line were first smoothed by the 2D Gaussians, and then binned, so that the resulting pixel size amounted to ∼5.6 arcsec. Table 3 lists the distance to the galaxy, and the initial (ω) and smoothed (ωsmo) spatial resolution. The smoothed data show how these two galaxies would look like when observed with a resolution of ωsmo≈ 40 pc, i.e. under the same conditions as the objects of the main sample. The velocity dispersion maps and the diagrams for the original and smoothed cubes were constructed using the method described in Section 2. Fig. 3 shows the original and smoothed images of both galaxies in the Hα line, and the corresponding  diagrams are shown in Figs 4 and 5.
Smoothing of the observational data on galaxies of the Local Group.
| Name | D (Mpc) | ω | ωsmo | ||
| (arcsec) | (pc) | (arcsec) | (pc) | ||
| IC 10 | 0.73 | 1.5 | 5.3 | 11 | 40 |
| IC 1613 | 0.80 | 2.2 | 8.5 | 11 | 43 |
| Name | D (Mpc) | ω | ωsmo | ||
| (arcsec) | (pc) | (arcsec) | (pc) | ||
| IC 10 | 0.73 | 1.5 | 5.3 | 11 | 40 |
| IC 1613 | 0.80 | 2.2 | 8.5 | 11 | 43 |
The Hα images of the galaxies IC 10 (top) and IC 1613 (bottom). Left-hand column: the original results of observations with the scanning FPI; right-hand column: the same data smoothed to the spatial resolution of ∼40 pc.
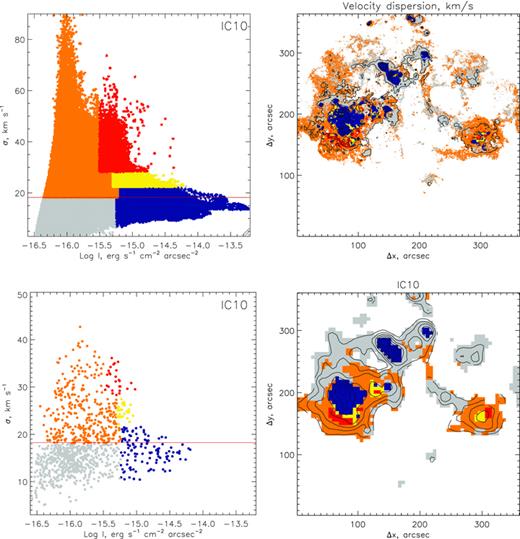
IC 10: the original (top) and smoothed (bottom) data. The left-hand plot shows the  diagrams. The red horizontal line marks the value of the intensity-weighted mean velocity dispersion
  . The right-hand plot shows the location of regions identified by different colours on the
  diagram. The contours correspond to the isophotes in the Hα line.
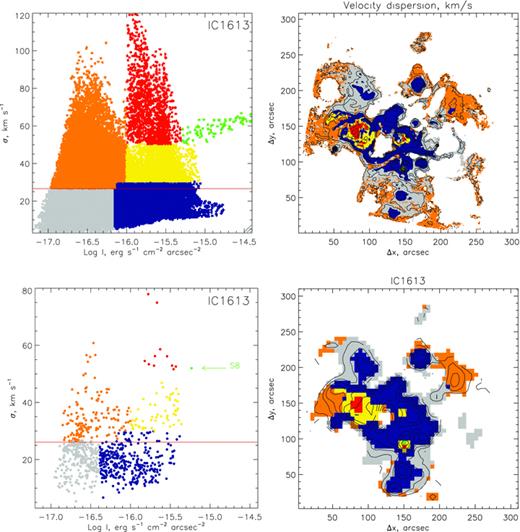
IC1613: the original (top) and smoothed (bottom) data. The left-hand plot shows the  diagrams. The red horizontal line marks the value of the intensity-weighted mean velocity dispersion
  . The arrow with a marking directs to the point, corresponding to the known supernova remnant. The right-hand plot shows the localization of regions, marked by different colours on the
  diagram. The contours correspond to the isophotes in the Hα line.
The  diagrams, constructed from the non-smoothed data, reveal a fine structure that reflects the data on gas motions on the scales of a few tens of parsecs. It is obviously lost in the smoothed data, since the construction of the corresponding diagrams involves a significantly smaller (by 100–200 times) number of points. A detailed review of the diagrams and the σ distribution maps allows us to make the following conclusions.
Smoothing significantly (by 5–10 times) decreases the observed range of surface brightness I by ‘smearing’ the compact bright H ii regions. This is particularly notable in the case of IC 10 (Fig. 4).
Similarly, the observed spread of σ values decreases almost twice due to the averaging of small-scale perturbations. On the other hand, smoothing has almost no effect on the weighted average value of the velocity dispersion
 , since the variations of radial velocity inside a sampled element (‘beam-smearing effect’) are small, compared with the magnitude of turbulent velocities.
The shape of the distribution of points on the
 diagram preserves its old ‘triangular’ form – a horizontal lane with
  (coloured dark blue) and the regions of low surface brightness with high velocity dispersion. It is also well seen how the deteriorating resolution results in the merger of separate regions with high σ, located on the periphery of H ii regions, into a common structure, embordering the star formation regions. That is exactly the picture we often see in the main sample galaxies.
Large-scale kinematically isolated structures remain visible in the smoothed images as well. In IC 10 this is primarily the so-called synchrotron superbubble, located on the southern boundary of the brightest (eastern) star formation region, and prominent by its increased velocity dispersion. We have previously shown (Lozinskaya & Moiseev 2007) that this shell centring in the X-ray source IC 10 X-1 is probably a remnant of a hypernova explosion. IC 1613 data reveal a complex of multiple shells, located in the eastern part of the star-forming region (coloured red and orange in Fig. 5). Here, the Hα line profiles have a clear two-peak structure with the velocity difference between the components of ΔV≈ 100 km s−1. In Lozinskaya et al. (2003) we thoroughly examined the  diagrams for this region and showed that the observed kinematic features are associated with the effect of expanding and possibly colliding shells of ionized gas. Among the galaxies from the main sample, similar kinematic components at congruent spatial scales were detected only in UGCA 92. The second interesting feature that attracts attention in the
  diagrams in IC 1613 is the brightest in the Hα line compact region at the centre of the field [with coordinates
  ], also characterized by a high velocity dispersion (
 ). In Fig. 5 it is marked in green. This is the supernova remnant S8, which stands out by its unusually high luminosity simultaneously in the X-ray (a marker of a young remnant) and optical (a marker of an old remnant) ranges (Lozinskaya et al. 1998). The emission line profile has a multicomponent structure here. An object with a similar position in the
  diagram and also with a multicomponent profile from the main sample of galaxies is an LBV candidate in UGC 8508.
5 DISCUSSION
In all of the above galaxies there exists a clear link between the flux in the Hα line and velocity dispersion of ionized gas. The brightest H ii regions reveal small line widths ( ); the scatter of observed values increases with decreasing surface brightness, so that in most regions of low brightness the velocity dispersion significantly exceeds the mean (
 ), although individual points may still show a low velocity dispersion (
 ). In general, the shape of the
  diagram for dIrr galaxies bears resemblance to the diagram constructed by Muñoz-Tuñón et al. (1996) for the star formation regions NGC 588 and NGC 604. Such a resemblance is not surprising in objects of different scales, since in both cases the kinematics of gas must be primarily determined by the input of mechanical energy of the wind of massive young stars and multiple supernovae explosions, the interaction of which with the circumambient interstellar medium depends on its density.
However, there is a number of differences between the kinematic properties of giant H ii regions and Irr galaxies; the sketch presented in Fig. 6 illustrates the difference.
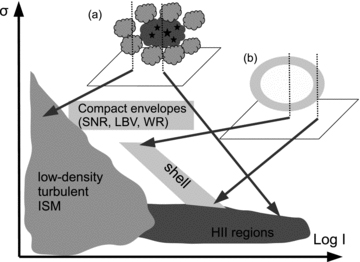
The scheme illustrating the location of points on the  diagram. The insets show how we projected on to the sky plane the surface brightness distribution and velocity dispersion (a) from dense H ii regions, surrounded by low-density gas with considerable turbulent motions, and (b) from the expanding shell within the model by Muñoz-Tuñón et al. (1996). The dotted line shows the lines of sight passing through different spatial regions.
The full scale of the regions in NGC 588 and NGC 604 emitting in the Hα line is not larger than 130–150 pc; hence, at the corresponding  diagrams the entire region of increased velocity dispersion splits into several inclined lanes, which Muñoz-Tuñón et al. (1996) identify with expanding ionized shells that differ by age. In the scheme they propose, which is illustrated in our Fig. 6 (inset b), the centre of the expanding thin shell when projected on to the sky plane has a low surface brightness and a large velocity dispersion determined by the expansion velocity. With increasing distance from the centre of the shell, the Balmer emission lines intensity increases (the line of sight intersects an even thicker layer), and σ declines, since the projection of expansion velocity on to the line of sight decreases.
In the galaxies considered above, the pattern is more complex. Here the total spatial size of the regions where we examine the motions of ionized gas is significantly (8–10 times) larger. In five out of seven galaxies of the main sample (DDO 53, DDO 125, UGC 8508, UGCA 92 and VII Zw 403), we were able to identify the expanding shells of about 80–350 pc in size. The points belonging to these shells are forming inclined lanes on the diagrams as well. However, we were unable to associate the bulk of points having a high velocity dispersion with such structures. This is not surprising, since the formation of giant shells in itself requires a number of specific conditions (a sufficient initial gas density, a simultaneous onset of starburst), and in most cases, it can be the result of the influence of several generations of star groups on the interstellar medium (McQuinn et al. 2010; Warren et al. 2011).
Perhaps we simply do not notice small shells sized 5–50 pc due to the low spatial resolution. The analysis of the original and smoothed data provided for the nearby galaxies IC 10 and IC 1613 shows that an insufficient spatial resolution cannot explain the fact that most of the regions with high σ are not related to the expanding shells. A more important fact is that the points with high σ, occupying the top left part of the  diagram, belong to the diffuse emission of low surface brightness and are spatially clustered around the star formation regions and on the periphery of the disc of ionized gas in the galaxies. Note that despite the low surface brightness, the S/N here is sufficient for reliable measurements of σ.
It seems that the observed distribution of points with a high velocity dispersion of ionized gas is not bound to specific shells, but rather to the integrated effect of young stellar groups feedback. Meanwhile, both the photoionization radiation of OB stars, and kinetic energy of the supernova explosions and winds of young stars lead to an increase of chaotic, turbulent velocities of ionized gas. At the same time, a less dense gas has a larger amplitude of velocities than the gas in denser clouds. The same input of energy in the low-density medium provides higher gas motion velocities due to the dependence of the shock wave velocity on the density of the surrounding gas. And we have to take into account that the gas, shock-heated by stellar winds and supernovae, is only partially confined and must be leaking out of the pores in the H ii shells (Lopez et al. 2011).
Given the above, to be able to interpret the observed  diagrams of dwarf galaxies, in addition to the thin shells considered by Muñoz-Tuñón et al. (1996), we have to bring in some more extended structures: the H ii regions, surrounded by the coronae of perturbed gas of low density, with low surface brightness in the Balmer emission lines. This is schematically shown in Fig. 6(a). When we look at the centres of bright H ii regions, there prevails a contribution of the inner regions both into Hα line intensity and into the velocity dispersion. On the periphery, however, we mainly observe high-velocity turbulent motions of the interstellar medium with low density and, consequently, with high velocity dispersion. The region of the diagram occupied by these points has a characteristic triangular shape because its right border is determined by the effect of declining observed velocity spread with increasing surface brightness.
It is clear that talking about density, we should bear in mind the total density of gas, including not only ionized but also the molecular and neutral species. First of all, because the main part of the gas in dwarf galaxies disc is in the H i state. Fig. 7 gives a comparison of the distributions of H i and H ii in several galaxies of our sample, for which Begum et al. (2008) and Oh et al. (2011) have published maps of the distribution of neutral hydrogen. It can be clearly seen that the bright H ii regions locate in places with high density of neutral hydrogen. Really, there are some small-scale deviations; in particular the peaks in the distribution of H i are often offset by a few hundred parsecs from the centres of current star formation. This effect is well known and associated both with the depletion of gas the stars form from, and with the mechanical impact of young stellar groups on the interstellar medium. See for example the discussions in Thuan, Hibbard & Lévrier (2004) and Simpson et al. (2011), where the H i maps for another galaxy from our sample, VII Zw 403, are presented. In some cases the bright shell structures, visible in the Hα, lie at the inner boundary of the ‘holes’ in the H i distribution, which is caused by the sweep-out and depletion of neutral gas (see examples in Lozinskaya et al. 2003; Begum et al. 2006). Note that now the idea of formation of giant neutral supershells by several generations of stars during hundreds of millions of years becomes generally accepted. In this case, local sites of star formation occur in the dense walls of giant H i supershells formed by multiple generations of stars (see McQuinn et al. 2010; Warren et al. 2011, and references therein).
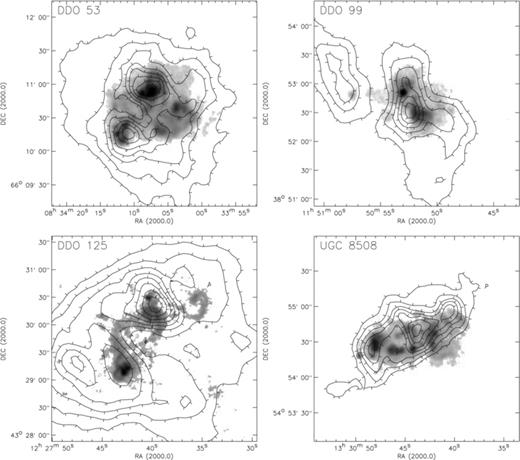
A comparison of surface brightness distributions in Hα (shades of grey) and H i density (contours). The data on the neutral hydrogen for DDO 53 are adopted from the THING survey (Oh et al. 2011), for the other of galaxies – from the FIGGS survey (Begum et al. 2008).
Therefore, a comparison of the H i distribution with our H ii maps confirms that the gas (including both neutral and ionized states) in the regions with high σ has a low surface (and hence volume) density. Thuan et al. (2004) explain the observed features of the distribution of surface density and H i dispersion velocity in dwarf galaxies within the supposition that the neutral component of the interstellar medium has two phases in an approximate pressure balance. A ‘cooler’ phase is characterized by a relatively small spatial scale, higher density and low velocity dispersion, while the diffuse ‘warm’ phase is distinguished by increased velocity dispersion. Such ideas on neutral gas are consistent with our explanation of the state of the ionized medium of dwarf galaxies. In this case, the ionized gas of low density, characterized by high-velocity turbulent motions, is a kind of an ‘energy reservoir’, maintaining a high velocity dispersion of the warm phase of H i. However, speaking about the pressure balance of different phases of gas, it should be borne in mind that the early ideas of the dominant role of thermal pressure are in fact simplistic views at the state of the interstellar medium, in which an important role is played by the turbulent pressure (Burkert 2006).
The question of what determines the velocity dispersion for the points of the ‘horizontal branch’ in the  diagram requires a further detailed consideration. This ‘branch’ corresponds to the bright H ii regions, for which
  . Muñoz-Tuñón et al. (1996) refer to these areas as the ‘kinematic core’, in agreement with the model proposed by Tenorio-Tagle, Muñoz-Tuñón & Cox (1993) to explain the nature of the supersonic turbulence of ionized gas in star-forming regions. These authors believe that the mean velocity dispersion of ionized gas in the ‘kinematic core’ is directly related to the virial motions, i.e. is approximately equal to the velocity dispersion of stellar population. The latter, in turn, is determined mainly by the mass and size of the star-forming regions. Later, this model was used by Melnick et al. (2000) to explain the physical nature of the correlation of mean gas velocity dispersion
  with the total luminosity in the Hβ line. It should however be noted that the model by Tenorio-Tagle et al. (1993) describes the evolution of isolated relaxed spheroidal stellar systems. It is hence not applicable to the behaviour of gas in an entire dwarf galaxy, the star formation regions of which are in the gravitational potential of the disc and the dark halo. An alternative view on the nature of the Hβ (or Hα) luminosity–
 correlation is given by the authors, arguing that the main contribution in the observed velocity dispersion of ionized gas in different types of galaxies is provided by the current star formation (Dib et al. 2006; Green et al. 2010). A detailed analysis of the nature of the ‘luminosity–ionized gas velocity dispersion’ correlation is considered in our next paper (Moiseev et al., in preparation).
Finally, note another interesting feature we detected on the  diagrams for the IC 1613 and UGC 8508 galaxies. These points are grouped in a horizontal lane with a relatively large velocity dispersion of σ > 30–50 km s−1. These points are very well detached from the other diagram areas and belong to the isolated remnants of supernova explosions or other expanding nebulae around the young massive objects, such as the Wolf–Rayet stars, ultra-bright X-ray sources and LBV stars (see Fig. 6). Therefore, the
  diagrams can also be used to search for unique and interesting objects in the emission galaxies.
6 CONCLUSION
Using a scanning Fabry–Perot interferometer mounted at the 6-m telescope of the SAO RAS, we have carried out the Hα line observations of seven nearby (D= 1.8–4.3 Mpc) irregular dwarf galaxies of the Local Volume. To study the features of the distribution of radial velocity dispersion over the discs of galaxies, characterizing the magnitude of chaotic turbulent motions of ionized gas, we used the  diagrams. A combination of these diagrams and 2D maps of radial velocity dispersion has allowed us to identify some common patterns, pointing to the relation between the magnitude of chaotic motions of gas and the ongoing processes of star formation.
Since the spatial resolution of these observations amounted to several tens of parsecs, we tested our results using the previously obtained high-resolution data for two galaxies of the Local Group, IC 10 and IC 1613, smoothed to the resolution of 40 pc. The main conclusions of our work are as follows.
There is a clear link between the surface brightness in the Hα line and the dispersion of line-of-sight velocities: with decreasing surface brightness the range of σ values is growing, the maximum velocity dispersion is always observed in the regions of low surface brightness.
In five galaxies (DDO 53, DDO 125, UGC 8508, UGCA 92 and VII Zw 403) we have identified expanding shells of ionized gas, sized 80–350 pc, formed as a result of collective action of stellar groups on the gaseous medium of galaxies. The characteristic kinematic age of the shells is 1–4 Myr, indicating a relation with current star formation.
We demonstrate that the
 diagrams may be useful for the search of supernova remnants or other compact expanding shells (nebulae around WR stars, etc.) in nearby galaxies. Based on
  diagnostic we have found an LBV candidate in the UGC 8508 galaxy.
The model, previously proposed by Muñoz-Tuñón et al. (1996) to explain the shapes of the I−σ diagram of individual star formation regions, requires substantial additions in the case of dwarf galaxies, where the spatial scales are substantially larger. The most important addition here is that most of regions with high velocity dispersion are not related to specific expanding shells, but rather belong to the diffuse low brightness emission, surrounding the star formation regions. We explain this behaviour of the observed σ distributions by the presence around H ii regions of the coronae of perturbed gas with low density and high turbulent velocities. This supposition is consistent with current knowledge of turbulence in the interstellar medium.
We hope that our results will be useful in the interpretation of the ionized gas velocity dispersion maps in dwarf galaxies. All the more so, since an increase in the number of such observations is expected in the coming years. We consider a direct comparison of velocity dispersion distributions for neutral and ionized hydrogen as a challenging here, although the difference in spatial resolution would present a certain problem.
We have made use of the NASA/IPAC Extragalactic Database (NED) which is operated by the Jet Propulsion Laboratory, California Institute of Technology, under the contract with the National Aeronautics and Space Administration. This work was supported by the Federal Target Programme Scientific and Scientific-Pedagogical Cadre of Innovative Russia (contract no. 14.740.11.0800) and by the Russian Foundation for Basic Research (project no. 10-02-00091). AVM is also grateful for the financial support of the ‘Dynasty’ Foundation. We thank Professor Jayaram Chengalur who provided us the digital maps of the FIGGS galaxies and an anonymous reviewer for constructive advice, which has helped us to improve the paper. Also, we thank Sergei Fabrika, Olga Sholukhova and Vera Arkhipova for their discussion on LBV candidate spectrum.
Funding for the SDSS has been provided by the Alfred P. Sloan Foundation, the Participating Institutions, the National Science Foundation, the U.S. Department of Energy, the National Aeronautics and Space Administration, the Japanese Monbukagakusho, the Max Planck Society and the Higher Education Funding Council for England. The SDSS website is http://www.sdss.org/.
The SDSS is managed by the Astrophysical Research Consortium (ARC) for the Participating Institutions. The Participating Institutions are The University of Chicago, Fermilab, the Institute for Advanced Study, the Japan Participation Group, The Johns Hopkins University, Los Alamos National Laboratory, the Max-Planck-Institute for Astronomy (MPIA), the Max-Planck-Institute for Astrophysics (MPA), New Mexico State University, University of Pittsburgh, Princeton University, the United States Naval Observatory and the University of Washington.
Footnotes
Note that the use of the approximation by the Voigt profile in our work allows making more accurate estimates of the expansion rate than the Gaussian approximation in Lozinskaya et al. (2006).
REFERENCES
Appendix
APPENDIX A: THE LBV CANDIDATE IN UGC 8508
After the first version of the paper was submitted we have performed new spectral observations of the emission knot with a double-horned Hα emission line profile in UGC 8508. On the Sloan Digital Sky Survey Data Release 8 (SDSS DR8) image which partly resolved the galaxy on individual stars, this knot corresponds to one of the brightest stars on the UGC 8508 periphery (Fig. A1, left). In SDSS DR8, it is named J133049.80+545419.2. The spectroscopic observations were carried out on 2012 February 20 at the 6-m telescope of the SAO RAS with the SCORPIO-2 (Afanasiev & Moiseev 2011) focal reducer working in the long-slit mode. We have collected 3000-s total exposure time with slit width of 1 arcsec under seeing conditions of 0.9 arcsec. The scale along the slit amounted to 0.35 arcsec pixel−1, the spectral resolution was about FWHM = 6.5 Å in the spectral range of 3800–8500 Å. The integrated spectrum of J133049.80+545419.2 is shown in Fig. A1 (right).
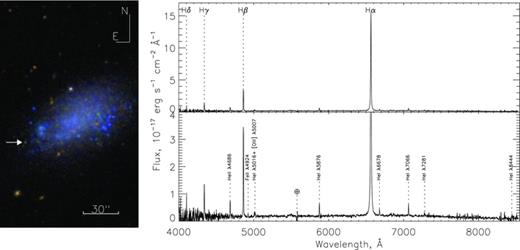
UGC 8508. Colour gri image provided by the SDSS DR8; arrow marks the LBV candidate J133049.80+545419.2 (left-hand panel). Right-hand panels show the spectra of this star in two intensity scales. The main emission lines are labelled. A colour version of this figure is available in the online version of this paper.
Unfortunately, the signal at the wavelength shorter than ∼4500 Å seems very noisy, since we used the CCD detector E2V 42-90 optimized for a ‘red’ spectral range. Nevertheless, the spectrum reveals a number of emission lines: strong hydrogen Balmer series with prominent He i and He ii lines and weak Fe ii lines are also detected. All these features are characteristic of an emission-line star, not of an H ii region or supernova remnant as we initially supposed from the FPI data. This star has a huge equivalent widths of the Balmer lines [ Å]; moreover, the Hα line profile reveals multicomponent structure with broad wings. We fitted this profile with three Gaussians having similar central velocities and with FWHM ≈ 80, 640 and 2030 km s−1 (the spectral resolution was taken into account). Recall that the narrower component has also double-peak structure according FPI observations with high spectral resolution (Section 3.5). The emission nebula around the star is very compact, with diameter smaller than 12–15 pc, because it was not spatially resolved in the long-slit data.
Based on these spectral properties we suppose that J133049.80+545419.2 is a massive star with strong stellar wind like LBVs. The observed spectrum is similar to some known LBV candidates, for example J013332.64+304127.2 in the M33 and J002020.35+591837.6 in the IC 10 galaxies (Massey et al. 2007). The SDSS DR8 photometric catalogue provides for J133049.80+545419.2 visible magnitudes g= 22.37 ± 0.13, r= 21.14 ± 0.06 and i= 20.63 ± 0.05 mag corresponding to absolute magnitudes Mg=−4.78, Mr=−6.01 and Mi=−6.52. The real luminosity of the star can be significantly larger, if the possible extinction in the circumstellar envelope is taken into account (the Galaxy interstellar extinction according NED is inessential in this direction –AV= 0.05). The strong Balmer decrement (IHα/IHβ= 7.2) can be connected with dust extinction as well as with shock origin of the emission line spectrum.
A discussion about the origin of this star lies outside the framework of our paper; new detailed observations are needed. However, the presented results provide a very good illustration of the power of the  diagram method that allows us to found a new LBV candidate outside the Local Group.
SUPPORTING INFORMATION
Additional Supporting Information may be found in the on-line version of this article:
Figure 1. Results of observations with the FPI for each galaxy.
Please note: Wiley-Blackwell are not responsible for the content or functionality of any supporting materials supplied by the authors. Any queries (other than missing material) should be directed to the corresponding author for the article.
Author notes
Based on observations obtained with the 6-m telescope of the Special Astrophysical Observatory of the Russian Academy of Sciences. The observations were carried out with the financial support of the Ministry of Education and Science of Russian Federation (contracts no. 16.518.11.7073 and 16.552.11.7028).
