


Abstract
We present results from a suite of axisymmetric, core-collapse supernova simulations in which hydrodynamic recoil from an asymmetric explosion produces large protoneutron star (PNS) velocities. We use the adaptive mesh refinement code castro to self-consistently follow core collapse, the formation of the PNS and its subsequent acceleration. We obtain recoil velocities of up to 620 km s−1 at ∼1 s after bounce. These velocities are consistent with the observed distribution of pulsar kicks and with PNS velocities obtained in other theoretical calculations. Our PNSs are still accelerating at several hundred km s−1 at the end of our calculations, suggesting that even the highest velocity pulsars may be explained by hydrodynamic recoil in generic, core-collapse supernovae.
1 INTRODUCTION
At birth, pulsars achieve velocities well above those of their progenitor population (Gunn & Ostriker 1970; Lyne & Lorimer 1994). These pulsar ‘kicks’ typically range from 200 to 400 km s−1, with the fastest neutron stars achieving velocities near, or in excess of, 1000 km s−1 (Lyne & Lorimer 1994; Chatterjee et al. 2005; Hobbs et al. 2005). The current distribution of observed pulsar velocities is Maxwellian, hinting at a common acceleration mechanism (Hansen & Phinney 1997; Hobbs et al. 2005; Zou et al. 2005; Faucher-Giguère & Kaspi 2006).
Many scenarios have been proposed for the origin of pulsar recoil and neutron star kicks. Popular mechanisms often require strongly magnetized systems, exotic neutrino physics and/or rapid rotation to produce substantial kicks. For example, in the presence of strong magnetic fields, neutrino–matter interactions can generate neutron star velocities of the order of a few hundred km s−1 by producing ∼1 per cent dipole asymmetries (Lai & Qian 1998; Kusenko & Segrè 1999; Lai, Chernoff & Cordes 2001; Nardi & Zuluaga 2001; Fuller et al. 2003; Barkovich, D’Olivo & Montemayor 2004; Lambiase 2005; Kishimoto 2011). Many of these scenarios require magnetic fields in the magnetar range (i.e. 1014–1016 G) and may not produce substantial kicks in typical core-collapse supernovae. Other scenarios involve jet/counterjet misalignment launched near the protoneutron star (PNS). In such situations, the jets accompany an associated gamma-ray burst or form through magnetorotational processes during core collapse (Cen 1998; Khokhlov et al. 1999; Sawai, Kotake & Yamada 2008; Papish & Soker 2011). These scenarios require rapid rotation and therefore may only manifest in a small subset of core-collapse events.
If neutron star kicks are a generic outcome of core collapse, then a natural explanation is recoil during an asymmetric supernova explosion. In the current, most sophisticated simulations, the bounce shock, launched when the equation of state stiffens at nuclear densities, stalls due to thermal energy losses from neutrino emission and dissociation of nuclei into nucleons. The stalled shock itself is subject to hydrodynamic and neutrino-driven instabilities, which manifest as prominent low-order ℓ-mode oscillations in axisymmetric simulations of non-rotating progenitors (Blondin, Mezzacappa & DeMarino 2003; Scheck et al. 2004; Buras et al. 2006; Scheck et al. 2006; Blondin & Mezzacappa 2007; Burrows et al. 2007a; Ott et al. 2008; Fernández & Thompson 2009; Fernández 2010; Nordhaus et al. 2010a,b; Brandt et al. 2011). At the onset of shock revival, the PNS may recoil if large-scale asymmetries are present during the ensuing supernova explosion. While the mechanism by which core-collapse supernova progenitors explode is not fully understood, the most probable scenario involves absorption of neutrinos in the post-shock ‘gain region’ (Bethe & Wilson 1985) and likely requires the development of multidimensional instabilities in fully 3D radiation-hydrodynamics simulations to succeed (Nordhaus et al. 2010b). Nonetheless, recoil from an asymmetric neutrino-driven explosion presents a natural mechanism by which PNSs achieve high velocities (Burrows & Hayes 1996; Scheck et al. 2004, 2006; Nordhaus et al. 2010a; Wongwathanarat, Janka & Müller 2010) and appears to be supported by recent X-ray observations of the Cassiopeia A supernova remnant (Hwang & Laming 2012).
Computational studies of recoil require multidimensional, radiation-hydrodynamics calculations which start at the onset of collapse and follow the dynamics self-consistently. This includes the formation of the PNS, the explosion, the propagation of the shock front through the stellar envelope and eventually decoupling of the PNS from the surrounding material. Such an approach is computationally challenging and as such various techniques have been adopted to make the computations tractable. One popular approach is to commence the calculations after bounce by mapping spherically symmetric solutions on to a multidimensional grid and excising the PNS from the computational domain (Scheck et al. 2004, 2006; Wongwathanarat et al. 2010). This requires one to infer a PNS kick through a rigid, impenetrable inner boundary, but allows one to track the supernova explosion for several seconds and to distances greater than 10 000 km. While this approach is appealing, it must be checked by simulations which include the PNS in the computational domain.
Recently, we have carried out the first axisymmetric, radiation-hydrodynamics simulation of recoil with the multigroup, arbitrary Lagrangian–Eulerian (ALE) code vulcan/2d (Nordhaus et al. 2010a). By transitioning from a spherical polar mesh to a pseudo-Cartesian mesh at the centre of the domain, we self-consistently tracked the PNS’s formation and off-centre motion. This calculation was computationally expensive, as it employed multigroup flux-limited diffusion neutrino transport and followed the supernova explosion until the shock reached the 5000 km radial outer boundary of the domain. At that time, the PNS had reached a velocity of ∼150 km s−1 but had yet to fully decouple from the ejecta. The PNS recoil was due almost entirely to hydrodynamical processes and was consistent with previous excised-core calculations (Scheck et al. 2004, 2006). Asymmetric neutrino emission contributed ∼2 per cent to the overall kick magnitude. This suggests that neutrinos play no significant role in accelerating neutron stars to high velocities during typical core-collapse supernovae. At the end of the calculation, significant acceleration (∼350 km s−2), in addition to the degree of asymmetry in the ejecta, suggested that higher PNS velocities were possible. Verifying these estimates requires tracking the supernova shock to greater radial distances and later times.
To expand upon the work of Nordhaus et al. (2010a), we carry out a suite of axisymmetric collapse calculations with the adaptive mesh refinement (AMR), radiation-hydrodynamics code castro (Almgren et al. 2010; Zhang et al. 2011). By employing AMR and a simplified form of transport (see Section 2), we expand the domain to a radial distance of 10 000 km and perform multiple calculations. Our PNSs achieve recoil velocities ranging from tens of km s−1 up to ∼620 km s−1. In general, the magnitude of the recoil depends on the degree of asymmetry at the time of explosion and the energy of the explosion itself (Burrows et al. 2007b). In Section 3, we discuss the physical processes that accelerate the PNS. In Section 4, we compare our results with previous work before concluding and discussing future work in Section 5.
2 COMPUTATIONAL METHODOLOGY
 and
and  . We solve the fully compressible equations of hydrodynamics:
 , where e represents the internal energy. Neutrino heating and cooling occur via the superallowed charged-current reactions involving free nucleons, electrons, protons, electron neutrinos and anti-electron neutrinos. We use the heating and cooling rates derived in Janka (2001) and previously used by Murphy & Burrows (2008) and Nordhaus et al. (2010b). These rates, assuming the electron and anti-electron neutrino luminosities,
  and
and  , to be equal, are
 is the electron neutrino temperature, r is the distance from the centre of the star, Yn and Yp are the neutron and proton fractions, and τeff is an effective optical depth for electron and anti-electron neutrinos (see equations 6 and 7 of Hanke et al. 2011). The factor
  effects a transition between the dense inner regions, where neutrinos are trapped and heating and cooling are suppressed, to the outer, optically thin regions. To avoid the prohibitive cost of global calculations, we fit τeff as a function of density by post-processing models and applying equation (6) of Hanke et al. (2011). In the transition region, 10−2≲τeff≲ 1, the resulting power-law fits give root-mean-square residuals of ∼10 per cent in
  . Note also that the bulk of neutrino heating occurs within the inner few hundred kilometres and falls off rapidly with radial distance. The electron fraction, Ye, evolves on infall via a density prescription given in Liebendörfer et al. (2005) and previously employed by Murphy & Burrows (2008) and Nordhaus et al. (2010b). To close the equations, we use the sophisticated, finite-temperature, nuclear equation of state of Shen et al. (1998).
The current theoretical consensus holds that most 2D core-collapse simulations do not produce neutrino-induced explosions for the majority of progenitors without supplementing the neutrino luminosity (Burrows et al. 2007b; Ott et al. 2008; Nordhaus et al. 2010a; Brandt et al. 2011; Fujimoto et al. 2011). However, explosions in axisymmetric simulations have been obtained after ∼600 ms for a 15 M⊙ progenitor when a soft nuclear equation of state and variable Eddington factor closure technique are employed (Marek & Janka 2009). We therefore induce explosions by varying the neutrino driving luminosity  (
( ) from 2.1 to 2.5 × 1052 erg s−1. These values are comparable to the time-dependent values achieved in 2D calculations with detailed neutrino transport (Ott et al. 2008; Brandt et al. 2011). Our simplified transport scheme couples this energy somewhat more efficiently to the post-shock region, and our results should be checked by future studies that employ sophisticated, but computationally expensive, neutrino transport. We hold the driving luminosity
  fixed in each calculation, but vary it from run to run. Our simplified transport method, in conjunction with AMR, allows us to follow collapse, the formation of the PNS, and any subsequent acceleration due to the supernova explosion.
We use the 15 M⊙, red-supergiant, non-rotating, solar-metallicity progenitor of Woosley & Weaver (1995). Our simulations begin at the onset of core collapse, continue through the formation of the PNS and the launching, stalling and revival of the bounce shock, and end when the shock approaches the edge of the computational domain. We employ a 2D,  domain discretized with a uniform coarse grid of 64 × 128 cells covering the full 180° range in polar angle. Within 200 km of the PNS, we use four AMR levels, each increasing the resolution by a factor of 4, giving a minimum cell size of ∼0.3 km. Exterior to 200 km, the adaptive mesh tracks the high-entropy, shocked material.
We index our eight simulations by their driving electron neutrino luminosity  in units of 1052 erg s−1, from L2.1 to L2.5. For each simulation, we follow the explosion for ∼1 s of post-bounce evolution. For all but the L2.1 model, the calculation ends when the shock approaches the edge of the computational domain, 10 000 km from the PNS. At this point, the total momentum on the grid is conserved to within ∼1 per cent of the core’s final value.
3 ACCELERATION OF THE PNS
The hydrodynamic flow behind the stalled shock is turbulent, and is soon deformed by the development of low-mode hydrodynamic and neutrino-driven instabilities (Burrows, Hayes & Fryxell 1995; Blondin et al. 2003; Scheck et al. 2004, 2006; Blondin & Mezzacappa 2007; Fernández 2010). This guarantees an asymmetric distribution of material when neutrino heating revives the stalled shock. The ensuing asymmetric explosion accelerates the PNS as the shock propagates through the stellar envelope.
To understand the physical processes governing the recoil, we first present the PNS velocities obtained in our simulations. We compute the core positions as the centroids of the density distributions and differentiate to obtain the velocities, which we show as functions of time in Fig. 1. The subscript in each simulation label indicates the driving  in units of 1052 erg s−1. The value of the driving
  is taken to be the same, thus yielding a total driving luminosity in each simulation of
  . We obtain PNS velocities ranging from tens to many hundreds of km s−1. The highest velocity PNS (solid red curve in Fig. 1) reaches a speed of 624 km s−1 after ∼800 ms of post-bounce evolution, and is still accelerating at ∼1000 km s−2.


Fig. 2 depicts the evolution of a representative run (model L2.4). The left-hand column presents the evolution of electron fraction, Ye, over the inner ∼200 km, as the explosion progresses. The middle of the computational domain is marked by a black line (Z= 0). The PNS is clearly visible as the deleptonized blue region, which begins at Z= 0 and moves off-centre. The right-hand column shows the global evolution of the anisotropic supernova shock, with the colour map depicting entropy. The explosion occurs primarily in the −Z direction while the PNS recoils in the +Z direction. By ∼800 ms after bounce, the PNS has largely decoupled from its surroundings. The middle column shows the density distribution with the shock outlined in pink. A high-density region above the PNS combines with a low-density region below it to gravitationally accelerate the PNS in the +Z direction.
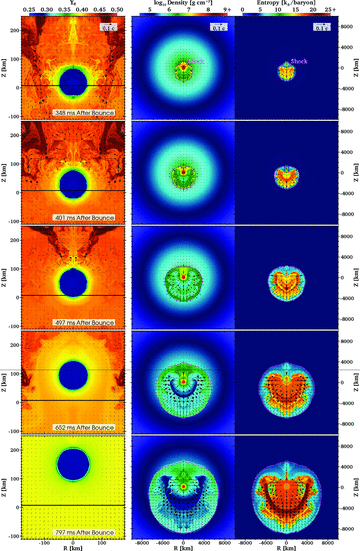
The left-hand column shows the evolution of the inner ∼200 km of the simulation domain for model L2.4. The colour map depicts the electron fraction, Ye, with velocity vectors overlaid; the black lines indicate Z= 0. The colour map for the middle column depicts density. The pink curve shows the location of the shock. Exterior to the shock, the flow is radially inward. The right-hand column panels show the entropy evolution of the explosion. The steep entropy jump just interior to the shock depicts the region where nucleons are re-associated into nuclei and α particles. At 707 ms after bounce, the PNS wind is seen as the dark blue region interior to the shock in the middle panel. The supernova explosion primarily occurs in the −Z direction, while the PNS recoils in the +Z direction. At ∼800 ms after bounce, the PNS has largely decoupled from the surrounding material, but is still being accelerated by the gravitational pull of slow-moving ejecta in the +Z direction (see Fig. 3).
3.1 Physics of the recoil
The three terms in equation (4) represent the contributions to the acceleration from the gravitational field of matter exterior to rc, anisotropic gas pressure and momentum flux through rc, respectively. The first term assumes a spherically symmetric matter distribution interior to rc, which in practice is an excellent approximation. In the limit of an isotropic explosion, no acceleration occurs and each term vanishes individually.
Equation (4) includes contributions from hydrodynamic processes, but neglects radiation pressure asymmetries, which are not captured by our heating and cooling prescription (equations 2 and 3). In our previous calculations, which performed radiative transfer using multigroup flux-limited diffusion, neutrino momentum contributed ≲2 per cent of the overall kick (Nordhaus et al. 2010a). This is consistent with previous studies that found neutrino radiation pressure to contribute ∼5 per cent to the final kick velocity (Scheck et al. 2004, 2006).
The relative contributions of the terms in equation (4) depend on the properties of the flow and the explosion dynamics. As a consequence of the explosion, the PNS generically recoils away from the high-velocity ejecta and towards the lower velocity ejecta. However, the interpretation of the kick is not as straightforward as equation (4) would suggest. As discussed in section III of Nordhaus et al. (2010a), pressure and gravity do work on fluid elements; anisotropic pressure or gravitational forces at a small value of rc will appear as anisotropic momentum flux at a larger value of rc.
Using a fiducial radius of rc= 200 km and integrating equation (4) from core bounce, Fig. 3 shows the decomposition of the PNS kick into three components for models L2.25 (top panel), L2.3 (middle panel) and L2.4 (bottom panel). Note that the velocities have been reflected for model L2.3. In each panel, the dot–dashed black curve represents the smoothed centroid velocity, while the solid red curve is the sum of the three terms in equation (4). The gravitational component (short-dashed green curve) dominates the late-time evolution in all three simulations. The anisotropic pressure term (dot–dashed pink curve) flattens towards the end of each run as the PNS decouples from the ejecta.
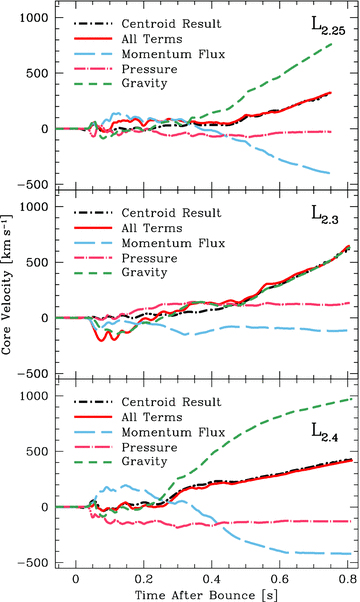
Decomposed PNS kick velocities for models L2.25 (top panel), L2.3 (middle panel) and L2.4 (bottom panel), obtained by integrating equation (4) from bounce. We have inverted the velocities for the L2.3 run. The dot–dashed black curve depicts the PNS velocity computed using the centroid of the density, while the solid red curve shows the contributions to the kick from momentum flux (long-dashed blue curve), gravity (dashed green curve) and pressure (dot–dashed pink curve). In each run, the PNS is still accelerating at more than 500 km s−2 at the end of the calculation, and this acceleration is dominated by the gravitational term.
Model L2.3 achieved the highest kick velocity in our suite of simulations, more than 620 km s−1 at ∼800 ms after bounce. The middle panel of Fig. 3 shows its velocity evolution, decomposed using equation (4) and inverted to facilitate comparison with models L2.25 and L2.4. Anisotropic pressure and momentum flux (dot–dashed pink and long-dashed blue lines, respectively) contributed almost nothing to the kick after ∼400 ms from core bounce. Driven by the gravitational term in equation (4), this model was still accelerating at more than 1000 km s−2 when the shock reached the edge of the computational domain.
While they did not achieve as large a PNS velocity as L2.3, models L2.25 and L2.4 were still accelerating at ∼1000 and ∼600 km s−2, respectively, at the end of our calculations. In both cases, and particularly for the L2.4 model, this acceleration was dominated by the gravitational term in equation (4). Fig. 2 clearly shows the PNS and ejecta in model L2.4 decoupling at ∼650 ms after bounce (second panel from bottom), and having almost completely decoupled by ∼800 ms after bounce.
The three models presented here comprise a representative sample of our simulation results. Table 1 presents additional information on each of our runs, including the velocity, the explosion energy Eexp and α, a dimensionless measure of the degree of asymmetry, at the end of the calculations. The parameters α and Eexp are defined by equations (5) and (6) in the following section. All of our calculations, except for L2.1, ended when the shock approached a radius of 10 000 km; model L2.1 ended with Rshock= 3300 km. For a detailed discussion of the limitations of our approach, the effect of fixing the neutrino luminosities and the reliability of the late-time acceleration and explosion energies see Section 3.3.
| Model | vPNS (km s−1) | Eexp (1051 erg) | α |
| L2.1 | −40 | 0.29 | 0.026 |
| L2.15 | 212 | 0.69 | −0.25 |
| L2.2 | −186 | 0.89 | 0.08 |
| L2.25 | 315 | 0.69 | −0.23 |
| L2.3 | −624 | 1.13 | 0.23 |
| L2.35 | 194 | 1.28 | −0.06 |
| L2.4 | 431 | 1.23 | −0.15 |
| L2.5 | 276 | 0.99 | −0.10 |
| Model | vPNS (km s−1) | Eexp (1051 erg) | α |
| L2.1 | −40 | 0.29 | 0.026 |
| L2.15 | 212 | 0.69 | −0.25 |
| L2.2 | −186 | 0.89 | 0.08 |
| L2.25 | 315 | 0.69 | −0.23 |
| L2.3 | −624 | 1.13 | 0.23 |
| L2.35 | 194 | 1.28 | −0.06 |
| L2.4 | 431 | 1.23 | −0.15 |
| L2.5 | 276 | 0.99 | −0.10 |
| Model | vPNS (km s−1) | Eexp (1051 erg) | α |
| L2.1 | −40 | 0.29 | 0.026 |
| L2.15 | 212 | 0.69 | −0.25 |
| L2.2 | −186 | 0.89 | 0.08 |
| L2.25 | 315 | 0.69 | −0.23 |
| L2.3 | −624 | 1.13 | 0.23 |
| L2.35 | 194 | 1.28 | −0.06 |
| L2.4 | 431 | 1.23 | −0.15 |
| L2.5 | 276 | 0.99 | −0.10 |
| Model | vPNS (km s−1) | Eexp (1051 erg) | α |
| L2.1 | −40 | 0.29 | 0.026 |
| L2.15 | 212 | 0.69 | −0.25 |
| L2.2 | −186 | 0.89 | 0.08 |
| L2.25 | 315 | 0.69 | −0.23 |
| L2.3 | −624 | 1.13 | 0.23 |
| L2.35 | 194 | 1.28 | −0.06 |
| L2.4 | 431 | 1.23 | −0.15 |
| L2.5 | 276 | 0.99 | −0.10 |
3.2 Asymmetries in the ejecta and explosion energies

Fig. 4 shows the evolution of α for models L2.4 (solid blue curve) and L2.5 (dashed blue curve). The solid red and dashed red curves depict the PNS recoil velocities for the L2.4 and L2.5 models, respectively. Our suite of simulations produced final values of α between −0.25 and 0.25 (see Table 1). Since momentum is conserved, larger values of α lead to larger PNS recoil velocities.
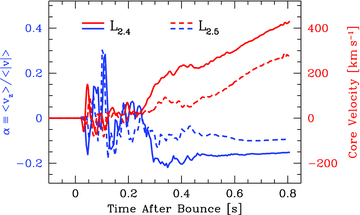
The blue curves show the evolution of α (equation 5) for models L2.4 (solid) and L2.5 (dashed), while the red curves show the core recoil velocity as a function of time. The core velocity is always opposite to the ejecta asymmetry due to conservation of momentum.
Fig. 6 shows the position of the shock at the end of the calculation for five of our models; models with a negative kick have been reflected. While the shock asymmetry does correlate with the kick velocity, the magnitude of the kick depends on the distribution of matter behind the shock, which we parametrize using α.
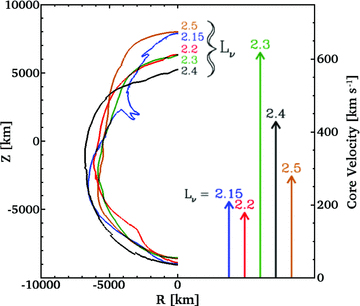
The position of the outer edge of the gain region toward the end of the calculations. Runs with negative PNS velocity have been reflected in this plot. The arrows depict the core velocity for each run (right axis).
The internal energy of shocked material will ultimately be converted into kinetic energy by p d V work. In this limit, the PNS kick will be a function of the anisotropy of the ejecta and Eexp. While the explosion will be nearly spherical in the outer envelope, the anisotropy in the inner mass shells should freeze out at values close to those indicated in Table 1. This anisotropy in the inner ejecta velocities, with the bulk of the ejecta travelling opposite to the recoiling PNS, should be observable in the supernova remnant and is a specific prediction of our model.
Fig. 5 shows the total explosion energy (solid blue curve) as a function of time for model L2.4. The explosion energy of material in the bottom half of the computational grid (Z < 0) is depicted by the dot–dashed green curve, while the explosion energy of material in the top half of the computational grid (Z > 0) is depicted by the dashed red curve. Consistent with Fig. 2, this demonstrates that model L2.4 explodes primarily in the −Z direction. The bottom panel of Fig. 5 shows the PNS mass as a function of time (solid blue curve) and the total mass of shocked, bound material exterior to the core (dot–dashed red curve). By the end of model L2.4, the PNS mass is 1.45 M⊙ while there is little shocked, bound matter outside the PNS itself.
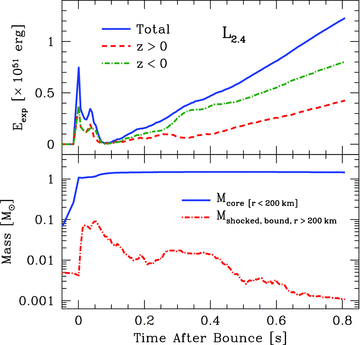
The top panel shows the explosion energy (equation 6) as a function of time for model L2.4. The solid blue curve depicts the total explosion energy. The explosion energy of material with Z < 0 is shown by the dot–dashed green curve, while the explosion energy of material with Z > 0 is shown by the dashed red curve. The bottom panel presents the PNS mass (solid blue curve) as a function of time; its final value is 1.45 M⊙. The dot–dashed red curve in the bottom panel shows the total shocked, bound mass exterior to the core as a function of time. At the end of the simulation, only ∼10−3 M⊙ of shocked material outside the PNS remains bound.
3.3 Late-time evolution
Our simplified transport scheme allows us to perform multiple calculations of the inner regions of a core-collapse supernova. To date, only one time-dependent, multigroup, flux-limited diffusion, neutrino transport kick calculation, which includes the PNS on the computational grid, exists in the literature (Nordhaus et al. 2010a). As computational methods and resources improve, it will become possible to self-consistently connect the PNS kick with the large-scale properties of the ejecta. In this section, we discuss the late-time evolution of our simulations and some of the limitations of our approach.
As previously mentioned, the magnitude of the PNS kick will increase with the degree of asymmetry in the ejecta and the explosion energy of the supernova. At the end of our calculations, the shocked matter’s internal energy exceeds its kinetic energy by a factor of ∼3–5. Adiabatic expansion will convert this internal energy into kinetic energy as the shock propagates through the stellar envelope.
Our constant driving  also deposits energy into the expanding ejecta, both by neutrino absorption in the gain region and by driving a ∼0.1 M⊙ s−1 wind from the surface of the PNS. This late-time wind contributes ∼50 per cent of the explosion energy at the end of each simulation and typically contains ∼0.05 M⊙ of material. While neutrino-driven winds from the PNS are expected (Burrows et al. 1995), future improvements to this work should include more sophisticated transport approaches which naturally incorporate time-variable neutrino luminosities.
We tested the effect of decaying neutrino driving luminosities by restarting model L2.3 400 ms after bounce with an exponentially decreasing driving luminosity. We used an exponential decay time-scale of 1 s, giving a ∼35 per cent reduction in  at the end of our calculation. As a result of the lower energy injection rate, the late-time PNS wind decreased by nearly a factor of 2, the PNS took longer to decouple from the post-shock material and the final PNS velocity was ∼25 per cent lower. Still, the PNS was accelerating gravitationally at ∼1000 km s−1, nearly as fast as in the model with a constant driving luminosity.
We also note that our calculations end when the shock reaches a fixed radius of ∼10 000 km, rather than after a fixed amount of post-bounce time. The total amount of energy injected into our models thus varies widely, making it difficult to connect the derived explosion energies with our observed kick velocities.
4 COMPARISON WITH PREVIOUS NUMERICAL WORK
Previous computational studies of pulsar recoil have employed various simplifications and approximations to make the calculations tractable. These approaches include excising the PNS from the computational domain, starting the calculations ∼20 ms after bounce and employing simplified neutrino transport schemes (Scheck et al. 2004, 2006; Wongwathanarat et al. 2010). The exclusion of the PNS from the domain is particularly useful, as it avoids the severe Courant limitation imposed by resolving the PNS. The PNS is replaced by a rigid, spherical boundary, which contracts according to a prescription from a detailed spherically symmetric collapse calculation. This approach is designed to mimic the settling of material as the PNS cools.
By using all three of these simplifications, previous studies have been able to track the shock to large distances (>104 km) and late times (>1 s) (Scheck et al. 2004, 2006; Wongwathanarat et al. 2010). While useful for calculating long-term evolution, this approach requires inferring recoil through a rigid boundary of infinite inertial mass. Furthermore, this approach neglects effects resulting from the displacement of the PNS relative to the surrounding matter. To compensate for this effect, these authors have added a kick to the gas which mimics the movement of the PNS. The physical fidelity of such approximations has been verified by self-consistent calculations such as those presented in Nordhaus et al. (2010a) and in this work.
Recently, Nordhaus et al. (2010a) presented the first axisymmetric, multigroup, flux-limited diffusion neutrino transport calculation of recoil in which core collapse leads to significant acceleration of a fully formed PNS. The authors used the multigroup, ALE, radiation-hydrodynamics code vulcan/2d (Livne 1993). The calculation employed multigroup flux-limited diffusion neutrino transport (Livne et al. 2004), supplemented the neutrino luminosity by an additional  erg s−1, and used the same 15 M⊙ progenitor as this work. During the induced, neutrino-driven explosion, a ∼10 per cent anisotropy in the ejecta led to a PNS recoil velocity of ∼150 km s−1 at the end of the calculation, when the shock reached a radius of ∼5000 km. Such a result in terms of PNS velocity and ejecta asymmetry compares favourably with model L2.2 presented in this work (see Table 1) and the results of Scheck et al. (2006).
In general, given the different computational techniques and the use of three different codes, the agreement between our results and those of Scheck et al. and Nordhaus et al. (2010a) is gratifying. Our detailed calculations of the first second of post-bounce evolution produce high-velocity recoils comparable with those in Scheck et al. (2004, 2006) and Nordhaus et al. (2010a) while following the evolution of the PNS itself. Taken together, these studies strongly suggest that asymmetric core-collapse supernovae naturally lead to acceleration of the PNS and are capable of birthing the highest velocity pulsars.
While axisymmetry would restrict core motion to the Z-axis, 3D computations impose no such constraint and allow one to measure the PNS spin in addition to recoil. Recently, Wongwathanarat et al. (2010) presented the first 3D excised-core calculations of recoil. High PNS velocities were achieved for rotating and non-rotating progenitors, providing further evidence that PNSs are naturally accelerated during core collapse. However, in the case of pulsar spins, Rantsiou et al. (2011) showed that excising the PNS from the computational domain can lead to qualitatively different results in the spin rates. As such, future 3D calculations which include the PNS should be performed and differences between kicks from different progenitor models (rotating and non-rotating) should be investigated.
5 CONCLUSIONS
We have carried out a suite of axisymmetric simulations of the collapse of a massive star’s core with the AMR, radiation-hydrodynamics code castro. For each calculation, we follow the core-collapse, PNS formation, ensuing neutrino-driven supernova explosion and PNS recoil. By incorporating the effects of neutrino heating and cooling in place of more detailed and computationally expensive neutrino transport, we are able to perform multiple calculations that simultaneously follow the evolution of the PNS and the global explosion for ∼1 s and to distances of ∼10 000 km.
The PNSs in our simulations achieved recoil velocities comparable to those of the observed pulsars. After ∼1 s of post-bounce evolution, the highest PNS velocity obtained was 620 km s−1 (model L2.3). After ∼0.6 s of post-bounce evolution, this acceleration was supplied primarily by the gravitational pull of slow-moving ejecta in front of the PNS. This gravitational effect dominates the late-time PNS acceleration in all of our calculations. While our PNSs have started to decouple from the surrounding fluid (see Fig. 3), the substantial and ongoing gravitational acceleration suggests that higher velocities may ultimately be achievable.
Our results suggest that hydrodynamic recoil during an asymmetric supernova explosion provides a natural explanation for pulsar kicks. After the bounce shock stalls, hydrodynamic instabilities deform the shocked material and ensure that the ensuing explosion is asymmetric. Recoil during the supernova explosion and gravitational interaction with the expanding ejecta subsequently accelerate the PNS to high velocities. The results presented in this work are consistent with the findings of Nordhaus et al. (2010a) and previous axisymmetric simulations that excised the PNS from the computational domain (Scheck et al. 2004, 2006). Taken together, these studies strongly suggest that generic core-collapse supernovae can accelerate neutron stars to the high velocities observed in the pulsar population. Additionally, these studies demonstrate that hydrodynamic processes, and not asymmetric neutrino emission, are responsible for this acceleration (Scheck et al. 2006; Burrows et al. 2007b; Nordhaus et al. 2010a). In fact, recent simulations of neutron star kicks in three dimensions suggest that velocities comparable to those from axisymmetric calculations are achievable (Wongwathanarat et al. 2010).
In this work, we have provided substantial numerical support to the hydrodynamic mechanism of pulsar kicks. Recoil due to a neutrino-driven, core-collapse supernova explosion provides a natural explanation for pulsar kicks without appealing to more exotic scenarios. As computational methods and resources improve, self-consistent 3D studies will enable a full comparison of theoretical models to observed distributions of pulsar kicks and spins.
The authors thank Noam Soker, Thomas Janka, Annop Wongwathanarat and Ewald Mueller for comments which lead to an improved manuscript. JN is supported by an NSF Astronomy and Astrophysics Postdoctoral Fellowship under award AST-1102738 and by NASA HST grant AR-12146.04-A. TDB is supported by an NSF Graduate Research Fellowship under grant number DGE-0646086. AB is supported by the Scientific Discovery through Advanced Computing (SciDAC) program of the DOE, under grant DE-FG02-08ER41544, the NSF under the subaward ND201387 to the Joint Institute for Nuclear Astrophysics (JINA, NSF PHY-0822648), and the NSF PetaApps program, under award OCI-0905046 via a subaward 44592 from Louisiana State University to Princeton University. Work at LBNL was supported in part by the SciDAC program under contract DE-FC02-06ER41438. AA is supported by the Office of High Energy Physics and the Office of Mathematics, Information, and Computational Sciences as part of the SciDAC program under the US Department of Energy under contract no. DE-AC02-05CH11231. The authors thank the members of the Center for Computational Sciences and Engineering (CCSE) at LBNL for their invaluable support for castro.
Support for HPC storage and resources was provided by the National Energy Research Scientific Computing Center (NERSC), which is supported by the Office of Science of the US Department of Energy under contract DE-AC03-76SF00098, by NICS, on the Kraken supercomputer, provided by the National Science Foundation through the TeraGrid Advanced Support Program under grant TG-AST100001; by the TIGRESS High Performance Computing and Visualization Center at Princeton University, which is jointly supported by the Princeton Institute for Computational Science and Engineering (PICSciE) and the Princeton University Office of Information Technology.
REFERENCES
Author notes
NSF Astronomy and Astrophysics Postdoctoral Fellow.
