


Abstract
Recent observations have constrained the galaxy ultraviolet (UV) luminosity function up to z∼ 10. However, these observations alone allow for a wide range of reionization scenarios due to uncertainties in the abundance of faint galaxies and the escape fraction of ionizing photons. We show that requiring continuity with post-reionization (z < 6) measurements, where the Lyα forest provides a complete probe of the cosmological emissivity of ionizing photons, significantly reduces the permitted parameter space. Models that are simultaneously consistent with the measured UV luminosity function, the Thomson optical depth to the microwave background and the Lyα forest data require either (1) extrapolation of the galaxy luminosity function down to very faint UV magnitudes Mlim∼−10, corresponding roughly to the UV background suppression scale; (2) an increase of the escape fraction by a factor ≳10 from z= 4 (where the best fit is 4 per cent) to 9; or (3) more likely, a hybrid solution in which undetected galaxies contribute significantly and the escape fraction increases more modestly. Models in which star formation is strongly suppressed in low-mass, reionization-epoch haloes of mass up to Mh∼ 1010 M⊙ (e.g. owing to a metallicity dependence) are only allowed for extreme assumptions for the redshift evolution of the escape fraction. However, variants of such models in which the suppression mass is reduced (e.g. assuming an earlier or higher metallicity floor) are in better agreement with the data. Interestingly, concordance scenarios satisfying the available data predict a consistent redshift of 50 per cent ionized fraction zreion(50 per cent) ∼ 10. On the other hand, the duration of reionization is sensitive to the relative contribution of bright versus faint galaxies, with scenarios dominated by faint galaxies predicting a more extended reionization event. Scenarios relying too heavily on high-redshift dwarfs are disfavoured by kinetic Sunyaev–Zeldovich measurements, which prefer a short reionization history.
1 INTRODUCTION
The installation of the Wide Field Camera 3 (WFC-3) on the Hubble Space Telescope (HST) has recently improved the efficiency of searches for faint z≳ 7 galaxies by more than an order of magnitude (e.g. Bouwens et al. 2010a; Bunker et al. 2010; McLure et al. 2010). As a result, deep WFC-3 observations have provided new measurements of the rest-frame ultraviolet (UV, ∼1500 Å) galaxy luminosity function (LF) at these redshifts. These measurements are particularly important since galaxies are the most likely sources of hydrogen reionization (e.g. Madau et al. 1999; Faucher-Giguère et al. 2008a,b). Nevertheless, it is difficult to robustly translate these measurements into predictions of the reionization history, because of significant uncertainties in the spectral energy distribution (SED) of the galaxies, the fraction of ionizing photons that escape into the intergalactic medium (IGM) and in the contribution of fainter, as of yet undetected galaxies.
Because of these uncertainties, it has been unclear whether star-forming galaxies can actually reionize the Universe by z∼ 6 (as required by the transmission of the Lyα forest at lower redshifts; Fan et al. 2002; Becker, Rauch & Sargent 2007, also see McGreer, Mesinger & Fan 2011) and account for the Thomson scattering optical depth to the microwave background implied by the latest 7-yr Wilkinson Microwave Anisotropy Probe analysis (WMAP-7; Komatsu et al. 2011), corresponding to a redshift of instantaneous reionization zreion= 10.4 ± 1.2.1 Even if galaxies are in fact the dominant reionizing sources, it is not clear to what extent faint sources below the detection limit of existing observations are needed.
The amount of star formation taking place in low-mass dark matter haloes is not only relevant for reionization, but also for our understanding of galaxy formation and evolution in general. Indeed, several lines of evidence suggest that star formation in such haloes is suppressed, at least in certain regimes. For instance, it is well known at lower redshifts that the baryonic mass fraction in low-mass haloes is strongly suppressed relative to Ωb/Ωm (e.g. Conroy & Wechsler 2009; Guo et al. 2010). This baryon deficiency is commonly attributed to a combination of feedback processes, such as galactic winds and suppression by the photoionizing background (e.g. Dekel & Silk 1986; Efstathiou 1992; Murray, Quataert & Thompson 2005; Faucher-Giguère, Kereš & Ma 2011). Observationally, there also appear to be far fewer dwarf galaxies in the haloes of the Milky Way and M31 than the number of dark matter subhaloes capable of hosting them predicted in N-body simulations (e.g. Bullock, Kravtsov & Weinberg 2000; Madau et al. 2008), suggesting that some processes inhibited star formation in the dark subhaloes. Recently, theoretical models have also suggested that star formation may be specifically suppressed in low-mass haloes at early times due to a metallicity dependence of the star formation efficiency (Robertson & Kravtsov 2008; Gnedin & Kravtsov 2010; Krumholz & Dekel 2011; Kuhlen et al. 2012). If star formation is indeed strongly suppressed in early dwarf galaxies, then it may not be possible to rely on them to reionize the Universe. It is thus necessary to clarify the importance of those galaxies for reionization.
The primary goal of this paper is to examine the existing observational constraints on hydrogen reionization and its sources and to systematically determine which scenarios are (and are not) allowed by the data. A main distinction of our study relative to recent analyses (e.g. Bouwens et al. 2011c; Jaacks et al. 2012; Shull et al. 2012) is the inclusion of lower redshift Lyα forest data (see also Miralda-Escudé 2003; Bolton & Haehnelt 2007; Faucher-Giguère et al. 2008a; Pritchard, Loeb & Wyithe 2010; Haardt & Madau 2012). The mean transmission of the Lyα forest, which is set by a balance between the ionizing background and recombinations, has the advantage of being a complete probe of the ionizing sources. The total instantaneous rate of injection of ionizing photons into the IGM can be measured from the Lyα forest without recourse to assumptions on the escape fraction or extrapolating the contribution of faint sources, two of the principal uncertainties affecting traditional analyses based on the galaxy UV LF. We also include recent constraints on the duration of reionization from measurements of the kinetic Sunyaev–Zeldovich (kSZ) effect by the South Pole Telescope2 (SPT) high-resolution microwave background experiment (Zahn et al. 2011; for a recent parameter space study of the kSZ signal from patchy reionization, see Mesinger, McQuinn & Spergel 2012).
While the Lyα forest data are mostly restricted to z≤ 6, when reionization is probably complete,3 they provide valuable constraints in two ways. First, realistic reionization scenarios should continuously connect to the post-reionization IGM probed by the forest. Secondly, measurements of the galaxy UV LF (analogous to those directly probing the epoch of reionization) are available over the full redshift interval covered by the Lyα forest data (e.g. Bouwens et al. 2007; Reddy & Steidel 2009). Where the data overlap, comparison of the Lyα forest and the UV LF allows us to constrain the escape fraction and limiting magnitude (minimum luminosity) down to which the LF must be integrated in order to account for all the ionizing photons measured using the forest (Faucher-Giguère et al. 2008a). Since these parameters are constrained where the data overlap, we can test whether they must evolve with redshift in order to accommodate the reionization constraints from WMAP and galaxy surveys. Such evolution, in particular in the escape fraction, is sometimes invoked to support the hypothesis that galaxies can indeed reionize the Universe (e.g. Haardt & Madau 2012), but there is little direct evidence for the required change because direct measurements of escaping Lyman continuum photons are prohibitive during the epoch of reionization.
The plan of this paper is as follows. In Section 2, we review how UV LF measurements can be converted into predictions for the reionization history. We show how uncertainties in the SED of galaxies, their escape fraction and the limiting magnitude introduce large degeneracies and allow a wide range of scenarios to be consistent with the standard WMAP constraint. In Section 3, we introduce the Lyα forest constraints on the ionizing background at 2 ≤z≤ 6 and explain how these constraints relate to the ionizing sources. In Section 4, we compare with the galaxy UV LF and Lyα forest data to constrain the escape fraction and limiting magnitude at z= 4. We then combine these constraints with the higher redshift galaxy survey data and the measured WMAP optical depth to quantify the allowed scenarios, parametrized by the required limiting magnitude and evolution of the escape fraction. We conclude with a discussion of the implications for galaxy formation and experiments aimed at probing the epoch of reionization in Section 5.
Throughout we assume cosmological parameters consistent with the WMAP-7 data in combination with supernovae and baryonic acoustic oscillations: (Ωm, Ωb, ΩΛ, h) = (0.28, 0.046, 0.72, 0.7) (Komatsu et al. 2011). We adopt hydrogen and helium mass fractions X= 0.75 and Y= 0.25, respectively. All magnitudes are in the AB system (Oke & Gunn 1983). Unless otherwise noted, all errors are 1σ.
2 GALAXY SURVEY AND WMAP REIONIZATION CONSTRAINTS
The two most basic observational constraints on hydrogen reionization are the high-redshift galaxy UV LF and the Thomson (electron) scattering optical depth to the microwave background measured by WMAP-7, τe= 0.088 ± 0.015 (Komatsu et al. 2011). In the following, we review how these measurements can be combined to constrain parameters of the ionizing source population, in particular the limiting UV magnitude Mlim and the escape fraction of ionizing photons fesc from star-forming galaxies. The procedure is based on calculating, for a given set of assumptions on the galaxy population, the predicted evolution of the IGM ionized fraction versus redshift and evaluating the corresponding τe. As we show in Section 2.3, the escape fraction is degenerated with the ratio of 1500 Å UV continuum to ionizing flux, a quantity sensitive to the SED of the galaxies and whose effect we encapsulate in a dimensionless parameter ζion defined below. Thus, our analysis formally constrains the combination ζionfesc. For simplicity, though, we will occasionally summarize our results in terms of fesc (for values of ζion motivated by stellar population synthesis models), since it is the most uncertain of the two factors.
In this paper, we assume that the majority of the ionizing photons are produced by star-forming galaxies dominated by ordinary Pop II stars. In principle, other sources such as massive Pop III stars (e.g. Bromm, Coppi & Larson 1999; Yoshida, Bromm & Hernquist 2004), accreting black holes (e.g. Haiman & Loeb 1998; Madau et al. 2004; Kuhlen & Madau 2005) or annihilating dark matter (e.g. Belikov & Hooper 2009) could also contribute to ionizing photons. However, there is essentially no observational support for these more exotic scenarios. In particular, the LF of luminous quasars drops sharply beyond z∼ 2 (Hopkins, Richards & Hernquist 2007) and theoretical models suggest that only one or two supernovae from Pop III stars suffice to trigger the transition to Pop II in an early halo (Wise et al. 2012). This is supported by IGM metallicity measurements at z= 5–6, which show that the relative abundances are consistent with measurements down to z∼ 2, and thus that there is no evidence for significant metal production from Pop III stars in the first billion years (Becker et al. 2011b). In contrast, star-forming galaxies are now routinely observed at z≳ 7 and we show explicitly in this work that scenarios in which they are solely responsible for hydrogen reionization are consistent with the available data (for a recent review, see also Robertson et al. 2010).
If sources other than star-forming galaxies dominated hydrogen reionization, then the constraints on Mlim and fesc that follow would be arbitrarily weakened. However, following Occam’s razor, we do not consider such scenarios further here.
2.1 Calculation of the H ii volume filling fraction and of the Thomson optical depth
 , is given by the differential equation
 is the case B hydrogen recombination coefficient, T0 is the IGM temperature at mean density,
  is the effective clumping factor in ionized gas and
  is the mean comoving hydrogen number density. We assume that helium is singly ionized at the same time as hydrogen, but only fully ionized later through the action of quasars (e.g. Faucher-Giguère et al. 2008a). We use the effective clumping factor to account for both the actual clumpiness of the gas and the fact that the IGM temperature (and hence the proper recombination coefficient) in general depends on density, so that formally an average over the temperature distribution should be performed.
The clumping factor must be selected with care, since formal averages  over simulation volumes yield large values ∼30 (e.g. Gnedin & Ostriker 1997; Springel & Hernquist 2003) that imply very demanding requirements on the ionizing sources. These large clumping factors arise because the average includes very dense galaxy halo gas. However, absorption of ionizing photons by gas inside (or in the immediate vicinity of) galaxies is already accounted for by the escape fraction. Thus, the correct clumping factor to use is one that accounts only for recombinations occurring in the more diffuse IGM. Although some ambiguity is inherent in this definition, recent studies suggest that values
  are appropriate during the epoch of reionization (e.g. Pawlik, Schaye & van Scherpenzeel 2009; McQuinn, Oh & Faucher-Giguère 2011; Shull et al. 2012). The IGM temperature T0 is also uncertain, but the fiducial value T0= 2 × 10⁴ K is reasonable for freshly reionized gas (Hui & Haiman 2003).
 ,
, 
The main uncertainties in these calculations, which we discuss next, are
the extrapolation of the LF to magnitudes and redshifts for which no direct measurement exists (Section 2.2),
the conversion from MUV to ionizing photon luminosity (γion; Section 2.3) and
the escape fraction of ionizing photons (fesc; Section 2.4).
2.2 High-redshift galaxy luminosity functions
We base our analysis on recent observational determinations of the rest-frame UV LF at z≥ 4 in the Hubble Ultra Deep Field 2009 (HUDF09; Beckwith et al. 2006; Oesch et al. 2007), Early Release Science (ERS; Windhorst et al. 2011) and Cosmic Assembly Near-infrared Deep Extragalactic Legacy Survey (CANDELS) fields (Grogin et al. 2011; Koekemoer et al. 2011) by Bouwens et al. (2007, 2011b,c). The best-fitting Schechter function parameters (φ*, M* and α) are summarized in Bouwens et al. (2011c, hereafter B11). M* quantifies the characteristic magnitude, φ* measures the comoving number density and α is the faint-end slope.
To interpolate between redshift bins and extrapolate to redshifts not directly probed by the data, we fit the redshift evolution of the three Schechter parameters to a simple linear model of the form {M*, log10φ*, α}=A+B(z− 6). The best-fitting parameters, denoted by FIT, are given in Table 1. In order to explore the uncertainties in the extrapolation to very faint galaxies, we adopt two additional models, in which we vary the redshift evolution within the formal 1σ errors of our linear fits to either maximize (MAX) or minimize (MIN) the contribution from faint galaxies. Compared to our FIT model, the MAX model has a slightly brighter and less rapidly dimming M*, a slightly larger and more slowly decreasing φ* and a steeper and more quickly steepening faint-end slope α; and vice versa for the MIN model. Fig. 1 shows our three fits for the redshift evolution of the Schechter parameters.
UV LF evolution models.
| Model | M* | log10φ* | α | |||
| A | B | A | B | A | B | |
| FIT | −20.42 ± 0.05 | 0.27 ± 0.03 | −3.01 ± 0.04 | −0.07 ± 0.02 | −1.84 ± 0.04 | −0.06 ± 0.02 |
| MIN | −20.37 | 0.30 | −3.05 | −0.09 | −1.80 | −0.04 |
| MAX | −20.47 | 0.24 | −2.97 | −0.05 | −1.88 | −0.08 |
| Model | M* | log10φ* | α | |||
| A | B | A | B | A | B | |
| FIT | −20.42 ± 0.05 | 0.27 ± 0.03 | −3.01 ± 0.04 | −0.07 ± 0.02 | −1.84 ± 0.04 | −0.06 ± 0.02 |
| MIN | −20.37 | 0.30 | −3.05 | −0.09 | −1.80 | −0.04 |
| MAX | −20.47 | 0.24 | −2.97 | −0.05 | −1.88 | −0.08 |
FIT denotes the best linear fit of the form {M*, log10φ*, α}=A+B(z− 6) to the Schechter parameters reported in B11 at z= 4, 5, 6, 7 and 8. The parameters of the MAX and MIN models are adjusted within 1σ of the best fit (independently) so as to maximize and minimize the contribution of faint galaxies.
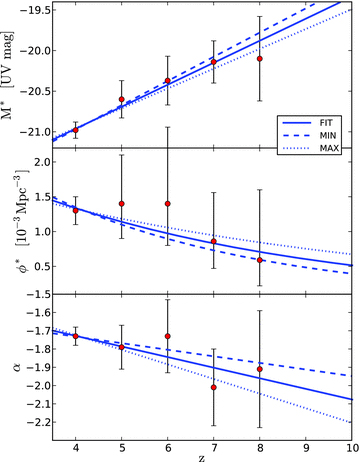
Fits to Schechter galaxy UV LF parameters versus redshift. Data points with error bars are from Bouwens et al. (2011c). The solid line is our best-fitting linear model (FIT). The dashed and dotted lines show the MIN and MAX models, in which the parameters were adjusted within the linear fit formal 1σ errors to minimize (MIN) or maximize (MAX) the contribution from faint galaxies (see the text for details and Table 1 for numerical values).
Fig. 2 shows how these fits compare to the actual LF data from Bouwens et al. (2011a) at z= 4 and 7, and to the 1σ upper limits at z∼ 10 obtained from the detection of a single galaxy candidate by Oesch et al. (2012). While the FIT and MIN models are in good agreement with the z∼ 10 limits, the MAX model predicts more galaxies than observed at MUV=−19.6 by ∼2.5σ. Given the substantial uncertainties in estimating limits from a single candidate in a relatively small field, we however consider the MAX model to represent a valid limiting case.
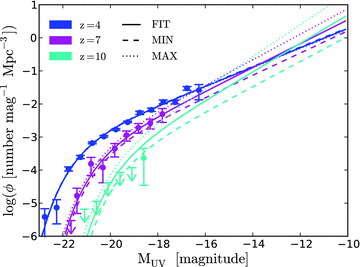
Comparison of our FIT, MIN and MAX LF models to the data of Bouwens et al. (2011a) at z= 4 and 7, and to the updated limits from Oesch et al. (2012) at z= 10. The z= 10 data points, obtained from a single galaxy candidate, were not included in the fits.
For comparison with theoretical predictions, it is useful to relate the UV magnitudes to the total mass of the haloes likely to host these galaxies. Since direct mass determinations from gravitational lensing or clustering are not available at very high redshift, we attempt to establish such a relation via an abundance matching technique, by equating the cumulative dark matter halo mass function to the cumulative UV LF over the redshifts of interest. At lower redshift the validity of the abundance matching technique has been demonstrated by its ability to reproduce the spatial clustering of galaxies in the Sloan Digital Sky Survey/Luminous Red Galaxy (SDSS/LRG) catalogue (Conroy, Wechsler & Kravtsov 2006; Guo et al. 2010; Moster et al. 2010). Here, we use the UV luminosity, which traces star formation rather than stellar mass, and we should expect a larger scatter in its relation to total halo mass. Nevertheless, the relation is likely to still be monotonic on average and we therefore expect the abundance matching results to be valid at the order-of-magnitude level. The results are shown in Fig. 3, which reveals that the faint values of Mlim advocated by B11 correspond to total halo masses below 109 M⊙. These results are in good agreement with a similar determination by Trenti et al. (2010).
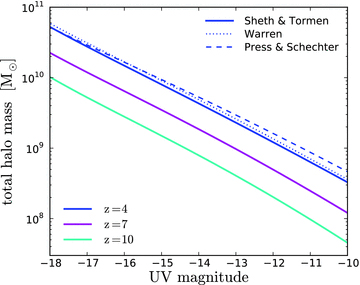
Abundance matching between the dark matter halo mass function and the UV LFs from Bouwens et al. (2010a) at z= 4, 7 and 10.
2.3 Conversion from UV magnitude to ionizing luminosity
 , so that we have the relation βν=−(βλ+ 2).
 . Using equation (5), we can solve for the dimensionless parameter ζion:
In order to bracket the uncertainties in the spectral parameters (fLyC, βν, γ), we consider three different models: a fiducial model (FID) with ζion= 1, a harder spectrum model (HARD) with ζion= 2 and a softer spectrum model (SOFT) with ζion= 0.5. This range is representative of Pop II star-forming galaxies with continuous star formation histories and age  Myr (Leitherer et al. 1999). Note that converting MUV to ionizing luminosity via the star formation rate as done in B11 corresponds to ζion= 1 (our FID model). Our three Lν models thus span a factor of 2 variation (up and down) around the hydrogen-ionizing luminosity used by B11.
2.4 The escape fraction of ionizing photons
Some fraction of the ionizing radiation produced by stellar populations is absorbed by dust and neutral hydrogen within their host galaxies, and thus does not contribute to ionizing the IGM. We capture this suppression by a simple multiplicative pre-factor, fesc, applied in equation (2). Since our calculations are tied to the observed rest-frame UV LF, our fesc is strictly speaking a relative escape fraction, capturing the additional suppression of photons bluewards of the Lyman edge compared to 1500 Å photons. While neutral hydrogen only absorbs the ionizing photons, dust extinguishes 1500 Å and ionizing photons similarly. Because of this broad-band extinction by dust, fesc is not equal to the fraction of all ionizing photons produced by stars which are absorbed in the galaxy. Evaluating the latter would require knowledge of dust extinction, but is not actually required for our purposes. Similar relative definitions of the escape fraction are often adopted observationally as well (e.g. Steidel, Pettini & Adelberger 2001; Inoue, Iwata & Deharveng 2006; Shapley et al. 2006).
The true escape fraction may well vary with galaxy mass, age, star formation history or other properties. Such dependences are however essentially unknown at this time. We therefore assume in this work that fesc is a function of z only, i.e. we use fesc(z) to represent an effective escape fraction averaged over the galaxy population at redshift z, suitably weighted by the (unabsorbed) ionizing luminosity. A time dependence of fesc could thus arise from either a genuine time evolution in the escape fraction of galaxies (e.g. owing to an evolution in the star formation rate and its associated feedback) or from a redshift evolution in the make-up of the galaxy population, with the escape fraction of galaxies with certain properties remaining constant. In Section 4, we quantify the redshift evolution of fesc required by the data for different scenarios.
2.5 Range of models allowed by the UV LF and WMAP-7 constraints alone
In Fig. 4 we show the Thomson optical depth, τe, for different reionization scenarios consistent with the measured UV LF. The models explored correspond to varying assumptions for Mlim, ζion and fesc, which are further assumed here to be constant with redshift.
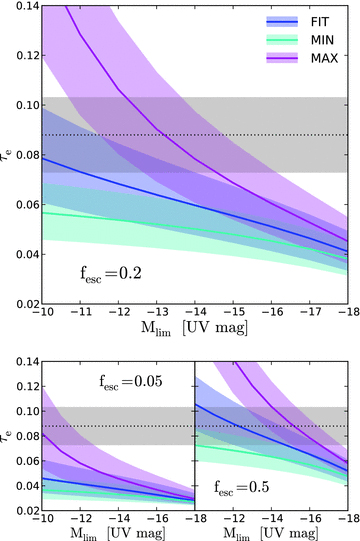
Thomson scattering optical depth of the microwave background versus limiting UV magnitude. The colours represent our three different galaxy UV LF parametrizations: FIT (blue), MIN (cyan) and MAX (magenta). The solid line corresponds to the FID (ζion= 1) Lν model and the shaded regions are bounded by the SOFT (ζion= 0.5) and HARD (ζion= 2) models. The WMAP-7 τe= 0.088 ± 0.015 (Komatsu et al. 2011) is indicated with a grey band. The top panel is for fesc= 20 per cent, the bottom left for fesc= 5 per cent and the bottom right for fesc= 50 per cent. Mlim, ζion and fesc are assumed constant in these calculations, and we used a clumping factor of  .
.
For the best-fitting UV LF evolution parametrization (FIT), fiducial Lν model (ζion= 1, FID) and fesc= 0.2 (solid blue line in the top panel), we recover the result of B11 that a very faint limiting magnitude, Mlim≳−11, is required in order to produce an optical depth in agreement with WMAP-7. However, many other solutions are possible. For example, the same LF model with a harder spectrum (upper edge of the blue shaded region) is consistent with the WMAP-7 data for Mlim=−14, and with the MAX LF model (magenta band) the WMAP-7 τe constraint can accommodate values of Mlim ranging from −11 to as bright as −16, depending on the spectral hardness. The escape fraction provides yet another degree of freedom. With a constant fesc of 5 per cent (bottom-left panel), most models cannot satisfy the WMAP-7 constraint. On the other hand, if fesc= 50 per cent even the MIN LF fit or models with very soft spectra can result in a sufficiently high τe.
In Fig. 5 we show the volume filling factor of H ii regions,  , for a few representative models that all satisfy the WMAP-7 τe constraint. Interestingly, these scenarios have limiting magnitudes ranging from −10 to −16 and include models that extrapolate the contribution of faint galaxies quite differently. We conclude that the existing measurements of the high-redshift galaxy LF (still limited to relatively luminous sources) and of the Thomson optical depth to the microwave background do not uniquely determine how reionization proceeded. In particular, these constraints do not suffice to determine the role played by low-luminosity galaxies.
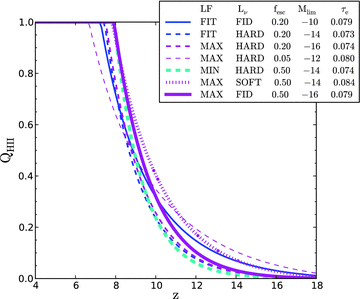
Volume fraction filling of H ii regions as a function of redshift for a set of representative models that satisfy the measured galaxy UV LF and the WMAP-7 Thomson scattering optical depth. LF evolution fits FIT, MIN and MAX are shown in blue, cyan and magenta, respectively. The FID, SOFT and HARD spectral hardness models are indicated with solid, dotted and dashed lines. The line thickness corresponds to fesc= 5, 20 and 50 per cent (from thin to thick).
3 Lyα FOREST CONSTRAINTS ON THE IONIZING SOURCES
The Lyα forest provides complementary constraints on the cosmological emissivity of ionizing photons (Miralda-Escudé 2003; Bolton & Haehnelt 2007; Faucher-Giguère et al. 2008a). Although saturation prevents accurate measurements of the Lyα forest at z≳6 (e.g. Fan et al. 2002), it has the advantage of being a complete probe, in the sense that it includes the contribution of all ionizing sources, even if they are individually too faint to be detected in galaxy surveys. Furthermore, the ionizing emissivity implied by the Lyα forest does not depend on an assumed escape fraction. Thus, the Lyα forest is not subject to the two main uncertainties affecting the inference of the ionizing emissivity from the galaxy UV LF, namely Mlim and fesc. By assuming continuity between the post-reionization epochs probed by the Lyα forest and the reionization epoch probed by high-redshift galaxy surveys, it is therefore possible to significantly reduce the permitted parameter space. In particular, comparison of the UV LF and Lyα data where they overlap allows us to constrain a combination of escape fraction, the limiting magnitude and the conversion factor from 1500 Å UV to ionizing luminosity (Section 4).
3.1 Total ionization rate from the Ly ![formula]() forest
forest
 ,
, 
 is the photoionization cross-section of hydrogen and the integral is from the Lyman limit to infinity. Indeed, the mean level of transmission of the Lyα forest is set by the equilibrium between the ionizing background and recombinations in the IGM. Thus, given a model of the density fluctuations in the IGM and knowledge of the intergalactic gas temperature–density relation, the mean transmission of the Lyα forest can be inverted to give
  (e.g. Rauch et al. 1997).
In this work, we use principally the  data points from Faucher-Giguère et al. (2008a,b) based on the mean transmission measurement of Faucher-Giguère et al. (2008d). This mean transmission measurement, based on 86 high-resolution and high-signal-to-noise quasar spectra covering Lyα redshifts 2 ≤z≤ 4.2, was corrected for absorption by metal ions and for biases in the continuum fits, an important effect at z≳ 4. At z= 5 and 6, we use the constraints on
  from Bolton & Haehnelt (2007), also from mean transmission data. We do not use proximity effect measurements, as they are typically of lower statistical precision and affected by more severe systematics (e.g. Faucher-Giguère et al. 2008c). Nevertheless, at z= 5–6, where some of these effects are mitigated, the proximity effect measurements of Calverley et al. (2011) are consistent with Bolton & Haehnelt (2007).
In Table 2, we summarize the  measurements and other inputs used in our Lyα forest analysis.
Lyα forest constraints on the ionizing emissivity.
| z |  (10−12 s−1) (10−12 s−1) |  (pMpc) (pMpc) |  (1050 s−1 cMpc−3) (1050 s−1 cMpc−3) | References |
| 2.0 | 0.64 ± 0.18 | 303 ± 84 | 2.0 ± 0.8 (+2.1−1.4) | FG08, SC10 |
| 2.2 | 0.51 ± 0.10 | 227 ± 61 | 1.7 ± 0.6 (+1.7−1.2) | FG08, SC10 |
| 2.4 | 0.50 ± 0.08 | 174 ± 45 | 1.8 ± 0.6 (+1.8−1.2) | FG08, SC10 |
| 2.6 | 0.51 ± 0.07 | 135 ± 34 | 2.0 ± 0.6 (+1.9−1.3) | FG08, SC10 |
| 2.8 | 0.51 ± 0.06 | 106 ± 26 | 2.2 ± 0.6 (+2.0−1.4) | FG08, SC10 |
| 3.0 | 0.59 ± 0.07 | 84.4 ± 21 | 2.7 ± 0.7 (+2.5−1.8) | FG08, SC10 |
| 3.2 | 0.66 ± 0.08 | 67.9 ± 16 | 3.3 ± 0.9 (+3.0−2.2) | FG08, SC10 |
| 3.4 | 0.53 ± 0.05 | 55.2 ± 13 | 2.8 ± 0.7 (+2.5−1.8) | FG08, SC10 |
| 3.6 | 0.49 ± 0.05 | 49.5 ± 2.1 | 2.6 ± 0.3 (+1.7−1.5) | FG08, P09 |
| 3.8 | 0.51 ± 0.04 | 41.7 ± 2.4 | 2.8 ± 0.3 (+1.8−1.6) | FG08, P09 |
| 4.0 | 0.55 ± 0.05 | 34.0 ± 3.1 | 3.2 ± 0.4 (+2.2−1.9) | FG08, P09 |
| 4.2 | 0.52 ± 0.08 | 26.2 ± 3.9 | 3.5 ± 0.8 (+2.9−2.2) | FG08, P09 |
| 5.0 | 0.52+0.35−0.21 | 13.9 ± 3.6 | 4.3 ± 2.6 (± 2.6) | B07, SC10 |
| 6.0 | <0.19 | 7.0 ± 2.0 | <2.6 (<2.6) | B07, SC10 |
| z | (10−12 s−1) | (pMpc) | (1050 s−1 cMpc−3) | References |
| 2.0 | 0.64 ± 0.18 | 303 ± 84 | 2.0 ± 0.8 (+2.1−1.4) | FG08, SC10 |
| 2.2 | 0.51 ± 0.10 | 227 ± 61 | 1.7 ± 0.6 (+1.7−1.2) | FG08, SC10 |
| 2.4 | 0.50 ± 0.08 | 174 ± 45 | 1.8 ± 0.6 (+1.8−1.2) | FG08, SC10 |
| 2.6 | 0.51 ± 0.07 | 135 ± 34 | 2.0 ± 0.6 (+1.9−1.3) | FG08, SC10 |
| 2.8 | 0.51 ± 0.06 | 106 ± 26 | 2.2 ± 0.6 (+2.0−1.4) | FG08, SC10 |
| 3.0 | 0.59 ± 0.07 | 84.4 ± 21 | 2.7 ± 0.7 (+2.5−1.8) | FG08, SC10 |
| 3.2 | 0.66 ± 0.08 | 67.9 ± 16 | 3.3 ± 0.9 (+3.0−2.2) | FG08, SC10 |
| 3.4 | 0.53 ± 0.05 | 55.2 ± 13 | 2.8 ± 0.7 (+2.5−1.8) | FG08, SC10 |
| 3.6 | 0.49 ± 0.05 | 49.5 ± 2.1 | 2.6 ± 0.3 (+1.7−1.5) | FG08, P09 |
| 3.8 | 0.51 ± 0.04 | 41.7 ± 2.4 | 2.8 ± 0.3 (+1.8−1.6) | FG08, P09 |
| 4.0 | 0.55 ± 0.05 | 34.0 ± 3.1 | 3.2 ± 0.4 (+2.2−1.9) | FG08, P09 |
| 4.2 | 0.52 ± 0.08 | 26.2 ± 3.9 | 3.5 ± 0.8 (+2.9−2.2) | FG08, P09 |
| 5.0 | 0.52+0.35−0.21 | 13.9 ± 3.6 | 4.3 ± 2.6 (± 2.6) | B07, SC10 |
| 6.0 | <0.19 | 7.0 ± 2.0 | <2.6 (<2.6) | B07, SC10 |
The H i photoionization rates measurements are taken from Faucher-Giguère et al. (2008a) (FG08) and Bolton & Haehnelt (2007) (B07); the mean free paths are taken from the fits of Prochaska, Worseck & O’Meara (2009) (P09) and Songaila & Cowie (2010) (SC10). Errors on  and
and  are 1σ and predominantly statistical (except for the B07
  points, which include a systematic error budget). Total uncertainties on
  , including systematic effects arising from the spectral shape of the UV background and the thermal history of the IGM, are given in parentheses and shown by the light grey band in Fig. 6 (see the text). The prefixes ‘p’ and ‘c’ indicate proper and comoving units, respectively.
Lyα forest constraints on the ionizing emissivity.
| z | (10−12 s−1) | (pMpc) | (1050 s−1 cMpc−3) | References |
| 2.0 | 0.64 ± 0.18 | 303 ± 84 | 2.0 ± 0.8 (+2.1−1.4) | FG08, SC10 |
| 2.2 | 0.51 ± 0.10 | 227 ± 61 | 1.7 ± 0.6 (+1.7−1.2) | FG08, SC10 |
| 2.4 | 0.50 ± 0.08 | 174 ± 45 | 1.8 ± 0.6 (+1.8−1.2) | FG08, SC10 |
| 2.6 | 0.51 ± 0.07 | 135 ± 34 | 2.0 ± 0.6 (+1.9−1.3) | FG08, SC10 |
| 2.8 | 0.51 ± 0.06 | 106 ± 26 | 2.2 ± 0.6 (+2.0−1.4) | FG08, SC10 |
| 3.0 | 0.59 ± 0.07 | 84.4 ± 21 | 2.7 ± 0.7 (+2.5−1.8) | FG08, SC10 |
| 3.2 | 0.66 ± 0.08 | 67.9 ± 16 | 3.3 ± 0.9 (+3.0−2.2) | FG08, SC10 |
| 3.4 | 0.53 ± 0.05 | 55.2 ± 13 | 2.8 ± 0.7 (+2.5−1.8) | FG08, SC10 |
| 3.6 | 0.49 ± 0.05 | 49.5 ± 2.1 | 2.6 ± 0.3 (+1.7−1.5) | FG08, P09 |
| 3.8 | 0.51 ± 0.04 | 41.7 ± 2.4 | 2.8 ± 0.3 (+1.8−1.6) | FG08, P09 |
| 4.0 | 0.55 ± 0.05 | 34.0 ± 3.1 | 3.2 ± 0.4 (+2.2−1.9) | FG08, P09 |
| 4.2 | 0.52 ± 0.08 | 26.2 ± 3.9 | 3.5 ± 0.8 (+2.9−2.2) | FG08, P09 |
| 5.0 | 0.52+0.35−0.21 | 13.9 ± 3.6 | 4.3 ± 2.6 (± 2.6) | B07, SC10 |
| 6.0 | <0.19 | 7.0 ± 2.0 | <2.6 (<2.6) | B07, SC10 |
The H i photoionization rates measurements are taken from Faucher-Giguère et al. (2008a) (FG08) and Bolton & Haehnelt (2007) (B07); the mean free paths are taken from the fits of Prochaska, Worseck & O’Meara (2009) (P09) and Songaila & Cowie (2010) (SC10). Errors on and are 1σ and predominantly statistical (except for the B07 points, which include a systematic error budget). Total uncertainties on , including systematic effects arising from the spectral shape of the UV background and the thermal history of the IGM, are given in parentheses and shown by the light grey band in Fig. 6 (see the text). The prefixes ‘p’ and ‘c’ indicate proper and comoving units, respectively.
3.2 From ionization rate to ionizing emissivity
 between the H i and He ii ionizing edges (and zero beyond),
 at the Lyman limit),5
 between the H i and He ii ionizing edges (and zero beyond),6
At 3.6 ≤z≤ 4.2, we use the mean free path measured by Prochaska et al. (2009) using a stacking analysis. This approach avoids the usual uncertainties in calculating the mean free path from the column density distribution stemming from the difficulty of measuring the column density of systems near the Lyman limit (on the flat part of the curve of growth). At the other redshifts 2 ≤z≤ 6, we use the mean free path derived by Songaila & Cowie (2010) based on a new analysis of the column density distribution. These expressions agree well with the mean free path inferred previously by Faucher-Giguère et al. (2008a), but have significantly reduced uncertainties. On the other hand, this mean free path is larger than that assumed by Madau et al. (1999) by a factor of ∼2.5. Furthermore, these mean free path measurements are significantly more accurate than the simple model based on the mean spacing between Lyman limit systems assumed by Bolton & Haehnelt (2007).
Fig. 6 summarizes the IGM observational constraints on  . The error bars on the data points account for the statistical uncertainty on the photoionization rate and on the mean free path. The z= 5 and 6 error bars also include a systematic error budget on
  , as quantified by Bolton & Haehnelt (2007). Total uncertainties, including systematics, are indicated by the light grey band and estimated as follows. First, we allow for a 50 per cent systematic error on the
  data points from Faucher-Giguère et al. (2008a) to account for uncertainties in the thermal state of the IGM and the probability distribution function of density fluctuations, which enter in the mean transmission method (Bolton et al. 2005; Faucher-Giguère et al. 2008a). Secondly, we vary the source spectral index γ from 1 to 3. The harder value γ= 1 is preferred by optical line ratio diagnostics in local starbursts (Kewley et al. 2001), while many stellar population synthesis models predict γ≈ 3 (e.g. Leitherer et al. 1999). This range of slopes is also consistent with the possibility that quasars, with mean spectral index ∼1.6 (Telfer et al. 2002), contribute significantly at the lower redshift end. The fiducial value assumed in our calculations is γ= 1; since stellar population synthesis models generally predict softer spectra, we do not explore harder values. The spectral index of the background in the ionizing regime is not independent but instead satisfies γbg=γ− 3(β− 1),7 where β is the slope of the H i column density distribution (Faucher-Giguère et al. 2008a). We adopt β= 1.3 (Songaila & Cowie 2010).
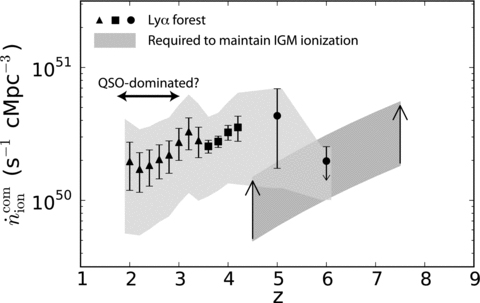
Lyα constraints on the rate at which ionizing photons are injected into the IGM (see Section 3 for details and Table 2 for numerical values). The light grey band indicates instantaneous constraints from the measured mean transmission of the Lyα forest, including systematic effects. The dark grey band indicates the minimum value necessary to keep the Universe ionized, assuming that reionization is complete, for a fiducial IGM temperature T0= 2 × 10⁴ K and effective clumping factor  . Models of the ionizing background indicate that the ionizing emissivity is dominated by star-forming galaxies at z≳ 3, but that quasars may dominate at lower redshifts (Faucher-Giguère et al. 2008a, 2009).
To indicate the total uncertainty, we first calculate the range of  values allowed by simultaneously varying the systematically uncertain parameters to their extremes. We then add the statistical uncertainty to the minimum and maximum values in each redshift bin. We believe that this procedure conservatively captures the constraints on
  .
.
The mean transmission data points are instantaneous constraints that must be satisfied by the galaxy population. Models of the ionizing background at intermediate redshifts indicate that star-forming galaxies dominate at z≳ 3 (Haehnelt et al. 2001; Bolton et al. 2005; Faucher-Giguère et al. 2008a, 2009). However, quasars may dominate the hydrogen photoionization rate at later times, so that the total background should be regarded as an upper limit to the contribution of star-forming galaxies alone. It should also be noted that any redshift evolution in  contained in the light grey band in Fig. 6 is allowed. In particular, it is possible that the true redshift evolution is titled in slope relative to that suggested by the fiducial data points. This is because the uncertain parameters could evolve significantly with redshift. For instance, measurements indicate that the IGM temperature peaks at T0≳ 2 × 10⁴ K around z∼ 3.4 (Lidz et al. 2010), possibly owing to reheating from He ii reionization, but could be less than ∼104 K between H i and He ii reionization (Hui & Haiman 2003; Becker et al. 2011a; Bolton et al. 2012). Recent observations also indicate that the UV slopes of z∼ 7 galaxies are significantly bluer than their z∼ 3 counterparts (Bouwens et al. 2010b), so that the relevant spectral indexes could also evolve.
It is apparent from Fig. 6 that the best-fitting comoving ionizing photon emissivity,  , increases from z= 2 to 4.2, and perhaps even to higher redshift. This basic behaviour stems from the fact that while the photoionization rate,
  , is approximately constant over this redshift interval, the mean free path decreases rapidly with increasing redshift (Faucher-Giguère et al. 2008a; McQuinn et al. 2011). Thus, an increasing ionizing emissivity is required to maintain the observed photoionization rate (equation 2).
3.3 Keeping the Universe ionized
 , the minimum
  required to keep the IGM ionized once it has already been reionized. This number is obtained by balancing the global recombination rate in the fully ionized IGM with the rate at which ionizing photons escape galaxies:
The  band in Fig. 6 covers the range
  and assumes a fiducial IGM temperature T0= 2 × 10⁴ K. This temperature is consistent with measurements at z∼ 2–4 (e.g. Lidz et al. 2010), but could be higher or lower by ∼104 K depending on the spectrum of the reionizing sources and the time elapsed since reionization (Hui & Haiman 2003). Estimates of the IGM temperature at z > 4 in fact suggest T0 < 10 000 K at
  (Becker et al. 2011a; Bolton et al. 2012). Fortunately, this uncertainty does not substantially affect our arguments, since the recombination coefficient is a relatively weak function of temperature.
Note that the  lower limit only applies after reionization is complete. Since we do not a priori know the redshift of reionization, the plotted constraint (extending to z= 7.5) need not necessarily be satisfied everywhere. However, any viable reionization scenario must satisfy this constraint at all redshifts following the time when an ionized fraction ∼1 is reached.
4 COMBINING Ly ![formula]() FOREST, GALAXY SURVEY, AND WMAP CONSTRAINTS
FOREST, GALAXY SURVEY, AND WMAP CONSTRAINTS
We showed in Section 2 that many different reionization scenarios are consistent with the existing galaxy survey and WMAP constraints, principally due to uncertainties in Mlim and fesc and also ζion. We now combine these constraints with the Lyα forest data at lower redshifts (Section 3), which allow us to break certain degeneracies and quantify possible redshift evolution in the relevant parameters. The key idea is that for any Mlim, comparison of the Lyα forest and galaxy UV LF data where they overlap implies a unique ζionfesc value (assuming that galaxies dominate the ionizing background). We choose to make this comparison at z= 4, because at this redshift we expect the hydrogen ionizing background to in fact be dominated by star-forming galaxies (Faucher-Giguère et al. 2008a, 2009). Furthermore, at this redshift the observational constraints on the Lyα forest transmission and the mean free path of ionizing photons are quite good. Additionally, we do not expect this redshift to be strongly affected by large inhomogeneities in the ionizing background. At higher redshifts (especially at z∼ 6), interpretation of the Lyα forest data becomes more uncertain because of the small number of sight lines available and because reionization may not be 100 per cent complete (McGreer et al. 2011). Because only certain combinations (Mlim, ζionfesc) are allowed at z= 4, we can quantify whether redshift evolution in these parameters is required in order to simultaneously satisfy the higher redshift constraints from galaxy surveys and WMAP.
In the following, we consider possible evolution first in ζionfesc (Section 4.1) and then in Mlim (Section 4.2). In principle, there could be simultaneous evolution in both ζionfesc and Mlim, but the data do not allow us to discriminate between such mixed scenarios. Furthermore, we will show that the strong redshift evolution required in models relying only on relatively bright galaxies is most plausibly accounted for by evolution in the escape fraction. In Section 4.3, we consider the redshift and duration of reionization in different allowed scenarios, showing that the redshift of 50 per cent ionized fraction is consistent at zreion(50 per cent) ∼ 10 among the different models allowed by the data, but that the duration of reionization, Δzreion≡zreion(100 per cent) −zreion(20 per cent) [where zreion(x) is the redshift such that  ], is on the other hand sensitive to the contribution of faint galaxies.
4.1 Redshift evolution of ζionfesc
We first focus on the redshift evolution of ζionfesc from z= 4 towards higher redshifts.
Our goal is to determine as a function of Mlim (here assumed to be independent of z) what values of κ are consistent with both the z≈ 4 Lyα forest and WMAP-7 Thomson optical depth constraints, while also satisfying the measurements of the galaxy UV LF at the bright end. Operationally, we first determine for a given Mlim what range of ζionfesc(z= 4) is required to give  . The results of this calculation are shown in the top panel of Fig. 7. For Mlim=−10 to −16, the Lyα constraints require ζionfesc(z= 4) to lie between 2 and 8 per cent (since the LF has already been measured down to MUV=−16 at z= 4, cases with brighter Mlim at this redshift are not allowed; Bouwens et al. 2007). As ζion= 1 for the fiducial spectral model, this directly quantifies the implied escape fraction. This result is independent of which LF fit we employ, since at z= 4 the parameters of our three fits are nearly identical.
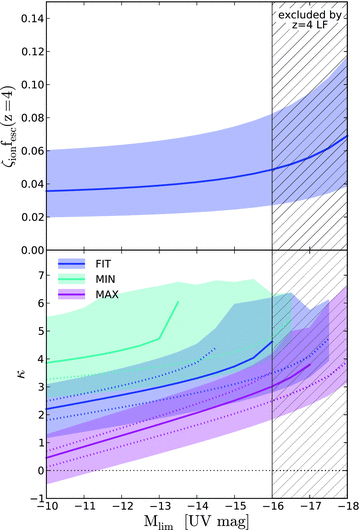
Top: value of ζionfesc at z= 4 needed to simultaneously match the total comoving emissivity of ionizing photons measured from the Lyα forest,  , and the observed UV LF at the same redshift, as a function of the limiting UV magnitude. Since our LF fits are almost identical at z= 4, we only show the FIT case. Because ζion= 1 for the fiducial spectral model, the values directly quantify the implied escape fraction. Bottom: power-law index κ of the redshift evolution of ζionfesc (see equation 15) needed to simultaneously match the z= 4 Lyα forest and WMAP-7 Thomson optical depth constraints, as a function of the limiting UV magnitude (assumed constant here), for our three LF evolution fits. The solid (dotted) lines correspond to the median value (±1σ) of the WMAP-7 Thomson optical depth. The shaded regions encompass the total (including systematic) uncertainty in
  . Note that some models with bright Mlim do not admit solutions for the entire τe range.
In the second step, we determine for each Mlim and ζionfesc (z= 4) what values of the power-law index κ yield a Thomson optical depth in the range allowed by WMAP-7. The resulting range of allowed κ values is shown in the bottom panel of Fig. 7, with the different colour bands corresponding to our three LF fits. The width of the bands encompasses both the 1σ uncertainty of the WMAP-7 Thomson optical depth measurement and the total (including systematic) uncertainty in the z= 4 Lyα forest data. Fig. 8 shows the curves of ζionfesc versus z corresponding to the allowed values of κ, for representative choices of Mlim. For each κ solution, Fig. 9 shows zreion(20 per cent), zreion(50 per cent), zreion(90 per cent) and zreion(100 per cent).
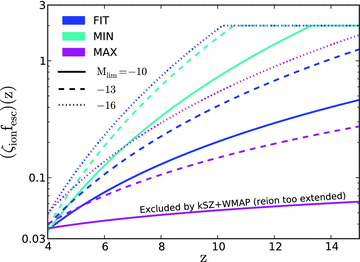
Evolution of ζionfesc versus redshift required to simultaneously satisfy the z= 4 Lyα forest and WMAP-7 Thomson optical depth constraints, for Mlim=−10, −13 and −16 (models corresponding to the solid lines in Fig. 7). A ceiling of ζionfesc < 2 is imposed in our calculations, corresponding to fesc= 1 for ζion= 2 (our HARD spectral model).
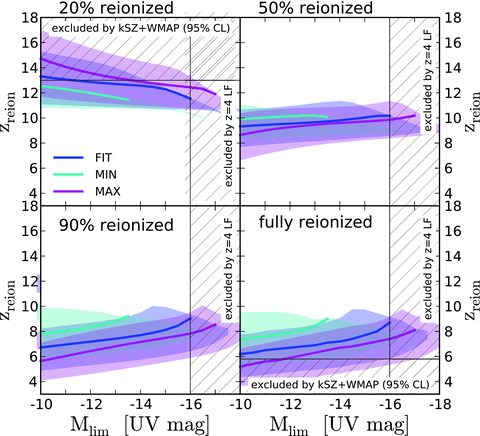
Redshift at which reionization is 20 per cent (top-left), 50 per cent (top-right), 90 per cent (bottom-left) and 100 per cent complete (bottom-right), as a function of the limiting UV magnitude, for models in which ζionfesc(z) is tuned to reproduce both the WMAP-7 Thomson optical depth and the z= 4 Lyα forest constraints. The colours represent our three LF evolution fits, and the shaded region encompasses both the WMAP-7  1σ region and the total (including systematic) uncertainty in
  .
.
Lastly, Fig. 10 shows explicit examples of how redshift evolution in ζionfesc allows models to simultaneously satisfy reionization-epoch constraints and the z < 6 Lyα forest data. Specifically, we consider the same models as in Fig. 5 (top) and modify them to allow for redshift evolution in ζionfesc (bottom). For the models with redshift evolution in ζionfesc, the LF parametrization and Mlim are fixed to the values from Fig. 5, ζionfesc(z= 4) is set by the Lyα forest data at z= 4, and we solve for κ such that the Thomson optical depth matches the central WMAP-7 measurement. While the original models without evolution in ζionfesc overproduce the ionizing emissivity probed by the Lyα forest at z= 4, the modified models simultaneously satisfy all the constraints. Furthermore, models exist in which the extrapolation to z= 2 is also in good agreement with the lower redshift Lyα forest data.
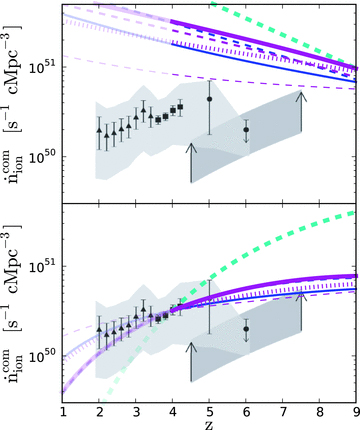
Same as Fig. 6, but with the models from Fig. 5 overplotted for the constant ζionfesc case (top) and modified to allow for redshift evolution in ζionfesc (bottom). For the models with redshift evolution in ζionfesc, the LF parametrization and Mlim are fixed to the values from Fig. 5, ζionfesc(z= 4) is set by the Lyα forest data at z= 4, and we solve for κ (equation 14) such that the Thomson optical depth matches the central WMAP-7 measurement. In the same order as the legend in Fig. 5, the best-fitting values are  . The model lines are greyed out at z < 4, since we do not utilize galaxy LF data at those redshifts.
At the 1σ level, only the MAX model with very faint Mlim≳−11 can accommodate no redshift evolution in ζionfesc. However, these scenarios are disfavoured by external constraints on the duration of reionization from the kSZ effect (Zahn et al. 2011), which in combination with the WMAP-7 optical depth constrains the timing of its beginning and end. For the most conservative case of arbitrary correlations between the thermal Sunyaev–Zeldovich effect and the cosmic infrared background, Zahn et al. (2011) find that zreion(20 per cent) < 13.1 at the 95 per cent confidence level (CL) and zreion(99 per cent) > 5.8, also at the 95 per cent CL. In this work, we take these constraints at face value. It is important to bear in mind, however, that the templates on which they are based assume that reionization occurs primarily via star-forming galaxies. Furthermore, the limits on the kSZ signal rely critically on accurate subtraction of contaminating point sources. It will thus be important to confirm these findings with refined analyses.
For the best-fitting parametrization of the UV LF (the FIT model), models with no redshift evolution in ζionfesc are disfavoured even for Mlim=−10. Models that rely only on brighter galaxies formally satisfy all the present constraints but only for strong redshift evolution in ζionfesc. For example, the case of Mlim=−16 for the FIT parametrization requires an evolution in ζionfesc by a factor of ≈20 from z= 4 to 9. As we will discuss at greater length in Section 5, models that rely too heavily on fainter galaxies may be in tension with theoretical models that suppress star formation in early, low-mass systems (e.g. Krumholz & Dekel 2011; Kuhlen et al. 2012), which are helpful in explaining some properties of the cosmic star formation history. If star formation is indeed suppressed in those early dwarfs, then the existing data would imply strong evolution in the escape fraction.
We also explored constraints on the redshift evolution ζionfesc from z= 2 to 4 by comparing the Lyα forest data to the galaxy UV LF from Reddy & Steidel (2009) at z= 2. Over that redshift interval, a wide range  is allowed, almost independent of the assumed Mlim owing to the relatively shallow faint-end slope of the LF. In particular, the combination of the UV LF and Lyα forest data alone does not require any significant evolution. Note that such evolution is nonetheless allowed by the data, and in fact suggested by direct Lyman continuum observations (e.g. Inoue et al. 2006; Siana et al. 2010). Although this is not necessary on physical grounds, it is interesting that most of the κ values implied from z= 4 and up (Fig. 7) are also allowed from z= 2 to 4.
4.2 Redshift evolution of Mlim
We now turn to the possibility of redshift evolution in Mlim. Starting from the same values of ζionfesc(z= 4) for a given Mlim(z= 4) as in the previous section, we determine what values of λ can produce agreement between the Lyα forest constraints at z= 4, and higher redshift LF and WMAP-7 constraints. The top panel of Fig. 11 demonstrates that substantial evolution is necessary to match the WMAP-7 Thomson optical depth measurement. Many models actually do not allow for a solution: for the MIN LF fit, the contribution of dwarfs is suppressed to such a degree that no amount of Mlim evolution is able to raise τe into the range allowed by WMAP-7. The FIT model only has solutions with very steep Mlim evolution, requiring Mlim significantly below −10 at high redshift. Only the MAX models are able to provide solutions with a moderate amount of Mlim evolution. Most importantly, as the middle panel of Fig. 11 demonstrates, the majority of the models with evolving Mlim (but constant ζionfesc) do not reach complete reionization by z= 5.8, as required by the combination of the kSZ and WMAP constraints (Zahn et al. 2011).
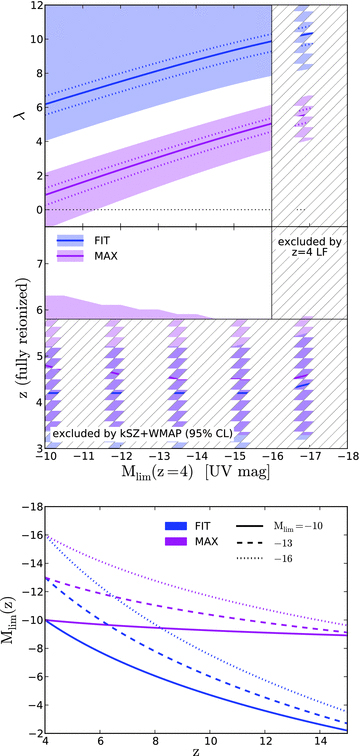
Top: power-law index λ of the redshift evolution of the limiting UV magnitude Mlim (see equation 14) needed to simultaneously match the z= 4 Lyα forest and the WMAP-7 Thomson optical depth constraints, as a function of Mlim(z= 4) (ζionfesc is assumed constant). As before, the solid (dotted) lines correspond to the median value (±1σ) of the WMAP-7 Thomson optical depth, and the shaded regions encompass the total (including systematic) uncertainty in  . Models with the MIN LF fit do not admit any solutions with evolution only in Mlim. Middle: redshift at which reionization is completed (
 ). Most of the Mlim-only evolution models do not complete reionization by z= 5.8, as required by the combination of kSZ and WMAP-7 data (Zahn et al. 2011). Bottom: median Mlim redshift evolution (corresponding to the solid lines in the top panel), for Mlim=−10, −13 and −16. Very faint limiting magnitudes Mlim≫−10 are also likely excluded on physical grounds.
Except for small, extreme corners of parameter space, it is therefore not possible to simultaneously match z= 4 Lyα forest and reionization constraints, and complete reionization in time, by allowing only evolution in Mlim. This provides further evidence for the need for a significant redshift evolution in ζionfesc from z= 4 towards higher redshifts, as discussed in the previous section. In contrast, the data do not provide conclusive evidence for a significant redshift evolution in Mlim (although some evolution may be expected on physical grounds). We will therefore concentrate the following discussion on scenarios with constant Mlim but evolving ζionfesc. It is important to keep in mind, however, that evolution in Mlim could reduce the required amount of evolution in ζionfesc somewhat.
4.3 Redshift and duration of reionization
Interestingly, Fig. 9 shows that the redshift of 50 per cent ionized fraction is consistently at z∼ 10 between the different allowed scenarios. This is consistent with the redshift of instantaneous reionization implied by WMAP-7, zreion= 10.4 ± 1.2. However, the predicted duration of the reionization process is more extended for scenarios that include a larger contribution from faint galaxies. This is a consequence of the shape of the LF: the brighter and closer to M* (the knee of the LF) Mlim, the fewer galaxies contribute to reionization at high z. The reionization process then quickly sets in once the exponential cut-off of the LF has shifted to bright enough galaxies that Mlim galaxies become common. In contrast, with a faint Mlim abundant faint galaxies contribute to reionization even at very high redshifts, and therefore the overall evolution of the process is slowed down.
As shown in Fig. 9, the kSZ data favour relatively short reionization histories and thus disfavour models that rely too heavily on high-redshift dwarfs, as in the MAX models. A range of MIN and FIT models are however allowed. In particular, our conclusions are consistent with theoretical analyses anchored in the predicted dark matter halo mass function, rather than to the observed LF (Trenti et al. 2010; Ciardi et al. 2011; Mesinger et al. 2012), indicating that as of yet undetected galaxies must contribute significantly to reionization. However, our analysis suggest alternative possibilities when strong redshift evolution in ζionfesc is allowed.
Recently, two significant observational advances in using astrophysical sources to probe the epoch of reionization have been reported. First, Mortlock et al. (2011) discovered a luminous quasar at z= 7.085 in which the Lyα transmission profile is consistent with an IGM neutral fraction ∼10 per cent at that time. Although this is compatible with most of the scenarios allowed by our analysis (Fig. 9), excluding those relying on a maximal contribution from dwarf galaxies, alternative interpretations exist in the context of inhomogeneous reionization (Bolton et al. 2011).
Secondly, recent surveys for Lyα emitting galaxies at z≥ 6 have found a decreasing fraction of Lyman break-selected galaxies with detected Lyα emission of rest-frame equivalent width ≥20 Å from z∼ 6 to z∼ 7 (Pentericci et al. 2011; Ono et al. 2012; Schenker et al. 2012). The decline is such that existing models of Lyα propagation through galactic winds and the intervening IGM indicate  per cent at z∼ 7 (Dijkstra, Mesinger & Wyithe 2011). Such a high neutral fraction at z= 7 is in tension with the concordance scenarios summarized in Fig. 9. Furthermore, if reionization is essentially complete by z∼ 6 as the combination of kSZ and WMAP-7 measurements indicates, and as suggested by Gunn–Peterson troughs in the Lyα forest (e.g. Fan et al. 2002), then a very rapid evolution in the neutral fraction would be implied. These findings are not easy to reconcile, and highlight the need for more detailed modelling of Lyα radiative transfer in order to fully exploit the new and upcoming high-quality data.
5 SUMMARY AND DISCUSSION
Measurements of the galaxy UV (∼1500 Å) LF at redshifts z≳ 6, recently improved by more than an order of magnitude thanks to the WFC-3 on HST, provide constraints on the likely sources of hydrogen reionization. However, these observations only directly reveal the sources luminous enough to be individually detected. Furthermore, converting the LF measurements to IGM ionization rates involves large uncertainties, in addition to the extrapolation necessary to model sources too faint to be detected, including the SED of the star-forming galaxies and their escape fraction of ionizing photons. These latter uncertainties are encapsulated in the dimensionless factor ζionfesc used to convert a luminosity at 1 500 Å to a rate of production of ionizing photons escaping into the IGM.
Given these uncertain parameters, we showed in Section 2 that many scenarios exist in which star-foming galaxies are the dominant ionizing sources and which satisfy both the galaxy survey constraints and the Thomson optical depth implied by the WMAP-7 data. Such scenarios include ones with escape fraction ranging from fesc= 5 to 50 per cent, and limiting UV magnitude ranging from Mlim=−16 to Mlim=−10, even when these are assumed to be constant. Thus, these constraints alone (which have been the focus of many analyses; e.g., B11; Bunker et al. 2010) are not sufficient to determine the role of faint galaxies in reionizing the Universe, and whether such galaxies are even present in significant number.
In Section 3 we used the Lyα forest at redshifts 2 ≤z≤ 6 to measure the total instantaneous rate at which ionizing photons are injected into the IGM. Although these measurements cover redshifts past the epoch of reionization, they provide significant leverage over galaxy surveys. In particular, the total ionizing emissivity implied by the mean transmission of the Lyα forest does not rely on assuming an escape fraction or a limiting magnitude, two of the main uncertainties limiting the predictive power of UV LF measurements alone. At z= 4, where the Lyα forest data are both abundant and free of large systematic effects due to inhomogeneities in the ionizing background, comparison with the UV LF allowed us to determine ζionfesc almost independently of Mlim, owing to the comparatively shallow faint-end slope of the LF at  . Since Mlim≥−16 at z= 4 (the UV LF having already been measured down to this magnitude), fesc(z=4) = 2 –8 per cent [median fesc(z= 4) = 4 per cent], for the fiducial spectral model ζion= 1.
Combining the Lyα forest, WMAP-7 and galaxy survey data and assuming that galaxies are the main ionizing sources requires either (1) extrapolation of the galaxy LF down to very faint UV magnitudes Mlim∼−10, corresponding roughly to the UV background suppression scale (e.g. Faucher-Giguère et al. 2011; but see Dijkstra et al. 2004); (2) an increase of the escape fraction by a factor of ≳10 from z= 4 to 9; or (3) more likely, a hybrid solution in which undetected galaxies contribute significantly and the escape fraction increases more modestly.
The present data do not allow us to select a unique viable reionization scenario. Quantitatively, a range of combinations of limiting magnitudes and redshift evolution of the parameters affecting the conversion of ∼1500 Å UV LFs to rates of production of ionizing photons are allowed and summarized in Figs 7, 8 and 11. Redshift evolution in the limiting magnitude alone requires extreme assumptions in order to satisfy both the Lyα forest and WMAP-7 constraints without appealing to very faint galaxies. Even so, such scenarios predict that reionization ends at z≲ 6, in tension with recent measurements of the kSZ effect by SPT, which indicate that reionization ends earlier than z= 5.8 at the 95 per cent CL (Zahn et al. 2011). On the other hand, significant redshift evolution in ζionfesc is more plausible. In fact, ζion can vary by a factor of ∼4 owing to changes in the age, metallicity and IMF of the stellar populations (corresponding to the range  assumed in this paper; Section 2.3).8 More importantly, fesc can in principle increase from fesc∼ 4 per cent at z= 4 to fesc∼ 1 at earlier times. A similar strong redshift evolution of the ionizing luminosity-weighted escape fraction was also recently found to be required in the ‘minimal cosmic reionization model’ of Haardt & Madau (2012).
Although there are at present no direct constraints on the escape fraction from faint galaxies during the epoch of reionization, deep searches for escaping Lyman continuum radiation at lower redshifts do show some evidence for redshift evolution (Steidel, Pettini & Adelberger 2001; Inoue et al. 2006; Shapley et al. 2006; Cowie, Barger & Trouille 2009; Siana et al. 2010; Nestor et al. 2011). Such evolution, in which the escape fraction increases with redshift, could owe to increased feedback at earlier times when star formation was more vigorous (e.g. Wise & Cen 2009). This picture, in which ionizing photons escape galaxies along lines of sight cleared of obscuring gas, would be consistent with Lyman continuum observations suggesting ‘on/off’ escape, possibly connected to the viewing geometry (e.g. Shapley et al. 2006; Nestor et al. 2011; Vanzella et al. 2012). Another possibility is that faint galaxies may typically have higher escape fraction than more massive galaxies (e.g. Yajima, Choi & Nagamine 2011), in which case the larger relative abundance of faint galaxies at high redshift would result in an increase in the population-averaged escape fraction. The extremely blue UV continuum slopes recently reported for z∼ 7 galaxies (Bouwens et al. 2010b) are also suggestive of weak nebular recombination emission, which would be consistent with very high escape fractions of ionizing photons (but see Dunlop et al. 2012 for a critical analysis of the UV continuum slopes).
Recent models predict that star formation is suppressed in low-mass, high-redshift galaxies owing to the metallicity dependence of the transition from warm H i to dense molecular gas. In the fiducial implementations of Krumholz & Dekel (2011) and Kuhlen et al. (2012), metallicity effects can strongly suppress star formation in reionization-epoch galaxies in haloes of mass of Mh∼ 109–1010 M⊙, corresponding to MUV∼−13 to −16 at z∼ 7. Formally, even the brighter Mlim of these models can satisfy the existing reionization constraints, but only for strong redshift evolution in ζionfesc (Fig. 7). Since such a H2-regulated star formation suppression threshold is not far from the current limits of HST observations at z∼ 7, deeper integrations have the potential to significantly constrain those models. As Kuhlen et al. (2012) showed, the exact halo mass below which metal-poor dwarfs are suppressed is however sensitive to the details of the model implementation. In particular, the relevant mass scale depends significantly on the metallicity floor assumed to model the unresolved effects of metal enrichment by early Pop III stars. If the correct halo mass threshold is lower by an order of magnitude relative to the fiducial models of Kuhlen et al. (2012) and closer to the predictions of Krumholz & Dekel (2011), i.e. Mh∼ 109 M⊙ at z∼ 7, then abundance matching suggests that the turnover in the LF would occur instead at MUV∼−13 (see Fig. 3). For limiting magnitudes in this neighbourhood, more modest redshift evolution in ζionfesc can satisfy the galaxy survey, WMAP-7, and Lyα forest data. Thus, given the present implementation uncertainties, H2-regulated star formation in high-redshift dwarfs is consistent with galaxies reionizing the Universe.
For each scenario satisfying the observational constraints considered in this work, we evaluated the timing and duration of the corresponding reionization history (Fig. 9). Interestingly, the redshift at which the ionized fraction reaches 50 per cent is consistent among the different allowed scenarios, zreion(50 per cent) ∼ 10. This redshift is consistent with the redshift of instantaneous reionization zreion= 10.4 ± 1.2 implied by the WMAP-7 analysis (Komatsu et al. 2011). On the other hand, the predicted duration of reionization is quite sensitive to the fractional contribution of faint galaxies. For instance, our MAX parametrization with Mlim=−10 (i.e. with a heavy dwarf contribution) allows scenarios with zreion(20 per cent) = 17 and zreion(100 per cent) < 4. On the other hand, models which rely on bright galaxies are predicted to reionize the Universe much more sharply, with  for our FIT parametrization with (Mlim=−16). Thus, experiments capable of measuring the duration of reionization will have direct implications for faint galaxies. In fact, the more extended reionization histories which rely on a heavy contribution from faint galaxies are already ruled out by recent constraints from the kSZ effect by SPT. In the next few years, expanded data sets from high-resolution microwave background experiments in combination with more precise measurements of the integrated Thomson optical depth with Planck9 will improve these constraints further. Refined analyses should also improve the accuracy with which contaminating point sources are subtracted, and thus solidify the results.
On the theoretical front, there is much room for improving our understanding of how to reliably use astrophysical sources such as high-redshift Lyα emitting galaxies, luminous quasars and γ-ray bursts to measure the neutral fraction in the IGM. Finally, efforts aimed at detecting 21 cm emission from high-redshift intergalactic neutral gas (e.g. Bowman et al. 2007; Bowman & Rogers 2010; Parsons et al. 2010) are poised to eventually directly map the reionization epoch.
CAFG is supported by a fellowship from the Miller Institute for Basic Research in Science and NASA grant 10-ATP10-0187.
Footnotes
In reality, the epoch of reionization is expected to be extended in time and the Thomson scattering optical depth only provides an integral constraint on reionization.
Because reionization is predicted to be highly inhomogeneous, existing constraints have not ruled out that some regions of the Universe may have been reionized as late as z∼ 5 (e.g. McGreer et al. 2011), but as we show in this paper various data taken collectively suggest that the bulk of reionization occurred significantly earlier.
Some authors first convert the UV magnitude to a star formation rate, and then convert the star formation rate to a rate of production of ionizing photons. This however introduces extraneous steps.
This approximation is valid at z≥ 2, where the mean free path is much smaller than the Hubble scale.
Since the ionizing background spectrum is affected by filtering by the IGM, in general γ≠γbg (e.g. Haardt & Madau 1996; Faucher-Giguère et al. 2009).
This approximation (arising from the frequency dependence of the mean free path; equation 10) is valid at least up to z∼ 4, where the column density distribution has been measured to be well approximated by a series of power laws (Prochaska, O’Meara & Worseck 2010). However, it may break down at earlier times, where optically thick absorbers could be relatively more numerous and dominate the opacity. This provides additional motivation for focusing our post-reionization analysis at z= 4 (Section 4).
Consistency between star formation rate and stellar mass density measurements at  suggests that the IMF of reionization-epoch galaxies is not very different from the local Universe (Bouwens et al. 2011b).
REFERENCES
