


Abstract
From recent observations of z≳7 Lyα emitters (LAEs), a variety of Lyα luminosity functions (LFs) have been derived with contradictory results, either evolution or non-evolution from  , the epoch after reionization. This could be because most of the z≳7 LFs comprise photometric candidates, and these might include some contaminations. Using the Subaru telescope, we have conducted the Faint Object Camera and Spectrograph (FOCAS) narrow-band NB980 (λc∼ 9800 Å, FWHM ∼100 Å) imaging and spectroscopy survey of z= 7–7.1 LAEs in order to compare its ‘contamination-free’ result with the z≳7 photometric Lyα LFs that have previously been derived. We have imaged the Subaru Deep Field and the sky around the cluster MS 1520.1+3002. We have found one LAE candidate, but the spectroscopy did not reveal Lyα, although it was deep enough to detect this. We have calculated the expected number of LAEs in our survey, using five z= 7 and three z= 7.7 Lyα LFs from recent surveys. Seven of these are consistent with null detection (
 –
– LAEs) within errors, including Poisson statistics and cosmic variance. However, the average values (0.7–1.1 LAEs) predicted from one z= 7 and two z= 7.7 LFs among these seven indicate nearly a single detection. The remaining z= 7 LF predicts
  LAEs. As for z= 7, the discrepancy is likely to come from the different criteria used for LAE selection. For z= 7.7, there are two possibilities, as follows. (i) If z= 7.7 LAEs are somehow brighter in Lyα luminosity than lower-redshift LAEs, then a z= 7.7 LF is observed to be similar to or higher than lower-redshift LFs, even if attenuated by neutral hydrogen. (ii) All/most of the z= 7.7 candidates are not LAEs, which supports the decline of the LF from z∼ 6 to 7.7 and reionization at z∼ 6–7.7.
1 INTRODUCTION
Lyα emitters (LAEs) can be used to probe cosmic reionization, because their Lyα emission is absorbed or scattered by neutral hydrogen if the Universe is not completely ionized. This causes the Lyα luminosity function (LF) to decline as the fraction of neutral hydrogen in the intergalactic medium (IGM) increases (Rhoads & Malhotra 2001). From z= 3 to 5.7, the Lyα LF was observed not to evolve (e.g. Ouchi et al. 2008). Many authors have also constructed statistically large and uniform samples of z= 5.7 and 6.6 LAEs, with some candidates spectroscopically confirmed (Kashikawa et al. 2006; Shimasaku et al. 2006; Ouchi et al. 2008, 2010; Nakamura et al. 2011). They have found that the Lyα LF significantly declines from z= 5.7 to 6.6, suggesting that the Universe could be partly neutral at z= 6.6. The decline of the LF is further supported by the large spectroscopic samples that have recently been obtained by the independent observations of Hu et al. (2010) and Kashikawa et al. (2011). Meanwhile, Ota et al. (2008, 2010a) have found that the Lyα LF also declines from z= 5.7–6.6 to 7. These studies all imply that the neutral fraction might increase with redshift at z > 6.
Moreover, Hu et al. (2010) have noticed that the average Lyα equivalent width (EW) is slightly smaller at z= 6.6 than at z= 5.7. Kashikawa et al. (2011) have also found that the Lyα EW distributions of z∼ 3–5.7 LAEs are similar, but the EWs of z= 6.6 LAEs are smaller. Furthermore, some Lyman break galaxies (LBGs) are known to show strong Lyα emission, while some do not. The fraction of Lyα emitting LBGs increases from z∼ 3 to 6 (Stark, Ellis & Ouchi 2011), but then it suddenly drops from z∼ 6 to 7 (Pentericci et al. 2011; Ono et al. 2012; Schenker et al. 2012). The lower EW and Lyα LBG fraction at z > 6 could be a result of the rapid evolution of the neutral fraction from z∼ 6 to 7. This is consistent with the idea of the partly neutral Universe suggested by the decline of the Lyα LF.
Some authors have found a number of z= 7 and 7.7 LAE candidates, and they claim that the Lyα LF does not evolve from z= 5.7–6.6 to 7–7.7 (Hibon et al. 2010, 2011, 2012; Tilvi et al. 2010; Krug et al. 2012). Their results contradict the idea of late reionization at z < 7.7. Conversely, Clément et al. (2012) also surveyed z= 7.7 LAEs, but they did not detect any LAEs and they support the idea of reionization at z < 7.7. Interestingly, all the LFs that imply that there is no evolution at z≳6 are based on photometric samples. If they were to suffer some contaminations, the conclusion would be different. The best way to reveal this is to identify all the candidates by spectroscopy. However, this requires very expensive campaigns that can observe many candidates spread over different sky locations with sufficiently long integration to ensure the detection or non-detection of Lyα. Alternatively, a simpler but more indirect method is to conduct one imaging and spectroscopy survey and to compare its ‘contamination-free’ result with the photometric LFs.
Here, we use our imaging and spectroscopy survey of z= 7–7.1 LAEs for this purpose. We carried out this survey in 2003, using the Subaru telescope’s Faint Object Camera and Spectrograph (FOCAS; Kashikawa et al. 2002) and a narrow-band filter, NB980 (λc∼ 9800 Å, FWHM ∼ 100 Å; see Fig. 1), as the foundation for our subsequent larger z= 7 LAE surveys in 2005–2010 carried out by Iye et al. (2006) and Ota et al. (2008, 2010a). Because no detailed information about z∼ 7 galaxies was available in 2003, we selected LAE candidates with tentative colour criteria and we conducted spectroscopy of these. In this paper, we reanalyse the NB980 data and we refine the colour criteria, based on recent knowledge of z≳7 galaxies. Then, we select z= 7–7.1 LAE candidates and we see whether their spectra were taken in 2003 in order to derive a contamination-free result.
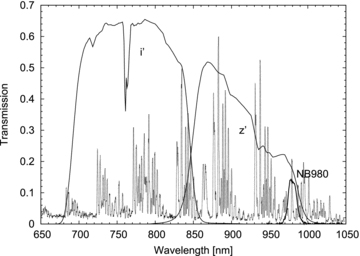
Transmission of the Subaru FOCAS NB980 and the Suprime-Cam i′ and z′ bands (solid curves). These curves include the CCD quantum efficiencies, the throughput of the telescope and instrument optics, and atmospheric transmission. The OH skylines are overplotted (dotted line).
In Section 2, we describe our imaging data. We select the LAE candidates in Section 3. In Section 4, we explain the result of follow-up spectroscopy. In Section 5, we compare our NB980 survey with previously derived z≳7 Lyα photometric LFs. We conclude in Section 6. Throughout the paper, we use an (Ωm, ΩΛ, h) = (0.3, 0.7, 0.7) cosmology and 2-arcsec aperture AB magnitudes, unless otherwise specified.
2 IMAGING OBSERVATION AND DATA
2.1 Broad-band and narrow-band images
The NB980 survey targeted the Subaru Deep Field (SDF; Kashikawa et al. 2004) and the sky region around the galaxy cluster MS1520.1+3002 (hereafter MS1520). For the SDF, broad-band BVRi′z′ and narrow-band NB816 (λc= 8150 Å, FWHM = 120 Å) and NB921 (λc= 9196 Å, FWHM = 132 Å) images were taken with the Subaru telescope’s Suprime-Cam (Miyazaki et al. 2002) by the SDF project, and the NB973 (λc= 9755 Å, FWHM = 200 Å) image by Iye et al. (2006). All the SDF images were convolved to have a common point spread function (PSF) of 0.98 arcsec. Limiting magnitudes at 3σ with 2-arcsec diameter apertures are (B, V, R, i′, z′, NB816, NB921, NB973) = (28.45, 27.74, 27.80, 27.43, 26.62, 26.63, 26.54, 25.47). The i′ and z′ images of MS1520 were also taken by the Suprime-Cam and these have PSFs of 0.66 and 0.83 arcsec, and limiting magnitudes (2-arcsec aperture, 3σ) of 27.33 and 25.74.
2.2 NB980 imaging and data reduction
We imaged the SDF and MS1520 with NB980 and FOCAS on 2003 May 7–8. The seeing was 0.7–1.2 arcsec. The 600-s exposures were dithered with a simple pattern to minimize loss of the survey area. First, every time each exposure was taken, the pointing was shifted by 2 arcsec in the RA direction. After repeating this eight (five) times for the SDF (MS1520), the pointing was returned to the original position in the RA direction but it was moved by 3 arcsec in the Dec. direction. We repeated this procedure three times. The total integration times were 4 h (SDF) and 2.7 h (MS1520).
We reduced the NB980 data in the same manner as in Takata et al. (2003). The dithered exposures were registered and combined to produce final stacked images of the SDF and MS1520 (hereafter NB980–SDF and NB980–MS1520), as shown in Fig. 2. This reduced the fringing, but slight residual remained in the stacked images. The standard star Hz44 (Oke 1990) was imaged during the observations to calibrate the photometric zero-points. These were NB980 = 30.27 mag ADU−1 for both NB980–SDF and NB980–MS1520. The PSFs and 2-arcsec aperture 3σ limiting magnitudes of NB980–SDF and NB980–MS1520 were 1.25 and 1.27 arcsec, and NB980 = 24.67 and 24.44, respectively. Assuming the minimum detectable rest frame Lyα EW of  Å (see Section 3.2), these magnitudes correspond to Lyα flux limits of FLyα∼ 1.2 and 1.4 × 10⁻¹⁷ erg s−1 cm−2 or Lyα luminosity limits of LLyα∼ 6.7 and 8.3 × 1042 erg s−1, respectively. The effective area imaged with the FOCAS and NB980 was ∼56 arcmin2 (SDF plus MS1520). The comoving distance along the line of sight corresponding to the redshift 7.0 ≤z≤ 7.1 probed by the NB980 was ∼29.1 h−1 Mpc. Hence, we surveyed a comoving volume of ∼104 Mpc3.
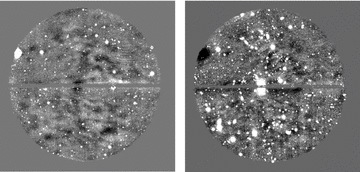
NB980–SDF (left) and NB980–MS1520 (right) images taken with two CCDs of the FOCAS. North is up and east to the left. The field of view is a circle of 6-arcmin diameter.
3 LAE CANDIDATE SELECTION
3.1 Photometry
We first matched astrometry and pixel scales of all the Suprime-Cam images to those of NB980–SDF and NB980–MS1520. Also, in order to select LAE candidates in Section 3.2, we convolved PSFs of the z′-band images to those of NB980–SDF and NB980–MS1520 to calculate z′− NB980 colour by measuring z′ and NB980 magnitudes with the same aperture. Then, we performed source detection and photometry with sextractor (Bertin & Arnouts 1996). The pixel scale of the NB980 images is 0.1038 arcsec pixel−1. We regarded an area larger than five contiguous pixels with a flux greater than 2σ as an object. We detected objects in NB980–SDF and NB980–MS1520 and we preformed photometry in other wavebands, using the double-imaging mode. The 2-arcsec diameter aperture magnitudes were measured with the mag_aper parameter and the total magnitudes with mag_auto. Finally, combining the photometry in all the wavebands, we constructed the NB980–detected object catalogues for the SDF and MS1520.
3.2 LAE criteria and candidate selection
Fig. 1 shows that the NB980 band is located at the red side of the z′ band. If the Lyman break of an LBG is redshifted into NB980, it results in a significant excess of z′− NB980. If the spectrum has Lyα emission, the excess is more significant. We used this characteristic to isolate z∼ 7 LBGs/LAEs. We examined the expected z′− NB980 colours of z∼ 7 LBGs/LAEs and we derived candidate selection criteria. We first created model spectra of LBGs that have the power-law continua fλ∝λβ with several different slopes β=−3, −2.5, −2, −1.5, −1 and 0. Then, we modelled the spectra of the LAEs by adding Lyα emission with rest-frame EWs of  , 50, 100, 150 and 300 Å. We did not assume any specific line profile or velocity dispersion. Instead, we simply added the total line flux value to the spectra at 1216 Å. Then, we redshifted the spectra to z= 0–8 and we applied Lyα absorption by the IGM, using the prescription of Madau (1995).
The colours of LBGs/LAEs were calculated using the model spectra and transmission curves of z′ and NB980 and these are plotted as a function of redshift in Fig. 3. For comparison, we also calculated the colours of E (elliptical), Sbc, Scd and Im (irregular) galaxies using the Coleman, Wu & Weedman (1980) template spectra. As can be clearly seen, LBGs ( ) and LAEs (
 20 Å) are expected to produce significant excess in NB980 against z′ at z∼ 7–7.1. Also, z∼ 1–3 ellipticals show modest excess as a result of the 4000-Å Balmer break. We adopted z′− NB980 > 2.5 as a criterion, which selects z∼ 7–7.1 LBGs/LAEs avoiding ellipticals. We used the following criteria to select LBG/LAE candidates:
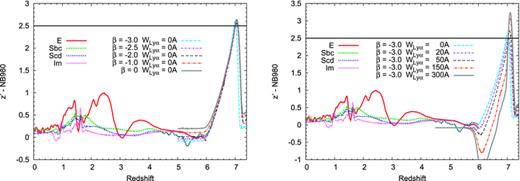
Redshift evolution of z′− NB980 colours of various galaxies. The colours of E (elliptical), Sbc, Scd and Im (irregular) galaxies were calculated using Coleman et al. (1980) template spectra. The colours of LBGs/LAEs were calculated using the spectrum fλ∝λβ for several UV continuum slopes β and Lyα EWs  . Left: the colours of LBGs (
 ), which show the excess of
  at z∼ 7–7.1 (horizontal line), but the maximum excess at z∼ 7–7.05 does not depend on β. Right: the colours of an LBG and LAEs with β=−3 are plotted as a representative, because Ono et al. (2010) suggest that z∼ 7 LBGs and z= 5.7 and 6.6 LAEs tend to have β≃−3. The LAEs clearly show the excess of z′− NB980 > 2.5 at z∼ 7–7.1, which we have adopted as the LAE selection criterion 3 (see Section 3.2). This criterion can detect both z∼ 7–7.1 LBGs (
 Å) and LAEs (
 Å).
Å).
NB980 ≤ 3σ limiting magnitude;
bands blueward of Lyα < 2σ and no object is seen visually;
z′− NB980 > 2.5;
NB973 < 2σ limiting magnitude and the object is seen visually (only for the SDF).
The first criterion is the object detection limit. Criterion 2 means non-detections in B, V, R, i′, NB816 and NB921 for the SDF and in i′ for MS1520. No object should be seen by eye in any of these bands because the flux blueward of Lyα should be absorbed by the IGM. This eliminates interlopers such as L/M/T-type stars and low-redshift galaxies such as Hβ, [O iii], [O ii], Hα or [S ii] line emitters. Criterion 3 is the NB980 excess, as explained above. In calculating the colour, if the z′ magnitude was fainter than 1σ, it was replaced by the 1σ value. Criterion 4 is NB973 < 25.9, which means a detection in NB973 whose bandpass targets z= 6.9–7.1 Lyα. We have the NB973 image of the SDF. Because the NB973 image is deeper than the NB980 image, any object detected in the NB980 image should be detected and visually seen in the NB973 image.
We have applied criteria 1–4 to the NB980–detected object catalogues. Then, we visually inspected the NB980 images of selected objects in order to remove obviously spurious objects, such as the tails of saturated pixels from bright stars, the haloes of bright stars, the noises of anomalously high fluxes at the edges of CCDs and the field of view, and the residual of fringing. As a result, one object remained in MS1520 (hereafter MS1520-A). Table 1 and Fig. 4 show its photometry and images.
Photometry of MS1520-A. Note that columns 3–5 (column 6) are 2-arcsec aperture (total) magnitudes. The limits are 1σ.
| RA (J2000) | Dec. (J2000) | i′ | z′ | NB980 | NB980 |
| 15:22:11.8 | +29:50:40.3 | >28.52 | >26.94 | 23.87 | 23.42 |
| RA (J2000) | Dec. (J2000) | i′ | z′ | NB980 | NB980 |
| 15:22:11.8 | +29:50:40.3 | >28.52 | >26.94 | 23.87 | 23.42 |
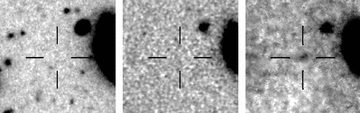
The 20 × 20 arcsec2i′, z′ and NB980 images (from left to right) of MS1520-A. North is up and east is to the left.
4 FOLLOW-UP SPECTROSCOPY
In our previous NB980 survey in 2003, we selected more candidates with more inclusive criteria z′− NB980 > 1.3 and 2σ limiting magnitudes. Then, we conducted spectroscopy on 2003 June 22–23 with multi-object slits and FOCAS. We confirmed that MS1520-A (selected in Section 3.2) had also been observed in 2003. At that time, we used a VPH950 grism (with a grating of 1095 lines mm−1 and a resolution of ∼2500) with an O58 order-cut filter (with a coverage of 580–1000 nm) and 0.8 arcsec slits. The integration time was 4 h, comprising six 2400-s exposures dithered along the slit by ±1 arcsec. The spectra of the standard star Feige 34 (Oke 1990) were also obtained and used for flux calibration. The data reduction was performed in the same standard manner as in Iye et al. (2006). We inspected the sky-subtracted stacked spectrum of MS1520-A and we could not identify Lyα emission, an ultraviolet (UV) continuum or any other spectral features.
4.1 Possibility that the candidate is an LAE
To see if we had enough depth to detect Lyα, we compared the sky background rms of the stacked spectrum with Lyα flux estimated from the NB980 magnitude. If we assume z= 7 and a rest-frame Lyα EW as low as  Å for the most severe case, ∼76 per cent of the NB980 flux comes from the Lyα line, and the total NB980 magnitude of MS1520-A, 23.42, converts to Lyα flux,
  erg s−1 cm−2. Ota et al. (2010b) estimated that the slit loss of the flux in the FOCAS spectroscopy of a z= 6.96 LAE, IOK-1 (Iye et al. 2006), is ∼35 per cent with a 0.8-arcsec slit under a seeing of 1 arcsec. We also used 0.8-arcsec slits for our spectroscopy, and the seeing was also ∼1 arcsec. If we apply this slit loss, the flux is
  erg s−1 cm−2. Meanwhile, we used a binning of four pixels (equivalent to 0.4 arcsec, which is smaller than the seeing of ∼1 arcsec) in the spatial direction to extract the one-dimensional spectrum of MS1520-A. By calculating the variance in the unbinned pixels in the dispersion direction at 9750–9850 Å (NB980 passband) in this spectrum, we estimated the sky rms to be 8.8 × 10⁻¹⁹ erg s−1 cm−2Å−1. For example, the FWHM of the Lyα line of a z= 6.6 LAE varies from 5.5 to 14.6 Å (Taniguchi et al. 2005; Kashikawa et al. 2006). If we assume that the FWHMs of z= 7 LAEs are similar, the Lyα flux is
  –1.3) × 10−17 erg s−1 cm−2. This is two to five times fainter than
  , deep enough to detect Lyα. Thus, MS1520-A is not likely to be an LAE.
4.2 Possibility that the candidate is an LBG
Another possibility is that MS1520-A is a z∼ 7 LBG. However, we could not see any faint continuum by eye on the two-dimensional spectrum or in the one-dimensional spectrum after the four-pixel binning in the spatial direction. To see if we had enough depth to detect the continuum, we compared the sky rms of the stacked spectrum with the UV continuum flux density estimated from the NB980 magnitude. If we assume a z= 7.05 Lyman break (i.e. all the NB980 flux is from the UV continuum at the red half of NB980, and zero flux otherwise), the total NB980 magnitude of MS1520-A, 23.42 and 35 per cent slit loss, converts to a UV continuum flux density,  erg s−1 cm−2Å−1. The sky rms of the one-dimensional spectrum, 8.8 × 10⁻¹⁹ erg s−1 cm−2Å−1, is 1.4 times shallower than
  , which is not enough to detect the continuum. Our spectroscopy does not reveal whether MS1520-A is a z∼ 7 LBG.
There is another way is to see if our NB980 imaging is deep enough to detect z∼ 7 LBGs. Ouchi et al. (2009) recently detected 22 z∼ 7 LBG candidates in the SDF and the GOODS-North field to the UV luminosity MUV=−21.0. If we assume that all the NB980 flux is from the UV continuum and that z= 7, our depths, NB980 = 24.67 (SDF) and 24.44 (MS1520), convert to MUV∼−22.3 and −22.5. To these limits, Ouchi et al. (2009) did not detect any LBGs. Hence, MS1520-A is not likely to be a z∼ 7 LBG.
4.3 Other possibilities
The other possibility is that MS1520-A is a late-type star, a variable/transient object or a noise. In the case of a late-type star, the spectrum would show no signal if the continuum was fainter than our spectroscopy limit. Because we have only one image blueward of Lyα (i′ band), the null detection criterion only on this band might not be strict enough to remove a faint late-type star. In the case of a variable/transient object, it could have been fainter than our detection limit at the time of the i′-band imaging and spectroscopy, while it might have been bright at the time of NB980 imaging.
Meanwhile, MS1520-A is not likely to be a low-z line emitter. If it were, its line flux would be as bright as the  estimated in Section 4.1, and detectable by the spectroscopy.
The purpose of this study is to obtain a contamination-free result for z∼ 7 LAEs, including null detection. We can safely conclude that we detect no z∼ 7 LAE in our survey volume and to our detection limit. We have used this information to assess z≳7 photometric Lyα LFs in the literature.
5 DISCUSSION
We have compared our null detection with the expected detection number of LAEs estimated from a variety of z= 7 and 7.7 photometric Lyα LFs, in order to check their consistency with the current contamination-free result.
5.1 Comparison with z=7 Ly![formula]() LFs
LFs
We have calculated the expected detection number of LAEs in our NB980 survey volume by integrating or interpolating Lyα LFs from four recent z= 7 LAE surveys (Ota et al. 2008, 2010a; Hibon et al. 2011, 2012) to our survey limits; these are listed in Table 2. The errors include the Poisson error for small number statistics and cosmic variance (see the table notes of Table 2 for details). For comparison, we have also calculated the expected number when there is no neutral hydrogen attenuation of Lyα emission (i.e. Lyα transmission to neutral hydrogen  ) by integrating such a z= 7 Lyα LF predicted by a recent LAE evolution model of Kobayashi, Totani & Nagashima (2007) to our survey limits. The expected numbers, estimated using LFs from Ota et al. (2008, 2010a) and one from the Hibon et al. (2012) survey fields (D33), are consistent with the null detection. Conversely, the number estimated using the Hibon et al. (2011) LF indicates the detection of
  LAEs. Also, although consistent with null detection within the error, the number,
  , estimated from another LF (D41) of Hibon et al. (2012), is larger than those estimated from other z= 7 LFs. This implies that LAE candidates detected by Hibon et al. (2011, 2012) might include some degree of contamination. We have compared the surveys of Ota et al. (2008, 2010a) and Hibon et al. (2011, 2012) and we have investigated the cause of the discrepancy.
Expected detection number of LAEs in the NB980 survey estimated from z= 7 and 7.7 Lyα LFs.
| Reference | Volumea (104 Mpc3) | Lyα flux limita (10−17 erg s−1 cm−2) | Number of LAEb candidates detected | Expected number of LAEs in NB980 surveyc | ||||||
| SDF | MS1520 | SDF+MS1520 | ||||||||
| z= 7 LAEs | ||||||||||
| This paper | 1.0 | 1.2–1.4 | 0 | – | – | – | ||||
| Ota et al. (2008) | 32 | 1.5d | 1 |  |  |  | ||||
| Ota et al. (2010a) | 30 | 0.97d | 3 |  |  |  | ||||
| Hibon et al. (2011) | 7.2 | 1.8e | 6 |  |  |  | ||||
| Hibon et al. (2012) D33f | 40 | 2.7d | 7 |  |  |  | ||||
| Hibon et al. (2012) D41f | 43 | 1.9d | 7 |  |  |  | ||||
| Kobayashi et al. (2007) | — | — | — |  |  |  | ||||
| z= 7.7 LAEs | ||||||||||
| Hibon et al. (2010) | 6.3 | 0.83 | 7 |  |  |  | ||||
| Tilvi et al. (2010) | 1.4 | 0.60 | 4 |  |  |  | ||||
| Krug et al. (2012) | 2.8 | 0.80 | 4 |  |  |  | ||||
| Reference | Volumea (104 Mpc3) | Lyα flux limita (10−17 erg s−1 cm−2) | Number of LAEb candidates detected | Expected number of LAEs in NB980 surveyc | ||||||
| SDF | MS1520 | SDF+MS1520 | ||||||||
| z= 7 LAEs | ||||||||||
| This paper | 1.0 | 1.2–1.4 | 0 | – | – | – | ||||
| Ota et al. (2008) | 32 | 1.5d | 1 | | | | ||||
| Ota et al. (2010a) | 30 | 0.97d | 3 | | | | ||||
| Hibon et al. (2011) | 7.2 | 1.8e | 6 | | | | ||||
| Hibon et al. (2012) D33f | 40 | 2.7d | 7 | | | | ||||
| Hibon et al. (2012) D41f | 43 | 1.9d | 7 | | | | ||||
| Kobayashi et al. (2007) | — | — | — | | | | ||||
| z= 7.7 LAEs | ||||||||||
| Hibon et al. (2010) | 6.3 | 0.83 | 7 | | | | ||||
| Tilvi et al. (2010) | 1.4 | 0.60 | 4 | | | | ||||
| Krug et al. (2012) | 2.8 | 0.80 | 4 | | | | ||||
aThe survey volume and limit are for the paper given in the first column.
bThe number of LAE candidates the authors have detected in their survey volumes and to their survey limits.
cThe expected detection number of LAEs in our NB980 survey, estimated using the Lyα LFs from the papers in the first column. For Ota et al. (2008), we integrated the inferred z= 7 Lyα LF in their fig. 10. The Lyα LF of Ota et al. (2010a) is based on the LLyα directly converted from the Lyα fluxes of their candidates. Ota et al. (2010b) estimated that ∼77 per cent of the NB973 total flux of a z= 6.96 LAE (IOK-1) is from Lyα. Hence, we interpolated the Lyα LF of Ota et al. (2010a) attenuated by 0.77 ×LLyα to our NB980 survey limits in order to obtain the expected number of LAEs. For Hibon et al. (2010, 2011, 2012), we integrated the Schechter (1976) LFs that they found were the best-fitted to their observed data. For Kobayashi et al. (2007), we integrated the  Lyα LF predicted by their model. For Tilvi et al. (2010) and Krug et al. (2012), we interpolated their Lyα LFs to our NB980 survey limits. The errors include Poisson errors for small number statistics (Gehrels 1986) and cosmic variance σv. We combined these errors quadratically, and if the lower limit was a negative value, then we adjusted it to zero. We calculated σv using the bias b= 3.4 obtained for LAEs by Ouchi et al. (2005) and the dark matter halo variances σDM at z= 6 predicted by the analytical model of Somerville et al. (2004) and our survey volumes. The values of σv are ∼48 per cent (∼54 per cent) for the survey volumes equivalent to two (one) FOCAS fields of view.
dThe Lyα fluxes are converted from their limiting NB973 magnitudes (5σ, 2-arcsec aperture), assuming a rest-frame Lyα EW of 20 Å and z= 7.
eThe Lyα flux is directly converted from the NB9680 magnitude of their faintest LAE candidate.
fThe Schechter parameters Φ* and L* for the LFs derived from the D33 and D41 fields in table 4 of Hibon et al. (2012) were found to be incorrectly listed. These are switched with each other (P. Hibon, private communication). We used their Schechter LFs with the correct parameters to estimate the expected LAE numbers.
Expected detection number of LAEs in the NB980 survey estimated from z= 7 and 7.7 Lyα LFs.
| Reference | Volumea (104 Mpc3) | Lyα flux limita (10−17 erg s−1 cm−2) | Number of LAEb candidates detected | Expected number of LAEs in NB980 surveyc | ||||||
| SDF | MS1520 | SDF+MS1520 | ||||||||
| z= 7 LAEs | ||||||||||
| This paper | 1.0 | 1.2–1.4 | 0 | – | – | – | ||||
| Ota et al. (2008) | 32 | 1.5d | 1 | | | | ||||
| Ota et al. (2010a) | 30 | 0.97d | 3 | | | | ||||
| Hibon et al. (2011) | 7.2 | 1.8e | 6 | | | | ||||
| Hibon et al. (2012) D33f | 40 | 2.7d | 7 | | | | ||||
| Hibon et al. (2012) D41f | 43 | 1.9d | 7 | | | | ||||
| Kobayashi et al. (2007) | — | — | — | | | | ||||
| z= 7.7 LAEs | ||||||||||
| Hibon et al. (2010) | 6.3 | 0.83 | 7 | | | | ||||
| Tilvi et al. (2010) | 1.4 | 0.60 | 4 | | | | ||||
| Krug et al. (2012) | 2.8 | 0.80 | 4 | | | | ||||
aThe survey volume and limit are for the paper given in the first column.
bThe number of LAE candidates the authors have detected in their survey volumes and to their survey limits.
cThe expected detection number of LAEs in our NB980 survey, estimated using the Lyα LFs from the papers in the first column. For Ota et al. (2008), we integrated the inferred z= 7 Lyα LF in their fig. 10. The Lyα LF of Ota et al. (2010a) is based on the LLyα directly converted from the Lyα fluxes of their candidates. Ota et al. (2010b) estimated that ∼77 per cent of the NB973 total flux of a z= 6.96 LAE (IOK-1) is from Lyα. Hence, we interpolated the Lyα LF of Ota et al. (2010a) attenuated by 0.77 ×LLyα to our NB980 survey limits in order to obtain the expected number of LAEs. For Hibon et al. (2010, 2011, 2012), we integrated the Schechter (1976) LFs that they found were the best-fitted to their observed data. For Kobayashi et al. (2007), we integrated the Lyα LF predicted by their model. For Tilvi et al. (2010) and Krug et al. (2012), we interpolated their Lyα LFs to our NB980 survey limits. The errors include Poisson errors for small number statistics (Gehrels 1986) and cosmic variance σv. We combined these errors quadratically, and if the lower limit was a negative value, then we adjusted it to zero. We calculated σv using the bias b= 3.4 obtained for LAEs by Ouchi et al. (2005) and the dark matter halo variances σDM at z= 6 predicted by the analytical model of Somerville et al. (2004) and our survey volumes. The values of σv are ∼48 per cent (∼54 per cent) for the survey volumes equivalent to two (one) FOCAS fields of view.
dThe Lyα fluxes are converted from their limiting NB973 magnitudes (5σ, 2-arcsec aperture), assuming a rest-frame Lyα EW of 20 Å and z= 7.
eThe Lyα flux is directly converted from the NB9680 magnitude of their faintest LAE candidate.
fThe Schechter parameters Φ* and L* for the LFs derived from the D33 and D41 fields in table 4 of Hibon et al. (2012) were found to be incorrectly listed. These are switched with each other (P. Hibon, private communication). We used their Schechter LFs with the correct parameters to estimate the expected LAE numbers.
Ota et al. (2008, 2010a) obtained the narrow-band NB973 images of the SDF and the Subaru/XMM–Newton Deep Survey (SXDS; Furusawa et al. 2008) field with one pointing of the Subaru Suprime-Cam each, reaching limiting magnitudes NB973 = 24.9 and 25.4 (5σ, 2-arcsec aperture). Meanwhile, Hibon et al. (2012) imaged two fields, called D33 and D41, with the same NB973 filter and one Suprime-Cam pointing each, and they reached limiting magnitudes NB973 = 24.3 and 24.7 (5σ, 2-arcsec aperture). Although the images of Hibon et al. (2012) are shallower than those of Ota et al. (2008, 2010a), they detected seven and seven LAE candidates in D33 and D41, respectively, while Ota et al. (2008, 2010a) detected one and three LAE candidates in the SDF and SXDS, respectively (see Table 2). Moreover, Hibon et al. (2011) imaged the COSMOS field with their narrow-band NB9680 (λc= 9680 Å, FWHM∼90 Å) to detect six LAE candidates, although their limit and volume are shallower and smaller than those of Ota et al. (2008, 2010a).
Meanwhile, the z= 7 LF of Kobayashi et al. (2007), with  , predicts the detection of
  LAEs even if the neutral fraction at z= 7 is 0 per cent. Because the Hibon et al. (2011, 2012) LFs predict
  –
– detections, whether or not the neutral fraction is 0 per cent, the difference in the expected number of LAEs between Hibon et al. (2011, 2012) and Ota et al. (2008, 2010a) cannot be explained by the field-to-field variation of the degree of Lyα attenuation by neutral hydrogen. In addition, because Hibon et al. (2012) and Ota et al. (2008, 2010a) surveyed similar and very large volumes, the cosmic variance and Poisson error are not the reason for the difference either. Moreover, because Ota et al. (2010a) probed to a much deeper limit than Hibon et al. (2011, 2012), if the difference in the dust extinction of all the z= 7 LAEs in different sky fields is E(B−V) < 0.06 (equivalent to the difference in survey depth), then dust extinction is also not likely to be the reason. For example, Ono et al. (2012) constrained the dust extinction of a spectroscopically confirmed z= 7.213 LAE to be E(B−V) ∼ 0.05. Although this is one example, the dust extinction of individual z∼ 7 LAEs seems to be modest. Thus, the difference in dust extinction among z∼ 7 LAEs could be even smaller. One remaining factor that causes the discrepancy between Ota et al. (2008, 2010a) and Hibon et al. (2011, 2012) is the different LAE selection criteria.
5.1.1 Effect of selection criteria on detection number
Hibon et al. (2011, 2012) did not consider the redshift evolution of the narrow-band excess of galaxies, while Ota et al. (2008, 2010a) did. The NB9680 and NB973 that they have used have FWHMs of 90 and 200 Å, and these are located at the red edge of the z′ band. This means that z < 7 LAEs/LBGs are also selected as candidates. For NB973, z≳6.4 Lyα emission with EWs of even  Å can produce a significant excess of
  , according to fig. 3 of Ota et al. (2008), which plots the redshift evolution of the z′− NB973 colours of model LAEs/LBGs generated with the population synthesis models of Bruzual & Charlot (2003). The same figure also shows that a z= 7 LAE/LBG is expected to have
  . We have also calculated z′− NB973 colour versus redshift, similar to Fig. 3 of this paper using spectra fλ∝λβ with β=−3 to 0 and
  to 300 Å. We have found that a z= 7 LAE/LBG is expected to have
  . For example, a spectroscopically confirmed z= 6.96 LAE (IOK-1; Iye et al. 2006) has a colour of z′− NB973 > 2.44. Ota et al. (2008, 2010a) adopted a slightly less strict criterion z′− NB973 > 1–1.72, considering the effects of photometric errors and the possible diversity of z= 7 LAEs on the colour. In principle, using this criterion, we can select z≳6.5 LAEs/LBGs. Hence, Ota et al. (2008, 2010a) imposed an additional criterion, a null detection in the narrow-band NB921 (λc= 9196 Å, FWHM = 132 Å), to avoid z= 6.5–6.6 LAEs/LBGs. Hence, using their criteria, we can select z≳6.7 LAEs/LBGs.
Meanwhile, Hibon et al. (2012) used an even more inclusive criterion z′− NB973 > 0.65, which unintentionally selects z≳6.4 LAEs/LBGs, and they did not have NB921 images to avoid z= 6.5–6.6 LAEs. Their sample includes four and six candidates with z′− NB973 ∼ 1–1.5 in the D33 and D41 fields, respectively. Some of these might be z= 6.5–6.6 LAEs, which Ota et al. (2008, 2010a) did not select. In fact, Ota et al. (2008) reported that if they did not impose null detection in NB921, they selected a spectroscopically confirmed z= 6.6 LAE IOK-3 with z′− NB973 ∼ 1.41 as a candidate. Besides, Hibon et al. (2011) adopted NB9680 −z′ < −0.75 without examining the redshift evolution of this colour of LAE. For the same reason as in the case of NB973, the sample of Hibon et al. (2011) might potentially include some lower-redshift LAEs/LBGs. If the candidates of Hibon et al. (2011, 2012) really include such contaminations, their real z= 7 Lyα LFs (after being corrected for the contaminations) could show evolution from z∼ 6. In this case, their LFs predict a more consistent number of LAEs in our NB980 survey.
5.2 Comparison with z=7.7 Ly![formula]() LFs
LFs
In Table 2, we have also listed the expected number of LAEs in our survey estimated using three z= 7.7 Lyα LFs (Hibon et al. 2010; Tilvi et al. 2010; Krug et al. 2012), assuming that the LF does not evolve from z= 7 to 7.7. All the expected numbers are consistent with null detection within errors. None the less, the average value 0.7–0.8 of the expected number ( –
– LAEs), estimated from the LFs of Tilvi et al. (2010) and Krug et al. (2012), is close to a single detection, which denotes evolution of the LF from z= 7 to 7.7. Actually, Tilvi et al. (2010) and Krug et al. (2012), and even Hibon et al. (2010), claim that if their candidates are all real z= 7.7 LAEs, their LFs imply a trend opposite to the decline of Lyα LF from z= 5.7 to 6.6 and 7 found by Kashikawa et al. (2011), Ouchi et al. (2010) and Ota et al. (2008, 2010a). Tilvi et al. (2010) and Krug et al. (2012) have also performed Monte Carlo simulations to estimate the expected number of LAEs in their surveys. They concluded that even if one or two candidates in their samples are real z= 7.7 LAEs, this implies no evolution of Lyα LF from z= 6.5 to 7.7. There are two possible scenarios to explain the situation.
The first scenario is that z= 7.7 LAEs might somehow be brighter than the z= 6.5 LAEs in Lyα luminosity. In this case, the z= 7.7 LF is observed to be similar to or higher than the z= 6.5 LF, even if it is attenuated by neutral hydrogen. There are two factors that potentially support this. First, stellar population studies of z∼ 6 massive (∼1010 M⊙) LBGs suggest that they could have had substantially high star formation rates in the past at z∼ 7–8 to assemble their high masses and that they could be very bright at z≳7 (Yan et al. 2006; Eyles et al. 2007). Also, narrow-band selected LAEs tend to be the lower-mass and younger-age extension of the LBG population and they might be at the earlier stage of the evolution of LBGs (Pirzkal et al. 2007; Lai et al. 2008). If z= 7.7 LAEs are the progenitors of z∼ 6 massive LBGs, they might be intrinsically very bright. Second, Hayes et al. (2011) have estimated the Lyα escape fractions  at z∼ 0–7.7 using observed data in the literature. They have found that
  increases with redshift when they fit a power law to
  ’s at z∼ 0–6. If
  is higher at z= 7.7 than at 6.5 in LAEs, then z= 7.7 LAEs are observed to be brighter.
Another scenario is that all the LAE candidates of Tilvi et al. (2010) and Krug et al. (2012) and all/some of the Hibon et al. (2010) LAE candidates are not z= 7.7 LAEs. This is in agreement with the decline of the Lyα LF from z= 5.7 to 6.6–7 found by Kashikawa et al. (2011), Ouchi et al. (2010) and Ota et al. (2008, 2010a). This scenario is supported by another z= 7.7 LAE survey carried out by Clément et al. (2012), who did not detect any candidates. As mentioned earlier, the drop in the fraction of Lyα-emitting LBGs at z > 6 (Pentericci et al. 2011; Ono et al. 2012; Schenker et al. 2012) could also support this scenario.
6 CONCLUSION
We have conducted the Subaru FOCAS NB980 imaging and spectroscopy survey of z= 7–7.1 LAEs in the SDF and MS1520. We have detected no LAEs to a 3σ Lyα flux limit of ∼1.4 × 10⁻¹⁷ erg s−1 cm−2 in a comoving volume of ∼104 Mpc3.
We have estimated the expected number of LAEs in our survey from five z= 7 and three z= 7.7 photometric Lyα LFs. Seven agree with null detection within errors, but the average LAE numbers predicted by one z= 7 and two z= 7.7 LFs among the seven indicate nearly a single detection. The remaining z= 7 LF predicts a detection of  LAEs. For z= 7, the discrepancy is likely to come from the different LAE selection criteria. For z= 7.7, there are two possibilities. (i) If z= 7.7 LAEs are brighter than lower-redshift LAEs, the z= 7.7 LF is similar to or higher than the lower-redshift LFs, even if attenuated by neutral hydrogen. (ii) If none of the z= 7.7 candidates is real, then the Lyα LF declines from z∼ 6 to 7.7.
Our evaluation of the z≳7 Lyα LFs relies on an indirect method. The direct and best way is secure spectroscopy of all the candidates. Future powerful telescopes, such as the James Webb Space Telescope or the Thirty-Meter Telescope, will facilitate this and reveal the real nature of Lyα LFs at the epoch of reionization.
This work is based on data collected at the Subaru telescope, which is operated by the National Astronomical Observatory of Japan. This work was supported by the Grant-in-Aid for the Global Center of Excellence (GCOE) Programme ‘The Next Generation of Physics, Spun from Universality and Emergence’ from the Ministry of Education, Culture, Sports, Science and Technology (MEXT) of Japan. We thank our referee for useful comments that have improved this paper. We thank Pascale Hibon, Nobunari Kashikawa and Takatoshi Shibuya for the information about the Hibon et al. (2012) paper.
REFERENCES
