


Abstract
We have developed a theoretical model for a physical understanding of the charging of ice grains in the plasma of Saturn’s E ring. The evaluated results are compared with the available observations and measurements from the Cassini, Hubble Space Telescope, Voyager and Pioneer campaigns. In this formulation, we implement the uniform potential theory, taking into account the size distribution of ice grains, in order to investigate the charging kinetics. The analysis is based on the number and energy balance of the constituents with inherent charge neutrality in the complex plasma system. In this paper, we incorporate pure ice as well as sodium-enriched ice particles. For computational purposes, we have considered only the plasma environment near the orbits of Saturn’s icy moons. As an interesting feature, the theory explains the observed range of potential on the ice grains in Saturn’s E ring. The available data on the plasma of Saturn’s E ring and the size distribution of ice particles have been used in the computations.
1 INTRODUCTION
Optical measurements (Nicholson, Showalter & Dones 1996) in the environment of Saturn’s E ring (≈3–8Rs) indicate the presence of micrometre-sized (≈0.3–3.0 μm) ice grains in this region. Cryovolcanoes on Enceladus are currently considered as the source of the ring particles (Horanyi et al. 2009). The heavy ionic plasma environment is attributed to the sputtering over the surface of the icy moon by sunlight and other cosmic as well as high-energy plasma particles (Cheng, Lanzerotti & Pirronello 1982; Richardson 1986;,Richardson, Eviatar & Siscoe 1986; Showalter, Cuzzi & Larson 1991; Kempf et al. 2006; Hillier et al. 2007). An analysis, based on an in situ experiment by the Cosmic Dust Analyser (CDA) mass spectrometer, indicates that the radius–brightness profile peaks at the Enceladus orbit (≈3.95Rs). This suggests that Enceladus is the source of the ring particles (Baum et al. 1981). Spahn et al. (2006) have presented overwhelming experimental evidence of the existence of the dust plume. Porco et al. (2006) have also reported an optical detection of the dust phase. The Pioneer and Voyager space campaigns (Spahn et al. 1999; Frank et al. 1980; Bridge et al. 1981, 1982) of Saturn’s satellites, and the laboratory sputtering experimental results, indicate the presence of heavy ion plasma (including electrons, ions and neutral species) in the E-belt region. Some recent publications (Wahlund et al. 2009; Farrell et al. 2010; Shafiq et al. 2011) have indicated that the surrounding environment in the vicinity of Enceladus is such that complex plasma effects should be considered. Hillier et al. (2007) have published the first measurements of the basic composition of the ring particles, which indicate the occurrence of pure ice grains in the plasma of the E ring. McBride et al. (2007) have concluded that the dust consists of water ice particles, with minor silicate impurities and possibly ammonia. However, in recent work, Postberg et al. (2009, 2011) have reported that 10 per cent of the ring particles are sodium-rich, while the remaining 90 per cent have traces of sodium. This might lead to the departure of the ring particle work function from that of pure ice. This analysis also incorporates dirty ice grains in the evaluation of the surface potential of the ice grains, by taking into account different work functions for almost pure ice particles and sodium-rich dirty dust particles. Kempf et al. (2005b) have concluded that the hypervelocity grains in the Saturnian system consist of silica (SiO2). More recently, Hsu et al. (2011) have shown that these particles act as nucleation seeds for the ring particles and that the majority of ring particles have tiny SiO2 cores.
Richardson et al. (1986) proposed a theoretical model that takes into account the inherent atomic processes responsible for the plasma environment in the Saturn E ring. The investigation included a comparative study of the steady-state plasma parameters, corresponding to the torus of Saturn’s icy moons. The plasma data analysis from Voyager has also indicated the anisotropic character of the ion distributions as a result of the asymmetry in longitudinal and transverse ion temperatures (Richardson & Eviatar 1988). However, for the analytical study in this paper, the ion distribution has been taken to be isotropic in nature. A good overview of the plasma environment of Saturn has been given by Richardson & Sittler (1990) and Richardson (1995), on the basis of both Voyager flybys. The model indicates that the heavy ions are confined to a narrow region near the equator while the protons are spread over higher latitudes. Furthermore, the transport properties (taking into account the inherent plasma chemistry) involved in the evolution of the plasma population as a function of latitude and radial distances have been theoretically modelled by Richardson (1992).
The observations of the large abundance of OH neutral species by the Hubble Space Telescope (HST) led Richardson et al. (1998) to review their earlier plasma model by taking OH neutral kinetics into account. In their modified plasma model, the OH neutral and corresponding ion densities were evaluated as a function of the radial distance. This agrees well with the data from HST observations. On the basis of the sputtering model of ice grains, Jurac, Johnson & Richardson (2001) have investigated the effect of sputtering on the ice grain population in Saturn’s E belt. They have concluded that the large population of submicrometre-sized ice grains is consistent with the data from HST observations (Richardson & Eviatar 1988). This study also suggests that the erosion rate of the spherical grains of the E ring should be much faster than that indicated in previously predicted results. For example, the theory estimates a lifetime of 50 yr for a 1-μm grain compared to earlier predictions of 103 yr (Haff, Eviator & Siscoe 1983) and 6 × 10⁶ yr (Morfill, Havnes & Goertz 1993). However, at present, a lifetime of 200 yr is generally predicted (Juhasz, Horanyi & Morfill 2007). This leads to the conclusion that the production rate of grains has to be much larger than was earlier expected to maintain the environment of the E ring. In one of their recent investigations, Sittler et al. (2005) have collated some of the preliminary results on Saturn’s inner plasma sphere, as observed by the Cassini Plasma Spectrometer (CAPS), and they have compared these results with the available data from the Voyager campaign. The proton and water group ion densities, the flow velocity and the corresponding temperatures were estimated, and it was concluded that the population of water group ions in the inner shells of the E ring was larger than that of protons.
In the plasma environment of the E ring, the dust particles acquire a charge as a result of the accretion of plasma particles on the surface and the photoelectric emission resulting from the solar ultraviolet radiation. Horanyi, Burns & Hamilton (1992) have analytically discussed the role that the charge of the particles has on the dynamics of grains generated from Enceladus, which are subject to electromagnetic forces. In this process, the radial dependence of the equilibrium potential over the grains was derived. In a recent investigation, Kempf et al. (2005a) highlighted the key role played by charged dust grains in the dynamics of the newly discovered high-speed dust streams from Saturn. Morfill et al. (1993) suggested that the self-sputtering phenomenon in the ice dust of the E ring contributes mainly to the plasma maintenance. The sputtered (water) molecules become dissociated and ionized, producing ionic components of the plasma. An ice grain charging model, including the accretion of electrons/ions and photoemission (Spitzer 1941; Sodha & Guha 1971; Mendis 2002; Sodha, Dixit & Srivastava 2009a; Sodha, Mishra & Misra 2009b,c) and secondary electron emission (Sternglass 1954; Meyer-Vernet 1982; Goertz 1989; Whipple 1981; Goree 1994), has been discussed in the elegant review by Horanyi (1996), and a steady-state dust potential as a function of radial distance was predicted. In their excellent review, Graps et al. (2008) indicated that the potential on the particles is negative for R < 4.89Rs and tends to positive values with increasing R. Thus, for R < 4.89Rs, the ultraviolet radiation does not play an important role. However, the number and the energy balance of the plasma constituents have been ignored in these studies. On the basis of previous observations, Hartquist, Havnes & Morfill (2003) speculated on the role of the charged dust in Saturn’s rings before the Cassini approach.
The in situ potential on the interplanetary dust grains (≈5 V) was first measured when Cassini was passing through the asteroid belt during its flight to Saturn’s rings (Kempf et al. 2004). Juhasz & Horanyi (2002) (also mentioned by Graps et al. 2008) have developed a theoretical model based on pre-Cassini data, considering all the individual currents towards the dust particles, in order to determine the charge on the dust grains in the planetary rings (specifically the D and E rings). They predicted that the dust potential in the E-ring grains lies in the range −7 ≤ϕd≤ 5 V. However, this investigation also ignores the number and energy balance of the complex plasma constituents. In a recent investigation, Kempf et al. (2006) have reported on the results of in situ measurements of the grain charge in the E ring by the CDA charge detector. As for direct measurements of the grain charge and potential, they concluded that the potential over the ice dust inside the orbit of Rhea was negative, whereas the grains outside Rhea’s orbit (≈8.75Rs) were at a potential of about +3.0 V.
On the basis of previous literature and the available data, in this paper, we present an investigation of the charging kinetics (Sodha et al. 2010a,c,d; Sodha, Misra & Mishra 2010b; Sodha, Mishra & Misra 2011a,b,c,d; Mishra, Misra & Sodha 2011) of the ice grains characterized by the observed size distribution (Juhasz & Horanyi 2002; Kempf et al. 2006) in the E-belt region at different radial distances, in particular near the environment of the orbits of Saturn’s icy satellites. In view of the recent work by Postberg et al. (2009, 2011), 90 per cent of the particles have been assumed to have a work function corresponding to that of pure ice, while the remaining 10 per cent (dirty ice grains) are assumed to have a lower work function. The present analysis incorporates the number and energy balance of the constituents. In view of our physical understanding of the environment of Saturn’s E ring, in the present investigation we have considered two types of neutral species [i.e. lighter hydrogen (H) and heavier water group neutrals (basically OH; Richardson et al. 1998)], the corresponding ionic species of protons (H+) and water group heavy ions (w ≡ O+, OH+, H2O+, etc.; Sittler et al. 2005) and cold and hot electrons (Kempf et al. 2006) along with ice dust grains (Richardson & Sittler 1990; Richardson 1995; Jurac et al. 2001; Kempf et al. 2006; Sittler et al. 2005). This E-ring region plasma is maintained (Richardson et al. 1986; Horanyi et al. 1992, Horanyi et al. 1996; Morfill et al. 1993) because of the ionization of neutral species (as a result of electron impact, charge exchange and photoionization processes) and electron–ion recombination. The accretion of the cold electrons and ionic species and the electron emission (because of photoelectric and secondary electron emission) are the basic electronic processes responsible for the charging of ice dust grains (Sodha et al. 2010a,b,c,d, 2011a,b,c,d; Mishra et al. 2011). Because of the high work function of the ice dust (Sodha et al. 2011d), only the extreme ultraviolet (EUV) spectrum of the incident solar radiation contributes to the photoemission of electrons. It is assumed that the solar spectrum of the incident radiation in Saturn’s E-ring region has the same spectral distribution as in near-Earth space, where 80 per cent of the incident photons in the EUV spectrum correspond to Lyman α (121.57 nm) radiation (Bauer 1973). Thus, only Lyman α radiation has been taken into accounted.
 and am, j for the whole range of radii of the particle size distribution are given by
Size distribution of dust in the plasma of Saturn’s E ring.
| Range of a (μm) | Max. nd (m−3) | arms (μm) | am (μm) | ||||
| s= 4 | s= 5.0 | s= 6.0 | s= 4 | s= 5.0 | s= 6.0 | ||
| 0.1–0.5 | 7.0 | 0.156 | 0.139 | 0.129 | 0.145 | 0.133 | 0.125 |
| 0.5–1.0 | 1.2 | 0.655 | 0.633 | 0.614 | 0.643 | 0.622 | 0.605 |
| 1.0–3.0 | 0.3 | 1.441 | 1.342 | 1.270 | 1.385 | 1.300 | 1.241 |
| 0.1–3.0 | 8.5 | 0.392 | 0.369 | 0.352 | 0.259 | 0.243 | 0.232 |
In this analysis, we have exploited the fact that particles of the same material (either pure or dirty ice), which have a size distribution in the complex plasma, exhibit a uniform electric potential (Sodha, Misra & Mishra 2010e; Sodha et al. 2011d) in the steady state, provided that the size effect of Mie scattering of light on the size is ignored. This can be understood as follows.
 and
and  are the rates of photoelectric and secondary electron emission, respectively, from the surface of the ice grains and
  ,
,  and
and  represent the accretion rates of cold electrons, protons and water group ions, respectively, on the surface of the ice grains. The parameters fph, j, ficp, j, ficw, j and fecC, j are well-known functions, given in Section 3.
We can conclude from equation (3a) that, in the steady state (t→∞), dZj/dt= 0, and hence the electric potential Vs, j(=Zje/a) over the spherical grains is independent of the radius a of the particle. The charge Ze on a particle is thus proportional to its radius a, and this is given by Zj(=aVs, j/e).
The values of the Mie factor for Lyman α radiation, corresponding to a= 0.1, 0.15 and ≥0.18 μm, are Qabs= 0.75, 0.94 and 1.0, respectively (Dorschner 1970). Hence, in view of the observed size distribution (very few particles with a < 0.15 μm) as listed in Table 1, it is a good approximation (e.g. Horanyi 1996) to consider the Mie factor to be unity over the whole distribution.
The expressions for the rate of electron emission from the dust particles and the accretion of electrons/ions on the surface of the particles are based on the assumption of a radially symmetric monotonically varying potential (irrespective of the analytical nature) around the particle. Even when the Debye radius is larger than the mean distance between the particles, the radially symmetric nature of the potential remains as such. If the number density of particles is large (which is by no means the case here), a much more rigorous and complex analysis is needed. The nature of the radial dependence of the potential changes tends to Gurevich screening (Tsytovich et al. 2008) for high number densities of particles. Hence, the phenomena that are dependent on tunnelling (i.e. field emission; Fowler 1955; Sodha & Guha 1971; Prakash 2010) and tunnelling accretion (Sodha, Misra & Mishra 2010f; Sodha & Mishra 2011) are affected. However, the emission/accretion phenomena, previously mentioned in this paragraph (which can be understood on a semiclassical basis), remain unaffected.
Furthermore, we also assume that the high-energy hot electrons contribute only to the secondary electron emission from ice grains (because of their impact) and that the number density and corresponding energy of the hot electrons remain unaltered. The estimation of the charge on the particles is based on the number and energy balance of the plasma constituents. However, as a simplification of the model, the temperature of the neutral species has been taken to be constant. Note that the electrical neutrality of the dusty plasma is inherent in the number balance and does not need to be taken into account separately for computational purposes. The data for the relevant plasma parameters (Table 2) have been collated from the available data from the Cassini, Voyager and Pioneer space missions and from HST observations (Richardson et al. 1986, 1998; Richardson & Sittler 1990; Richardson 1992, 1995; Jurac et al. 2001; Sittler et al. 2005).
Characteristic plasma parameters and evaluated potential over ice grains in the plasma environment of Saturn’s E ring.
| Plasma parameters | Orbit of satellite | ||||
| Mimas (3.08Rs) | Enceladus (3.95Rs) | Tethys (4.89Rs) | Dione (6.26Rs) | Rhea (8.75Rs) | |
| neC0 (cm−3) | 111.80 | 99.80 | 44.03 | 22.67 | 3.893 |
| neH0 (cm−3) | 0.20 | 0.20 | 0.40 | 0.40 | 0.30 |
| nip0 (cm−3) | 8.0 | 20 | 3.59 | 1.53 | 1.41 |
| niw0 (cm−3) | 104 | 80 | 40.84 | 21.54 | 2.78 |
| np0 (cm−3) | 8.23 | 45.82 | 69.44 | 24.53 | 24.59 |
| nw0 (cm−3) | 358.23 | 620.22 | 540.23 | 105.48 | 42.52 |
| TeC0 (eV) | 1.0 | 3.0 | 4.0 | 6.0 | 14 |
| TeH0 (eV) | 80 | 100 | 120 | 155 | 230 |
| Tip0≈Tp0 (eV) | 8 | 11 | 14 | 16.75 | 21.5 |
| Tiw0≈Tw0 (eV) | 13 | 40 | 80 | 109 | 210 |
| a (μm) | 0.1–3 | 0.1–3 | 0.1–3 | 0.1–3 | 0.1–3 |
| Observed potential (V) | −2 to −1 | −2 to −1 | −2 to −1 | −7 to +5 | ≈+ 3.0 |
| (Graps et al. 2008) | |||||
| Overall E-ring | Lies in between −7 and +5 | ||||
| observed potential (V) | (in good agreement with estimated values, as indicated in the figures) | ||||
| Estimated potential (V), | Vs1≈Vs2 | Vs1≈Vs2 | Vs1≈Vs2 | Vs1≈−1.2 to 0.2 | Vs1≈ 0.5 to 1.2 |
| based on the data of | ≈− 1.5 to −0.9 | ≈− 4.5 to −2.2 | ≈− 3.4 to −1.4 | Vs2≈−1.2 to 0.3 | Vs2≈ 0.7 to 2.1 |
| Graps et al. (2008) | |||||
| for s= 4, Y= 0.3 | |||||
| ϕ2= 7 eV and | |||||
| γ= 0.1–1.0 | |||||
2 ANALYTICAL MODEL
We consider the plasma of Saturn’s E ring (≈3–8Rs), which is illuminated by solar radiation and consists of cold (≈5 eV) and hot (≥50 eV) electrons, two different groups of singly charged ions [i.e. protons (p) and water group heavy ions (w ≡ O+, OH+, H2O+, etc.)] and neutral species (mainly OH and H) along with pure and dirty spherical ice dust particles. The dirty ice particles develop because of the inherent impurities of sodium and silicates and they are characterized by an effective work function lower than that of pure ice [i.e. ϕ (= 8.7 eV)]. The ice grains acquire a charge because of the accretion of the cold electrons and the ionic species on the surface of the ice grains and because of the photoelectric (a result of Lyman α radiation) and secondary electron (a result of the hot electron impact) emission from the surface of the ice grains.
2.1 Charging kinetics
In further analysis, we have utilized the concept of uniform potential theory (Sodha et al. 2010e) to write the basic equations governing the kinetics of ice particles in Saturn’s E region, as follows (Sodha et al. 2009c, 2010e, 2011d).
2.2 Constancy of neutral plus ionic species
2.3 Electron number balance
 . To simplify the analysis, the temperature dependence of βiy and αry has been ignored.
The first term on the right-hand side of equation (6) represents the net gain in electron density because of the ionization of neutral species and electron ion recombination in the plasma of Saturn’s E ring. The next term represents the net gain in electron density because of the emission and accretion processes on ice grains.
2.4 Number balance for ionic species
The first terms on the right-hand sides of equations (7a) and (7b) are the net gain in ion densities as a result of the ionization of neural species and the electron–ion recombination in plasma. The second terms represent the loss in equation (7a) and the gain in equation (7b) in the corresponding ion densities as a result of the charge exchange process. The last terms both equations correspond to loss in respective ion densities on account of their accretion over ice dust surface.
2.5 Charge neutrality
2.6 Energy balance for electrons
The first term on the right-hand side of equation (9) represents the power gained per unit volume by the cold electrons through ionization of the neutral species (atoms/molecules). The next term represents the energy loss per unit volume per unit time as a result of electron recombination with both protons and water group of ionic species in the plasma of the E ring. The last term is the net gain in energy per unit volume per unit time of cold electrons as a result of electron emission from ice dust and recombination of electrons on the surface of the ice dust grains. The loss resulting from the elastic collision between plasma constituents (electron–ion–neutral) has been ignored because of the small magnitude in comparison to other terms in this analysis.
2.7 Energy balance for ions
The first terms on the right-hand sides of equations (10a) and (10b) represent the power gained per unit volume by the protons through ionization of the neutral species. The second term denotes power loss per unit volume by the corresponding ions as a result of electron–ion recombination. The third terms represent power loss in equation (10a) and gain in equation (10b) per unit volume as a result of the charge exchange process between protons and the water group of ions. The last terms in both equations denote the energy loss of ions per unit volume per unit time of ions as a result of the accretion onto the surface of the ice dust grains (far from the surface).
2.8 Computational highlights
As a simplification, we assume that the temperature of the neutral species remains unaffected in the steady state. Furthermore, the temperature of the dust particles can be estimated by equating the solar radiation absorbed per unit time by the particle to the power lost by thermal radiation – other electronic processes do not play a significant role. For computational purposes, a typical value of Td= 130 K (for ice grains), corresponding to (αa/ɛ) ≈ 1.17, has been assumed, where αa is the absorptivity and ɛ is the emissivity of the dust. The results depend only slightly on Td.
For a chosen set of plasma parameters, we can obtain the steady-state potential on ice grains (Vs, j) and other parameters (i.e. neC, niy, ny, TeC and Tiy) by simultaneous numerical integration of equations (3), (5), (6), (7), (9) and (10) along with equation (11) and the appropriate expressions for other relevant parameters as t→∞; the steady state is indeed independent of the initial conditions.
3 RELEVANT EXPRESSIONS


 .
.
4 NUMERICAL RESULTS AND DISCUSSION
In this paper, we present a theoretical basis for our physical understanding of the charging of ice grains in the plasma of Saturn’s E ring. The characteristic charging (i.e. accretion and emission) currents corresponding to the dust particles depend on the plasma parameters (density, temperature and composition), grain potential and inherent dust properties (photoelectric and secondary electron yields, work function and size distribution function). In view of the open character (Vladimirov, Ostrikov & Samarian 2005; Tsytovich et al. 2008) of the complex plasma and the temperature dependence of the charging processes, the formulation incorporates charge neutrality, the balance of number density and the energy of electrons and ionic species. The kinetics has been developed on the basis of uniform potential theory, applicable to plasmas consisting of dust particles characterized by a size distribution function (as justified earlier in this paper). This theory predicts that the surface potential over dust grains of the same material is independent of size in the steady state, and hence all dust particles carry charges of the same sign with a magnitude proportional to the radius of the particles. We consider the plasma regions near the orbits of the E-belt icy satellites: Mimas (3.08Rs), Enceladus (3.95Rs), Tethys (4.89Rs), Dione (6.26Rs) and Rhea (8.75Rs). These consist of cold and hot electrons, hydrogen and water group neutral/ionic species and ice grains characterized by a power law of the size distribution. With regards to the recent understanding of ice grain composition in the E-ring plasma environment (i.e. 10 per cent sodium-rich impure ice grains along with the remaining 90 per cent of pure ice particles; Kempf et al. 2005b; Postberg et al. 2009, 2011), in this analysis we consider both pure and dirty ice grains. Because of the inherent impurities, the dirty ice grains are characterized by a work function slightly lower than that of pure ice. The impurity can also cause enhancement in the photoelectric yield – corresponding to photoelectron flux from an uncharged surface np=Y(ν)Λs(ν) – leading to the larger photoemission current responsible for the charging of ice grains.
The theoretical model for the kinetics of the E-ring region has been established on the basis of three basic assumptions: (i) the number and energy balance of complex plasma constituents; (ii) the solar radiation spectrum received by the plasma of the E-ring region is similar to that in near-Earth space; (iii) the hot (high-energy) electrons (in the form of cosmic rays) act as a source in the generation of secondary electrons, and in this process their number density and corresponding mean energy remain unchanged. The plasma generation resulting from the ionization of neutral species (by solar radiation, high-energy electron impact or charge exchange), electron–ion recombination, electron/ion accretion onto and electron emission (i.e. photoelectric and secondary) from the ice dust grains are the mechanisms considered here. The energy exchange associated with these processes has also been taken into account. Using observations from Cassini, the equilibrium dust potential in the E-ring plasma was estimated to lie in the range −7 ≤ϕd≤ 5 V (Graps et al. 2008). In particular, the CDA measurements have indicated that the ice dust is charged up to a potential of −2 and 3 V inside and outside the orbit of Rhea, respectively (Graps et al. 2008). Kempf et al. (2006) have stated that the charge on the ring particles is similar to that measured onboard Cassini by the Langmuir probe of the Radio and Plasma Wave Science (RPWS) investigations (Wahlund et al. 2005). Thus, it was estimated that the ice dust grains had a potential in the range of −2 to −1 V between 2.5Rs and 5Rs. In view of the available data, in this paper, we have attempted to explain the observed potential on the ice dust with an improved physical understanding of the kinetics of the complex plasmas of the E ring.
For computations, the relevant plasma parameters (listed in Table 2) have been selected from the available literature and data based on the Cassini, Voyager and Pioneer space missions and from HST observations (Richardson et al. 1986, 1998; Richardson & Sittler 1990; Richardson 1992, 1995; Jurac et al. 2001; Sittler et al. 2005). The number densities of hydrogen and water group neutrals and the corresponding ionic species have been taken from the model of the E-ring plasma environment, based on HST observations, proposed by Richardson et al. (1998), where the neutral and ion densities have been plotted as a function of the radial distance from Saturn. The number densities of the cold and hot electrons have been picked from an elegant paper by Richardson (1995), who has tabulated the equatorial plasma parameters for Saturn’s environment as a function of the radial distance from Saturn. Furthermore, the corresponding temperatures of electrons, ions and neutral species have also been gathered from the same paper (Richardson 1995). The coefficient of ionization and recombination has been extracted from Richardson et al. (1986), where the inherent atomic processes in the E-ring plasma environment have been discussed in sufficient detail. As a simplification, in the analysis, the temperature dependence of these coefficients has been ignored. The size distribution of the ice grains, which follow a power law, and the corresponding number densities of ice grains (as listed in Table 1) have been used for computational purposes. The incident photon flux (Λe≈ 3 × 1011 cm−2, corresponding to Lyman α radiation, just outside Earth’s atmosphere), which is responsible for photoemission from ice dust, has been taken from Bauer (1973), while the photoelectric yield is taken to be 0.1 (Graps et al. 2008). As discussed earlier, the Mie coefficient (Qabs) is almost unity for the whole range of sizes of dust particles. The data corresponding to secondary electron emission (i.e. yield δm= 1.5, optimum impact energy of electrons Em= 400 eV and the characteristic mean energy of the secondary emitted electrons Ese≈ 2.5 eV) have been collected from a recent review by Graps et al. (2008)– originally provided by Sternglass (1954). Table 2 gives the data set used for computational purposes to evaluate the potential of ice grains corresponding to the orbits of Saturn’s moons.
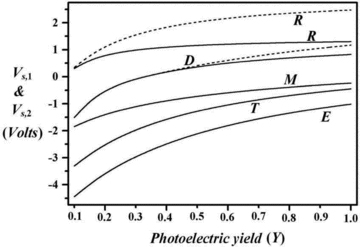
Fig. 1 illustrates the dependence of the surface potential (Vs) of pure and dirty ice grains on their number density (γ=nd/nd, max) in the plasma environment of the orbits of Saturn’s E-ring moons. We can see that the potential (i.e. the charge) on the ice particles increases (approaching positive values) with the increasing number density of the ice grains. Fig. 2 shows that increasing values of s correspond to smaller values of arms (i.e. the size distribution shifts towards smaller particles), which leads to a decrease in the dust potential towards negative values. An increase in the photoelectric yield significantly enhances the photoelectron flux from the ice grains, even for larger dirty ice particles. This means that the dust potential has more positive values, as displayed in Fig. 3. For a given value of np, the photoemission from negatively charged particles becomes independent of the material work function, and thus the lowering of the work function of dirty ice is largely concerned with the mean energy associated with photoemitted electrons rather than the photoemission current. This can lead to the large accretion of electrons over ice grains, and hence to an increased negative dust potential, as indicated in Fig. 4. However, because of the strong dependence of the photoemission current from positively charged grains on ξ[= (hν−ϕ)/kTd], the dust potential is significantly enhanced with the decrease of the work function of dirty ice, as shown in Fig. 4 for the environment of Rhea.

Dependence of ice dust surface potential (Vs) on the number density (γ) for s= 4, Y= 0.3, ϕ2= 7 eV and the tabulated plasma parameters in Table 2, in the orbits of Saturn’s satellites in the E-ring environment. The labels M, E, T, D and R on the curve denote the orbits of Mimas, Enceladus, Tethys, Dione and Rhea, respectively. The solid and dashed curves denote pure ice (Vs,1) and dirty ice (Vs,2), respectively.

Dependence of ice dust surface potential (Vs) on s. The parameters and labels on the curves have the same meanings as in Fig. 1.
Dependence of ice dust surface potential (Vs) on np. The parameters and labels on the curves have the same meanings as in Fig. 1.
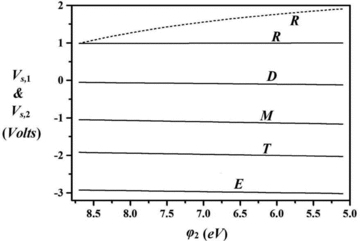
Dependence of ice dust surface potential (Vs) on the dirty ice work function ϕ2. The parameters and labels on the curves have the same meanings as in Fig. 1.
It is seen from the curves that in the steady state, the ice grains in the orbit of Mimas always acquire a negative potential, ranging from −1.8 to ≈−0.24 V for different sets of parameters. A similar trend is observed for the orbit of Enceladus, where ice grains acquire a negative potential in the range ≈−4.4 to ≈− 1.0 V, depending on np, ϕ and nd. The theory predicts that the ice particles acquire a negative potential (≈−3.4 to −0.5 V) in the orbit of Tethys, as shown in Figs 1–4. It is interesting to note that the ice particles in the inner region of the E ring (below ≈5Rs) are at a negative potential in the steady state, as indicated in the graphical representations of the results. This is usually expected in cold and dense plasma regions. This negative charge should cause a sharp reduction in the electron density. As shown in Table 2, these results (for a radial distance from Saturn of <5Rs) are in good agreement with the potential measured (≈−2 to −1 V) by the Langmuir probe of the RPWS onboard Cassini (Wahlund et al. 2005; Graps et al. 2008). The figures also show that the surface potential over ice dust grains is almost unaffected by the presence of impure ice in the inner region of the E ring (<5Rs). However, the surface potential differs significantly for pure and dirty ice grains in the plasma environment of the orbits of Dione and Rhea (>6Rs). This difference is more pronounced with increases in nd and Y and with a decreasing work function of dirty ice grains (ϕ2). In the orbit of Dione, the surface potential varies in the range ≈−1.5 to ≈+1.2 V, while the ice grains acquire positive potential (≈0.2–2.5 V) in the plasma environment of Rhea’s orbit. It is interesting to note that, in this theoretical study, we explain the positive potential (≈3 V) over the ice grains in the plasma environment of Rhea’s orbit, observed during the Cassini campaign, for a particular set of parameters, as indicated in Table 2. Furthermore, regarding the present theoretical predictions, the potential over ice grains lies between −4.5 and 2.5 V (as shown in Table 2), which can be compared with the observed equilibrium dust potential (−7 ≤Vs≤ 5 V) in Saturn’s E-ring region (Graps et al. 2008). The agreement is reasonable in view of the inherent uncertainties in the values of the parameters. It is possible to prove this agreement with a suitable choice of values for the parameters, but such an exercise is hardly meaningful.
5 CONCLUSIONS
We have developed the kinetics of the dusty plasma environment of Saturn’s E ring (near the moon’s orbits), which consists of dirty (sodium-rich) and pure ice grains. We have considered the accretion of electrons/ions onto and the photoelectric and secondary electron emission from the surface of the grains as significant mechanisms of dust charging. In view of the temperature dependence of the charging processes, the formulation incorporates charge balance, the balance of number density and the energy of electrons and ionic species. As an important feature, the theory successfully explains the observed potential on ice grains near the orbit of Rhea and the inner regions (<5Rs) of Saturn’s E ring. We can see from the figures that the observed electric potentials are close to those predicted, on the basis of the size distribution of dust particles given by Graps et al. (2008).
The authors are grateful to the reviewer, Dr S. Kempf, for several suggestions that improved the paper. They are also grateful to Professor M. P. Verma for valuable discussions and to the Department of Science and Technology, Government of India for financial support.
REFERENCES
