


Abstract
We analyse the historical optical light curve of the symbiotic system AG Draconis, covering the last 120 years. During the first 31 years the brightness of the star has not been varying by more than 0.1 mag. A weak periodic signal with the binary period of the system of ∼550 d can be detected in this section of the light curve, as well as in all other later quiescence sections of it.
Around the year 1922, the quiescence brightness of the star increased by 0.29 mag. Since then, the star’s photometric history is marked by a series of brightness fluctuations with an amplitude of 1–2 mag and a typical duration of 100–200 d. The time intervals between outbursts are integral numbers of the period 373.5 d. The outbursts are grouped in six dense clusters, each one lasting some 1500 d, which are well separated from one another along the time axis with a quasi-periodicity of 5300 d.
We suggest that the outbursts of the system are triggered by episodes of intense mass outflow from the atmosphere of the cool star on to the environment of the hot component. The 373.5 d cycle is the length of a ‘day’ on the surface of the giant that rotates in retrograde direction with a sidereal period of 1160 d. A weak signal with this periodicity is also present in the light curve. The modulation of mass transfer in the system is a combined effect of a dipole magnetic field of the giant star and the tides induced in its atmosphere by its binary companion. The 5300 d quasi-period is that of a solar-like magnetic dynamo process that operates in the outer layers of the giant. The combined effect of the 5300 and 373.5 d cycles induces a second mode of pulsation of the giant star with the period of 350 d.
AG Dra is the fifth symbiotic system that shows in its historical light curve this type of intense magnetic and magnetically induced activity.
1 INTRODUCTION
The star AG Draconis is one of the most intensively studied symbiotic systems. Nonetheless, its long-term light curve (LC), in quiescence as well as during its outburst episodes, is far from being well understood.
Photometric data of AG Dra, recorded since the year 1890, display several active phases, separated by quiescence periods. In quiescence, a small amplitude modulation is detectable in the B and V bands. In the U band, the variation amplitude is larger, ∼1 mag, and shows a periodicity of 554 d (Meinunger 1979). Three values are given in the literature for the orbital period of the system, as derived from radial-velocity data: 554.0 (Mikolajewska et al. 1995), 548.6 (Fekel et al. 2000b) and 550.5 (Friedjung et al. 2003).
Many optical eruptions have occurred since the first one recorded around 1930. Iijima (1987) suggested a 15-yr periodicity for outburst occurrence.
The presence of more than one periodicity in the LC of AG Dra is claimed by several authors. Bastian (1998), analysing the data base of the Association Francaise des Observateurs d’Etoiles Variables (AFOEV) covering the years from 1973 to 1997, claimed the presence of a ∼380 d period. This periodicity is also detected in the radial-velocity data compiled by Mikolajewska et al. (1995). Petrík et al. (1998) found P= 552 d during the quiet state, and P= 350 d during the activity state. Friedjung et al. (1998) detected three periods, 592 d in U, 356 d in B and 350 d in V, and suggested that the 350 d period could represent the cool giant’s pulsation. Gális et al. (1999) found two periodicities, 549.73 d and 355.27 d, in photoelectric and radial-velocity data.
In a more recent paper, Friedjung et al. (2003) reaffirmed the presence of a signal with a 357 d period in the radial-velocity curve of the star, and suggested again that the origin of this signal is in pulsations of the giant star of the system.
Motivated by the discovery of multiperiodicities in the LC of several symbiotic systems, BF Cyg (Leibowitz & Formiggini 2006), YY Her (Formiggini & Leibowitz 2006), Z And (Leibowitz & Formiggini 2008) and BX Mon (Leibowitz & Formiggini 2011), we have analysed the photometric behaviour of AG Dra, with the aim of examining the overall periodic content of the LC of this system.
In Section 2 we present the data sets used and the method used for constructing a consistent LC along the 120 years of observations. Section 3 describes the time series analysis and the periods detected. Section 4 discusses the proposed interpretation of the identified periods. In the summary we compare the results presented in this work with our past findings in the LCs of another four symbiotic systems: Z And, BF Cyg, YY Her and BX Mon.
2 THE DATA
The long-term LC of AG Dra is covered by two major data sources. One is the photographic estimates from the Harvard patrol plates, obtained between 1890 and 1966 (Robinson 1964, 1969). In our analysis, we used the data of table 6, 7 and 8 of Robinson (1969), spanning the interval from JD = 241 4787.644 to 243 9355.398. To this we added a few data in the B band from Belyakina (1969). These measurements were transformed to mpg using the few points in the overlapping portion with the LC of Robinson (1969).
The second large data set is the visual magnitude estimates collected by the American Association of Variable Stars Observers (AAVSO), covering the time interval from JD = 243 9584 to 245 5600.
Fig. 1(a) shows the raw data of our two major data sources, one on the left and the other on the right of the vertical line in the figure. The conspicuous large magnitude difference between them is obviously due to the different photometric systems of the two data sets.
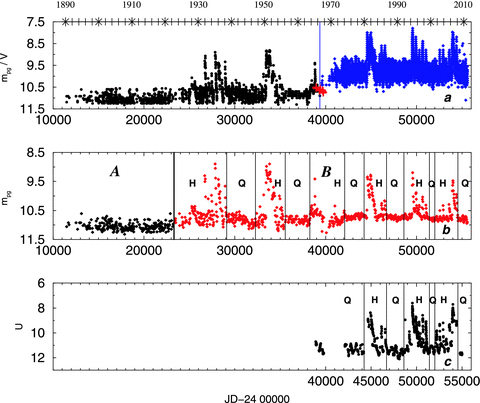
The LC of AG Dra, from the year 1890 up until 2011 February. (a) Raw data of the two main sources, Harvard plates mpg to the left of the vertical line and AAVSO visual data to its right. The crosses mark the few Belyakina (1969) data. (b) The LC scaled to a common colour system. The data are binned into 30 d equal width bins. A heavy vertical line marks the border between Sections A and B of the LC. Thin vertical lines separate Quiescence and High states of the system (see text for further explanations). (c) Photoelectric measurements in the U bandpass filter.
A few other data sets, mostly of photoelectric photometry measurements, have also been used by us, mainly for calibrating and establishing a common magnitude scale for the two major sets. This process is described in the next subsection. Note, however, that the major results of this work hardly depend on the calibration accuracy.
2.1 Scaling the data
In order to create one consistent LC, we had to find a reliable transformation between the photographic system of the Harvard patrol plates and the eye-visual estimates of the AAVSO data. Unfortunately, there is no overlap in time between these two sets of data. Skopal (2007) estimated that the emission line contribution to the star brightness in the V band amounts to ∼0.12 mag. The variability of emission lines in the AG Dra spectrum as well as the beginning of an activity phase of the system (see below) make the task of scaling more complicated.
Consequently, instead of applying the numerical relation between the earlier photographic magnitudes and the B and V magnitudes we adopted an empirical approach, taking advantage of the data collected by many campaigns of photoelectric observations of AG Dra, using them as a bridge between our two major sets. We retrieved all the V and B photoelectric data obtained from the year 1980 to 2011 (Burchi 1980; Meinunger 1981; Iijima 1987; Hric et al. 1991, 1993, 1994, 1996; Luthardt 1992; Skopal et al. 1992, 1995, 2002, 2004, 2007,; Montagni et al. 1996; Greiner et al. 1997; Skopal 1998; Gális et al. 1999; Leedjärv et al. 2004; Munari et al. 2009).
Four segments of quiescence state, which are contemporaneous with AAVSO data points, have been selected in the LC of the photoelectric data, namely 244 0680 < JD < 244 4200, 244 5613 < JD < 244 9105, 245 1142 < JD < 245 2105, 245 4555 < JD < 245 4892. We evaluated the empirical scale shift between the V photoelectric data and the eye-visual of the AAVSO data, calculating the weighted averages of the data in the four quiescence segments. Using the average (B−V) at quiescence, we transformed the V-scaled AAVSO data to B photoelectric magnitudes. Using the few simultaneous B and mpg data of Greiner et al. (1997), an empirical shift has been established for scaling the B data to the old Harvard photographic system.
With this procedure we transformed the AAVSO set to the scale of the mpg data. We have also calculated anew the empirical shift factor for the Belyakina (1969) data.
Fig. 1(b) shows the final resulting LC transformed to mpg passband. In this presentation we binned the data points into bins of 30 d width. We note, however, that the results of our following analysis are insensitive to any particular reasonable binning, including no binning at all, of this data set.
2.2 The two sections of the light curve
Two distinct sections are clearly identified in the LC as can be seen in Fig. 1(b). Section A, to the left of the heavy vertical line at JD 242 3300, consists of all the measurements performed earlier than that time. Section B comprises measurements performed later. No outburst has been recorded during the 11 800 d covered by Section A.
Section B is characterized by a sequence of major outbursts of the system, of an amplitude of 1 to 2 mag with a typical duration of some 100 d. These are grouped within six distinct clusters, well separated along the 32 280 d duration of this section. The thin vertical lines in Fig. 1(b) mark the borders between these clusters, to which we refer to as high (H) states of the system, and the time intervals, to which we refer to as the quiescence (Q) states. The results of our following analysis are insensitive to any reasonable variation in the position of these border lines.
The median magnitude of the Q LC of Section B is brighter by 0.29 mag than the median magnitude of Section A. The jump in the quiescence luminosity of the star around the year 1922 is not an artefact, being measured within the single consistent data set of the Harvard plates.
In general, we note that all results presented in this paper are independent of the scaling procedure presented in Section 2.1, because Section A consists entirely of data of the Harvard plates system and Section B is mostly the AAVSO data set. We obtained almost the same results as for Section B if we analyse only the AAVSO data.
2.3 The U light curve
We have also analysed a third data set of photoelectrical photometry measurements in the Johnson U band. The sources are Meinunger (1981), Taranova & Yudin (1982), Iijima (1987), Martel & Gravina (1985), Hric et al. (1991, 1993, 1994), Luthardt (1992), Skopal et al. (1992, 1995, 2002, 2004, 2007), Montagni et al. (1996), Greiner et al. (1997), Skopal (1998), Gális et al. (1999), Leedjärv et al. (2004) and Munari et al. (2009). Fig. 1(c) presents the U LC of the system. It covers the last two clusters of outburst events seen in the photographic LC shown in Figs 1(a) and (b). The structure of the two events is very similar in the two photometric bands. Here again we refer to quiescence (Q) states and high (H) states of the system as in Fig. 1(b).
3 TIME SERIES ANALYSIS
3.1 Section A and the quiescence states
Section A of the LC covers a time interval of 11 800 d during which the system was in a quiescence state, with no interruption by any outburst. The PS of this LC (Scargle 1982), shown in Fig. 2(a), has its highest peak at the period 546.5 d. This peak is higher than six times the standard deviation of the noise in the PS, but its false alarm probability (Scargle 1982) is not small. We consider it significant in view of the fact that a similar peak is present also in the PS of the independent Q LC of Section B, displayed in Fig. 2(c), at a frequency corresponding to 548 d. In the PS of the quiescence states of the U LC shown in Fig. 4(a), a similar peak, at a frequency corresponding to 547 d, is present, where it has a clear high statistical significance (see Section 3.3). Finally, the frequency of this peak coincides well within its uncertainty interval with the well-known binary period of the system.
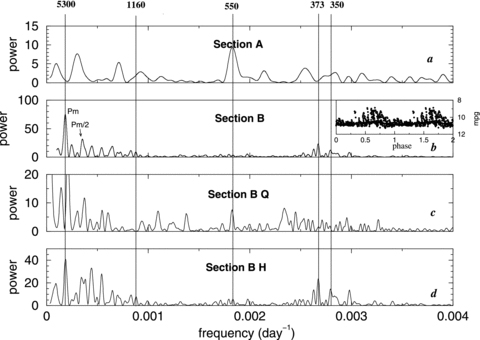
(a) Power spectrum (PS) of Section A of the LC. (b) PS of Section B. The inset shows the folding of Section B on to Pm= 5300 d. (c) PS of the quiescence segments of Section B. (d) PS of the outburst segments of Section B. Vertical lines show the five periods identified.
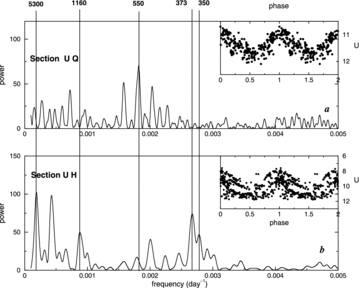
(a) PS of the quiescence U segments of the LC of AG Dra in the Johnson U band. The inset shows twice the Q U data folded on to the Pb period. (b) PS of the outburst U segments. The inset shows twice the H U LC folded on to the 373 d periodicity. Vertical lines are as in Fig. 2.
A second feature in the PS of Section A is a broad peak around the period of 350 d. Although this peak is not statistically significant within this PS, we draw attention to it, in view of its appearance in another independent LC, that of the PS of section B shown in Fig. 2(b), especially in the PS of the H states shown in Fig. 2(d). It is also clearly present in the PS of the H states in the U LC shown in Fig. 4(b) (see Section 3.3). It also coincides with a periodicity that was identified in the radial-velocity curve of the AG Dra system (Gális et al. 1999; Friedjung et al. 2003). The uncertainty in the value of this period is quite large, as apparent in the large width of the feature in the PS, due to interference with the 365 d periodicity in the timing of the observations. We refer to this period as Pp= 350 d.
3.2 Section B and the major six outbursts
Fig. 2(b) displays the PS of Section B of the LC in the period range 250–30 000 d. The major peak is around the frequency corresponding to the period 5300 d. Its false alarm probability (Scargle 1982) is less than 5 per cent. The second highest peak corresponds to its second harmonic. The inset shows twice the cycle of the B LC folded on to this periodicity. As apparent in the inset, as well as in Figs 1(a) and (b), the ∼5300 d cycle is a quasi-periodicity in the occurrence of the six clusters of outbursts along the last 88 years in the history of the star, referred to above.
The third highest peak in Fig. 2(b) corresponds to the period 373.4 d. The next highest peak to its left is an alias of it. It disappears from the PS when a ‘clean’ routine is applied on the data. The 373 peak is even more pronounced in the PS of H states shown in Fig. 2(d). The broad feature to the right of the 373 peak corresponds to the Pp= 350 d periodicity mentioned above.
3.2.1 Statistical tests and simulation
As a test of the statistical significance of the Pm∼ 5300 d period, we have developed, following Broadbent (1955, 1956, and references therein), a period search routine that finds the periodicity, or ‘quantum’, in the language of Broadbent, which fits best a set of given numbers. The time points among which we looked for a ‘quantum’ are the highest points in the six clusters of the H state of the system. We performed this search on various different binning of the LC, and the ‘quantum’ found is ∼5300 d, with a dispersion of the observed high points around the predicted times for a strict periodicity is some 450 d, or 0.085 in the phase space.
The 373 d periodicity in Section B of the LC is clearly far from being harmonic. Its Fourier signal is therefore rather weak. We therefore applied on the same data the ‘quantum’ search routine, which is especially suitable for finding a cyclic feature in a time series, regardless of the detailed structure of the time-dependent parameter of the series. Here the set of numbers for which a ‘quantum’ is looked for is the times of the highest points of the individual outbursts of the system that rise higher than 2.5σ of the magnitude population. This test enables also an evaluation of the statistical significance of the 373 d period.
We find a best-fitted period (‘quantum’) of Pa= 373.5 d. The dispersion is S= 49.34, which is 0.132 in phase. The time of the first peak is JD = 242 5249.03.
The high statistical significance of the 373 d period is confirmed by the value of the statistic  . Here N= 35 is the number of elements in the series of times of maximum brightness in individual outbursts of the star. As shown by Broadbent (1956) this inequality is indicating a very small false alarm probability for the 373 d period.
As an additional check, we have also conducted a ‘bootstrap’ (Monte Carlo) test of the robustness of the 373 d periodicity (Efron & Tibshirani 1993). On a sample of over 10 000 pseudo-observed bootstrap sets we have not obtained even one case with a dispersion that is as small as in the real data. Thus, the probability of false alarm is smaller than 1/10 000.
We performed the Broadbent period search technique and the accompanying test of statistical significance on the LC binned with various binning systems. These include also binning into bins with varying bin width. The results were insensitive to the binning system.
Fig. 3 is a zoom plot of the B LC. The dot–dashed vertical lines mark the peaks of individual outbursts that we determine by a computer selection routine, as well as by eye inspection of the data points of the LC. The vertical lines indicate the zero phase of the 373.5 d periodicity, nearest to each of the 35 selected peaks.
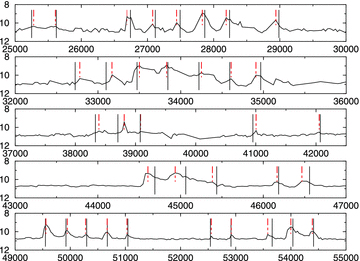
The 35 outburst peaks occurring in Section B. The lines indicate the zero phase of a 373.5 d period, and the dot–dashed lines show the time of maximum light of each outburst.
Fig. 3 shows that Pa= 373.5 d periodicity is preserved throughout the 32 800 d covered by the B LC.
3.2.2 The ∼350 d and the 1160 d periods
In Figs 2(b) and (d) one can identify a small peak that corresponds to the period 358 d that is also seen in Fig. 2(a), the PS of Section A. We identify it with Pa= 350 d periodicity, already mentioned above. This peak can also be clearly seen in Fig. 4(b), the PS of the entirely independent data set of the U LC of the system (see Section 3.3). The large variability in the exact peak position of this feature in the different PSa (power spectra) is due to interference with the nearby annual 365 d periodicity inherent in long-term ground-based observations.
Another small peak is marked in Figs 2(b) and (d), corresponding to the period Pr= 1160 d. It is not statistically significant within the PS of Section B. However, its conspicuous appearance in the PS of the independent data set of the U LC (Fig. 4b) implies with a high statistical probability that it does represent a true periodicity of the AG Dra system.
Application of a ‘clean’ PS routine on Section A and Section B data sets shows that within the signal-to-noise ratio level of the data, it is rather unlikely that any additional periodicity is hidden in the data, in particular any periodicity that might explain the residual variability that still remains in the LC after removing from it all the periods listed in Table 1. This was also confirmed by numerical tests that we performed, showing that adding one or a few periods, beyond those listed in Table 1. does not change the quality of the curve fitting in any significant way.
Peaks in the PSa.
| Name | Period (d) | Error | Measured period in individual LCs | ||||
| A | B-Q | B-H | U-Q | U-H | |||
| Pm | 5300 | Quasi-p | 5373 | 5310 | |||
| Pr | 1160 | ±40 | 1135 | 1130 | |||
| Pb | 550 | ±4 | 546.5 | 548 | 545 | 547 | |
| Pa= | 373.5 | ±1 | 373.7 | 373.6 | |||
| (1/Pb+ 1/Pr)−1 | |||||||
| Pp= | 350 | ±10 | 352 | 358 | 344 | ||
| (1/Pm+ 1/Pa)−1 | |||||||
3.3 The photoelectric U light curve
Fig. 1(c) presents the LC of the system as measured photoelectrically in the Johnson U band, extracted as described in Section 2.3. It covers the last two clusters of outburst events seen in the visual LC and shown in Figs 1(a) and (b), and having a very similar structure. Here again we refer to quiescence (Q) and the outburst-high (H) states.
Fig. 4(a) displays the PS of the U Q LC, and Fig. 4(b) that of its H section. The dominant peak corresponds to the period 547 d. The two satellites of the main peak are aliases of the 547 periodicity. The inset in Fig. 4(a) presents twice the Q LC folded on to this periodicity. The other high peak in Fig. 4(b), corresponding to the period 1357 d, results from the interference of the 550 periodicity, the 5300 d periodic gaps in the partial Q LC and the 365 d annual cycle: F(1357) =F(365) − [F(5300 +F(550)]. Here F(P) = 1/P.
Fig. 4(b) is the PS of the U-H LC. Here, in addition to the low-frequency peaks due to the window function of the broken LC, the dominant peaks correspond to the periods 373.6 and 1130.4 d. The inset displays twice the H LC in the U filter, folded on to the 373.5 d periodicity.
3.4 The periodic content of the LC
Table 1 presents a summary of our findings concerning the periodic content in the long-term LCs of AG Dra. There are five distinct periodicities that seem to dominate the temporal behaviour of the continuum emission of the system. They are the quasi-period 5300, and the periods 1160, 550, 373.5 and 350 d. The table presents our adopted value for each of these periods, and our estimated uncertainty in each one of them. Our error estimates are based mainly on the dispersions of the peak frequencies of the corresponding features in the different power spectra, and in the published literature. The last five columns in the table indicate at which particular LC each period is present and the numerical value it takes in each of the corresponding PS.
We note that all the variations that we are discussing in this paper can hardly be attributed to variation in emission lines. As noted already in Section 2, Skopal (2007) estimated that the emission line contribution to the star brightness in the V band amounts to ∼0.12 mag, while the main variations that are of our concern here are of the order of 1 mag. Furthermore, as Table 1 shows, all the periods discussed here appear to modulate the brightness of the system in two and even three different photometric broad passbands.
Table 1 also presents two numerical relations among the five periods of the system, which we shall discuss in the following sections.
4 DISCUSSION
4.1 The binary period
Spectroscopic observations in AG Dra have established its binary orbital period between 548.5 d and 554.0 (Mikolajewska et al. 1995; Fekel et al. 2000b). This periodicity has been also clearly identified in photometric measurements in the U photometric band (Meinunger 1979).
As described in Section 3.1 this photometric period is present also at the two additional independent LCs of Section A and of the quiescence states of Section B. It is not detected during the high state events. It is also present in the U Q LC (see Fig 4a).
For period between 550.5 and 552.5 d, the phasing of the three independent photometric LCs presented in this work agrees with each other to within less than 0.09 in phase space.
We have also considered the radial-velocity curve of the system, as presented by Mikolajewska et al. (1995) and Fekel et al. (2000b). The phase of maximum positive radial velocity for periods in the above period range is lagging by 0.25 to 0.3 in its value behind a weighted mean phase of minimum light of the corresponding three photometric LCs. Specifically, for P= 552.5 the phase difference is precisely 0.25. This is very much consistent with the ‘reflection’ model that has been proposed as an interpretation of the U binary LC (Kenyon 1986; Formiggini & Leibowitz 1990; Skopal 2001).
4.2 The other periodicities
As shown in Fig. 2(b) and Table 1, Section B LC is characterized by four periodicities. One is Pm∼ 5300 d, which is the characteristic quasi-periodicity in the occurrence of the six H states discussed in Section 3.2. The other three, Pa= 373.5 d, Pp= 350 d and Pr≃ 1160 d, seem to be the periods of three other cyclical processes that operate in the AG Dra stellar system, preserving their value as well as their phase throughout the time of the observations.
4.2.1 The rotation period of the giant
We suggest that the period Pr≃ 1160 d is the sidereal rotation period of the cool component of the AG Dra binary system. This is different from the estimation of the rotation period of the giant given by Zamanov et al. (2007). We note, however, that this estimate is based on a few assumptions and measured quantities that are far from being well established. They rely on the assumption that the axis of the giant rotation is normal to the binary plane, and they use an estimate of the radius of this star that is much in dispute in the literature (Huang, Friedjung & Zhou 1994; Mikolajewska et al. 1995; Greiner et al. 1997; Zhu et al. 1999).
Also, the uncertainty in the basic observational parameter of the projected equatorial radial velocity of the giant vr sin i itself is quite large (Fekel, Hinkle & Joyce 2004). According to Mikolajewska et al. (1995), strictly from observations, only an upper limit of the inclination angle of the orbital plane i(B) < 70° may be inferred. Also Kenyon & Garcia (1986), analysing the parameters of T CrB system, caution that vr sin i is not necessarily a true measure of the star rotation in such composite systems.
Some indirect evidence that 1160 d is the rotation period of the cool giant comes from the fact that it is absent from the LC of the system in the quiescence states, in the visual as well as in the U photometric bands (Sections 3.1 and 3.3). We shall argue below that the quiescence of the system is time intervals during which the magnetic activity in the outer layers of the giant is dormant. At this time the giant surface brightness is relatively uniform, with too few spots to enable identification of rotation by photometry. High states of the systems are times of highly intensive magnetic activity, accompanied, as in the Sun, by appearance of dark spots on the surface of the star. These are the features that enable photometric monitoring of the giant rotation.
Our suggestion that Pr≃ 1160 d is the giant rotation period makes AG Dra an exception in the claimed general trend of synchronization of the star rotation with the binary orbital revolution in symbiotic systems with orbital periods <1200 d (Zahn 1977; Zamanov 2011). However, in the calculations of Zahn (1977) it is assumed specifically that the amplitude of the tidal oscillations of the giant is small enough to justify linear treatment of the problem. In AG Dra, the oscillations need not be small due to the thick stellar wind of this star (Skopal 2001). Also the giant pulsations with the Pp= 350 d periodicity introduces mechanical and hydro and thermo-dynamical elements into the physical processes that are so far unaccounted for by present-day theory (see also Ogilvie & Lesur 2012).
The fact that rotation of the giant of AG Dra is not synchronized with the orbital revolution is not a unique one, also on a purely observational basis. There are in fact some other symbiotic systems that are far from synchronization (see e.g. fig. 1 in Zamanov 2011; Cikala et al. 2011).
4.2.2 The 350 d period
As already noted in Section 3.5, Friedjung et al. (2003) established a periodicity of ∼350 d in the radial velocity of the system which they have attributed to pulsations of the giant star. In this work we discovered the same period in the LC of the system. Fekel et al. (2000b) have objected to this interpretation on the ground that the amplitude of the radial-velocity oscillation with this period in AG Dra is much larger than those measured in pulsations of other single K giants with similar long periods.
We shall return to this point at the end of Section 4.3.
4.2.3 The 373-d periodicity
A major hint towards understanding the nature of the Pa= 373.5 d periodicity can be found in the numerical relation that exists among this period and the other two coherent periods of the system, namely FPa=FPr+FPb (Table 1). Here F= 1/P is the frequency corresponding to the period P. This is an expression of the fact that the period Pa in the occurrence of the major outbursts of the system is a beat of the binary period Pb and the giant rotation period Pr.
A similar case of the presence of a beat of the binary and the giant rotation periods has been recently found by us in the LC of another symbiotic system BX Mon (Leibowitz & Formiggini 2011). We propose that the interpretation that was given to the presence of the three periods in the LC of BX Mon is applicable also in the case of AG Dra.
If the giant star is rotating with the period Pr in the retrograde sense with respect to the binary revolution, the period Pa is the length of a ‘day’ for an observer on its surface, whose Sun is the hot component. Fekel et al. (2004) estimated that the radius of the Roche lobe of the giant is 141 R⊙. If the radius of the giant is indeed 70 R⊙ or more, as suggested by Greiner et al. (1997) and certainly if it is a supergiant, as suggested by Huang et al. (1994), its surface layers are quite deformed by the tidal force exerted by its companion. In particular, its deformation can be described to first approximation as a bulge in its atmosphere that circulates around the surface of star with its synodic diurnal period, namely with the period Pa (Lecar, Wheeler & McKee 1976).
4.3 The proposed scenario
We suggest that the giant star in the AG Dra system possesses a magnetic field, and that the axis of its dipole moment is inclined with respect to the rotation axis. Around the magnetic poles, due to the intensity and direction of the magnetic field lines, the hydrostatical equilibrium in the atmospheric layers is reached with material that is less bound by gravity than in areas where the magnetic field is weaker. Whenever the tidal bulge is crossing the area around one of the poles, equilibrium is broken and the giant is shading hydrogen-rich material on to the Roche lobe of the hot component. A large amount of gravitational energy is released in this process; some of it is translated into the form of outbursts in visible light. The amount of material that is being poured on to the hot component in each one of such an accretion event would depend on the intensity of the magnetic field at the time of the bulge sweeping, as well as on hydro and thermo-dynamical parameters that characterize the bulge in the giant atmosphere at that time. In particular, it will depend, for example, on the phase of the giant peculiar pulsation period Pp at the time of the mass transfer. In events of large mass transfer, hydrogen-rich material may also reach the surface of the white dwarf (WD) of the system, igniting or intensifying nuclear reaction on its surface. Such events may be responsible for the particularly large outbursts of the system.
This process has been termed ‘combination nova’ by Sokoloski et al. (2006), who studied it in details in their thorough analysis of photometric and a great deal of spectroscopic data, covering two outbursts of the symbiotic star Z And. Recently a great deal of spectroscopic data have been accumulated about AG Dra, in the optical as well in the UV and the X-ray regions of the spectrum (e.g. Shore et al. 2010). These provide a promising raw material for similar studies in AG Dra which may either confirm or perhaps refute the qualitative model that we are suggesting in this paper.
As an example, we examined the peculiar phenomenon discovered by Shore et al. (2010) that was termed by them as ‘bifurcation’ of the O vi Raman line in the bottom right frame of their fig. 2. We found that the six points that are responsible for this effect are measurements that were performed within less than 0.1 in phase according to the ephemeris of Pa= 373.5 (see Section 3.2.1). In fact, Shore at al. already pointed out that these points are associated with an outburst of the system. In view of our proposed cycle it will be interesting to check out whether or not this effect appears cyclically in the spectrum with the period of 373.5 d.
Also the classification of the outbursts of AG Dra into hot and cool types (González-Riestra et al. 1999) may be related to the difference that Sokoloski et al. (2006) have found between ‘combination nova’ and disc instability outbursts in the LC of Z And.
According to our suggested scenario, the quasi-periodicity of ∼5300 d in the occurrence of the outburst events is the period of a solar-like magnetic cycle that operates in the outer layers of the giant star. The quasi-periodicity of this cycle around 5300 is not unlike the well-known quasi-periodicity of the solar magnetic cycle which has the mean period of 4000 d (11 yr) but with individual cycles that vary between 3000 and 5000 d (Babcock 1961; Mursula & Ulich 1998; Fligge, Solanki & Beer 1999).
The mass transfer episodes from the giant with the Pa periodicity are most intensive when the intensity of the dipole magnetic field around the pole of the giant is highest: hence the 5300 d quasi-periodicity in the occurrence of the six clusters of outbursts in the history of the star.
The 373.5 d periodicity is a product of the parameters, the masses of the components, the radius of the giant, the inter-binary distance, and the angle between the rotation and the magnetic axes of the giant. All these are independent of the internal magnetic dynamo process in the giant, hence the independence of the 373.5 d periodicity from the 5300 d one.
According to this scenario, the brightening of the system by 0.29 mag around JD 242 3300 is also related to the commencement of the operation of the magnetic dynamo solar-like cycle in the outer layers of the giant, through some process that is yet unknown.
Mikolajewska et al. (1995) also suggested that the outbursts of AG Dra are powered mainly by nuclear runway on the surface of the WD of the system. These authors, however, were concerned about the fact that a continuous process of accretion of matter from the giant wind on to the WD may not be enough to fuel the eruptions of the system at the rate at which they are observed.
Our suggested scenario is very much in line with the Mikolajewska et al. idea. It adds a natural explanation for the cyclic nature of the outbursts. It also reveals the power source that is required in order to maintain the long-term energy budget of the proposed process. Wind accretion from the giant is indeed not enough. The outbursts are fuelled mostly by the flow of the large amount of giant material through the L1 point of the system, at epochs of intense magnetic activity in the giant’s outer layers.
Finally we note that the exceptionally large radial-velocity amplitude of the pulsation of the K giant of AG Dra (Fekel et al. 2000b) may be well understood in view of the relation F(373) +F(5300) =F(350) (see Table 1). What gives the oscillations of the K giant of AG Dra their exceptionally large amplitude is the combined effect of the 5300 quasi-periodicity of the magnetic dynamo operating within the giant, and the 373.5 period of its tidal oscillations. These two cycles beat with each other, augmenting in the giant its pulsations mode of the 350 d periodicity.
4.4 Comparison between BX Mon and AG Dra
It is interesting to compare our findings in the LC of AG Dra with those found by us in the LC of BX Mon (Leibowitz & Formiggini 2011). That star exhibits in its long-term LC a series of outbursts that take place with a periodicity of 1373 d which, as in AG Dra, is the beat of the binary and the giant rotation periods of that system. As in Section A of the LC of AG Dra, in BX Mon there is also a long-time interval during which the 1373 d periodicity in the occurrence of outbursts disappeared from the LC. But unlike the case in AG Dra, in BX Mon at that time, the 1373 period is being replaced by P= 1263 d, the binary period of the system. This difference between the two symbiotics finds a natural explanation within the framework of the scenario that we are suggesting.
The disappearance of the spin-orbit beat period from the LC in both cases could be due to a long minimum phase in the operation of the magnetic dynamo cycle within the giant star, reminiscence of the well-known Maunder minimum (Eddy 1976) in the history of the solar magnetic dynamo. At that minimum the dipole magnetic field of the giant is too weak to control the mass-loss rate from the giant. In BX Mon, where the eccentricity of the binary system is ∼0.5 (Fekel et al. 2000a), the cyclically varying distance between the two components of the system takes over in modulating the mass transfer rate in the system with the binary periodicity. In AG Dra the eccentricity of the system is ∼0 (Fekel et al. 2000b). Therefore, in the absence of the magnetic controlling process there is no other modulation mechanism for the mass loss from the giant, hence the lack of any outburst in Section A of the LC of this star.
5 SUMMARY AND THE GENERALITY OF THE PHENOMENON
AG Dra is the fifth symbiotic system in the historical LC of which we have discovered similar patterns of temporal behaviour. Here and in the other cases we interpret the findings as tracks of strong periodic activity, driven and modulated by three clocks in the system, the binary revolution, the giant rotation and a quasi-periodic, solar-like magnetic dynamo cycle in the outer layers of the giant star. Table 2 presents the periodicities and quasi-periods that we have uncovered in the LCs of these five symbiotics. The similarities in the corresponding periods seem to be quite remarkable.
Comparison of the properties of Z And, BF Cyg, YY Her, BX Mon and AG Dra.
| Z And | Ref. | BF Cyg | Ref. | YY Her | Ref. | BX Mon | Ref. | AG Dra | Ref. | |
| Giant Sp. type | M4 III | 1 | M5 III | 1 | M4 III | 1 | M5 III | 1 | K2 II | 3 |
| Binary period (d) | 759.0 | 5 | 757.3 | 6 | 593.2 | 7 | 1256 | 4 | 548.65 | 5 |
| Giant Spin period (d) | 482* | 8 | 798.8 | 6 | 551.4 | 7 | 656 | 9 | 1160 | 10 |
| Tidal wave period (d) | 1317 | 8 | 14580 | 6 | 7825 | 7 | 1373 | 9 | 373.5 | 10 |
| Solar-type period (d) | 7550 | 8 | 5375 | 6 | 4650 | 7 | 7370 | 9 | 5300 | 10 |
(*) This is a slightly preferred number among four possible values.
(1) Mürset & Schmid (1999), (2) Mürset et al. (1991), (3) Zhu et al. (1999), (4) Fekel et al. (2000a), (5) Fekel et al. (2000b), (6) Leibowitz & Formiggini (2006), (7) Formiggini & Leibowitz (2006), (8) Leibowitz & Formiggini (2008), (9) Leibowitz & Formiggini (2011) and (10) This paper.
We acknowledge with gratitude the variable star observations from the AAVSO International Database contributed by observers worldwide and used in this research. We thank the referee, Dr. Steven Shore, for some very helpful comments.
REFERENCES
