


Abstract
We examine to what extent the inferred surface temperature of magnetars in quiescence can constrain the presence of a superfluid in the neutron star core and the role of magnetic field decay in the core. By performing detailed simulations of neutron star cooling, we show that extremely strong heating from field decay in the core cannot produce the high observed surface temperatures nor delay the onset of neutron superfluidity in the core. We verify the results of Kaminker et al., namely that the high magnetar surface temperatures require heating in the neutron star crust, and crust heating is decoupled from cooling/heating in the core. Therefore, because crust heating masks core heating, it is not possible to conclude that magnetar cores are in a non-superfluid state purely from high surface temperatures. From our interior temperature evolutions and after accounting for proton superconductivity in the core, we find that neutron superfluidity in the core occurs less than a few hundred years after neutron star formation. This onset time is unaffected by heating due to core field decay at fields ≲1016 G. Thus all known neutron stars, including magnetars, without a core containing exotic particles, should have a core of superfluid neutrons and superconducting protons.
1 INTRODUCTION
Neutron stars (NSs) begin their lives very hot (with temperatures T > 1011 K) but cool rapidly through the emission of neutrinos. Neutrino emission processes depend on uncertain physics at the supra-nuclear densities (ρ > ρnuc≈ 2.8 × 10¹⁴ g cm−3) of the NS core (see Tsuruta 1998; Yakovlev & Pethick 2004; Page, Geppert & Weber 2006, for review). Current theories indicate that the core may contain a neutron superfluid and proton superconductor or even exotic particles, such as hyperons and deconfined quarks (see e.g. Lattimer & Prakash 2004; Haensel, Potekhin & Yakovlev 2007, for review). The recent observation of rapid cooling (Heinke & Ho 2010; Shternin et al. 2011) of the NS in the Cassiopeia A supernova remnant provides the first constraints on the critical temperatures for the onset of superfluidity of core neutrons Tcnt (in the triplet state) and protons Tcp (in the singlet state), i.e. Tcnt≈ (5–9) × 108 K and Tcp∼ (2–3) × 109 K (Page et al. 2011; Shternin et al. 2011).
Anomalous X-ray pulsars (AXPs) and soft gamma-ray repeaters (SGRs) form the magnetar class of NSs, i.e. systems which possess superstrong magnetic fields (B≳ 1014 G),1 and their strong fields likely power the activity seen in these objects (see Woods & Thompson 2006; Mereghetti 2008, for review). One notable property of magnetars is that their observed surface temperatures Ts in quiescence are significantly higher than those of other NSs of a similar age. In fact, they are too high for NSs that cool passively, i.e. without an additional source of internal heat (accretion heating can be excluded by, e.g., non-detections of binary companion or disc emission). An interesting problem concerns the heat generated from magnetic field decay, which has been proposed to be the source for the high temperatures of magnetars (Thompson & Duncan 1996; Heyl & Kulkarni 1998; Colpi, Geppert & Page 2000; Aguilera, Pons & Miralles 2008b). This heat can strongly influence the time/age at which the core becomes superfluid if heating/field decay occurs in the core (Thompson & Duncan 1996; Arras, Cumming & Thompson 2004; Dall’Osso, Shore & Stella 2009). The problem is important since the presence of superfluid components has a strong impact on magnetar interior dynamics, such as the mechanism for producing glitches (see e.g. Sauls 1989), fluid oscillations (see e.g. Passamonti & Andersson 2011), magnetic field and rotational evolution (see e.g. Glampedakis & Andersson 2011), and magnetohydrodynamical equilibrium (Glampedakis, Andersson & Lander 2012; Lander Andersson & Glampedakis 2012).
We address this problem by conducting detailed calculations of the thermal evolution of a NS with various prescriptions for an internal heat source that can be associated with magnetic field decay. We show that, regardless of the magnetic field strength and detailed mechanism for field decay in the core, the heat generated by the decay is insufficient to power the surface emission of magnetars. Furthermore, by accounting for the effects of proton superconductivity on field decay, we find that this core heating is not strong enough to balance neutrino cooling and cannot delay the onset of core neutron superfluidity for fields ≲1016 G (onset at age ≲ a few × 100 yr). Thus the cores of all currently known magnetars should be in a superfluid state.
We briefly describe past works and note key findings and assumptions made in these works that we improve upon here. Arras et al. (2004) consider coupled magnetic field decay and thermal evolution of magnetars. The internal field and superfluid temperatures are assumed to be >1015 G and Tcp= 5 × 10⁹ K and Tcnt= (5 − 9) × 108 K, respectively. Arras et al. (2004) find that magnetic field decay can delay the transition to core neutron superfluidity and maintain a relatively high surface temperature to ages ≈103–105 yr, depending on Tcnt. However, their calculation only considers volume-averaged quantities and thus assumes that the NS interior is isothermal (see Section 2.2), which cannot be the case if there is a localized heating source, such as field decay in the crust or core, due to the large but finite thermal conductivity of NS matter.
Kaminker et al. (2006) calculate the evolution of the temperature profile [i.e. T(ρ)] by solving the energy balance and flux equations (see equations 2 and 3). They demonstrate that, in order to explain the observed high surface temperatures, magnetars require a heat source and, most importantly, this heat source (e.g. from field decay; Pons, Miralles & Geppert 2009) must be located in the outer crust; if the heat source is located too deep in the NS interior (e.g. in the core), then neutrino emission efficiently removes the heat locally, and the surface temperature cannot be increased sufficiently to match the observed values. Furthermore, the outer crust is thermally decoupled from the core so that heating of the crust does not affect (neutrino) cooling of the core. Because of this thermal decoupling, the results and conclusions of Kaminker et al. (2006) are not particularly sensitive to the state of matter in the core, e.g. superfluidity of the core nucleons. Although no quantitative results are shown, Kaminker et al. (2006) state that cooling calculations with the effects of inner crust superfluidity and neutrino emission by Cooper pair formation produce different temperature profiles, but these effects do not change the surface temperature. In a follow-up work, Kaminker et al. (2009) improve their calculations and examine the effects of light-element-accreted envelopes and anisotropic heat conduction due to the magnetic field in the envelope and outer crust. While accreted envelopes can give higher surface temperatures for the same core temperatures, core heating is still unable to produce surface temperatures that are high enough to explain magnetar observations.
Dall’Osso et al. (2009) criticize the work of Kaminker et al. (2006), arguing that the phenomenological heating model considered is independent of the magnetic field and decays on the wrong time-scale (see equation 16) and that the correct heating should depend inversely on temperature. This last point implies that more heat is generated at lower temperatures and can lead to an equilibrium between neutrino cooling and heating from field decay (see also Thompson & Duncan 1996). The equilibrium temperature (above 109 K) can be maintained for ≈104 yr. The results of Dall’Osso et al. (2009) suggest that the core of magnetars is not superfluid until after this time, since the critical temperature for the onset of neutron superfluidity is (5–9) × 108 K (Page et al. 2011; Shternin et al. 2011). However no cooling calculation is performed by Dall’Osso et al. (2009).
Here, we perform NS cooling simulations to determine the role of core heating by magnetic field decay. We do not examine in detail field evolution and heating in the crust (see e.g. Pons et al. 2009). Rather we use the phenomenological model of Kaminker et al. (2006, 2009) to demonstrate the effect of crust heating on the NS cooling behaviour. This will be adequate for our purposes since the goal here is to assess the importance of core heating in magnetars. As we will show, as long as the magnetic field decay time is longer than the cooling time, the core heating we use is the maximum one can use. While this maximal heating can delay the onset of neutron superfluidity (on the time-scale estimated by Thompson & Duncan 1996; Dall’Osso et al. 2009), it cannot reproduce the high surface temperatures seen for magnetars. We arrive at this same conclusion using the prescription for heating and field decay given in Dall’Osso et al. (2009). Furthermore, the above works neglect the effects of proton superconductivity; when this is taken into account, there is no delay in superfluidity onset for any reasonable core magnetic field strength. In Section 2, we describe the thermal evolution equations and input physics, including superfluid properties and prescriptions for internal heat sources. Section 3 presents the results of our calculations. We summarize our results and discuss their implications in Section 4.
2 NEUTRON STAR COOLING MODEL
2.1 Core and crust composition
 and ni is the ion number density] at which melting occurs.
2.2 Equations for neutron star cooling
2.3 Superfluid properties
Superfluidity has two important effects on neutrino emission and NS cooling: (1) suppression of heat capacities and emission mechanisms, like modified Urca processes, that involve superfluid constituents and (2) enhanced emission due to Cooper pairing of nucleons when the temperature decreases just below the critical value (see Yakovlev & Pethick 2004; Page et al. 2006 for review).
 and nx are the Fermi momentum and number density, respectively, for particle species x and Δ0, k0, k1, k2, and k3 are fit parameters for particular superfluid gap models given in Andersson, Comer & Glampedakis (2005) (see also Lombardo & Schulze 2001; Kaminker, Yakovlev & Gnedin 2002). For singlet neutrons in the crust, we use model a, which represents the results of Wambach, Ainsworth & Pines (1993). For singlet protons in the core, we use a model that is similar to Chen et al. (1993) (see also Page et al. 2004). We consider two cases for triplet neutron pairing in the core. Either the pairing is the ‘shallow’ model l, which represents the results of Elgarøy et al. (1996), or the pairing is a ‘deep’ model. The deep model is a Δ that produces a Tcnt(ρ) similar to what is needed to fit the observed surface temperature of the neutron star in Cassiopeia A and neutron stars that are old and hot (Gusakov et al. 2004, 2005; Shternin et al. 2011). The parameters for the superfluid gap energies are given in Table 1, and the gap models are illustrated in Figs 1 and 2.
Phenomenological parameters for superfluid gap energy.
| Proton singlet | Neutron singlet | Shallow neutron triplet | Deep neutron triplet | |
| Δ0 (MeV) | 120 | 68 | 0.068 | 0.15 |
| k0 (fm−1) | 0 | 0.1 | 1.28 | 2 |
| k1 (fm−2) | 9 | 4 | 0.1 | 0.1 |
| k2 (fm−1) | 1.3 | 1.7 | 2.37 | 3.1 |
| k3 (fm−2) | 1.8 | 4 | 0.02 | 0.02 |
| Proton singlet | Neutron singlet | Shallow neutron triplet | Deep neutron triplet | |
| Δ0 (MeV) | 120 | 68 | 0.068 | 0.15 |
| k0 (fm−1) | 0 | 0.1 | 1.28 | 2 |
| k1 (fm−2) | 9 | 4 | 0.1 | 0.1 |
| k2 (fm−1) | 1.3 | 1.7 | 2.37 | 3.1 |
| k3 (fm−2) | 1.8 | 4 | 0.02 | 0.02 |
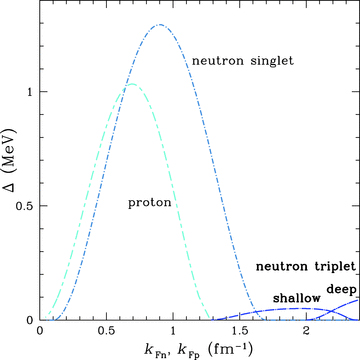
Superfluid gap energies (left: singlet; right: triplet) as a function of Fermi wavenumber for neutrons kFn and protons kFp. The neutron singlet (dot–short-dashed) model is from Wambach et al. (1993); the proton singlet (dashed) model is similar to Chen et al. (1993) and the neutron triplet (dot–long-dashed) model is either a shallow model from Elgarøy et al. (1996) or a deep model similar to Shternin et al. (2011).
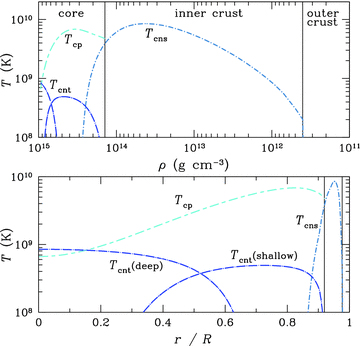
Superfluid critical temperatures as a function of density (top panel) and normalized stellar radius (bottom panel). Critical temperatures Tcns (dot–short-dashed), Tcnt (dot–long-dashed) and Tcp (dashed) are for neutron singlet, neutron triplet and proton singlet, respectively. Neutron triplet pairing is taken to be described by either the shallow or deep model (see text). Vertical solid lines indicate the approximate boundaries between the core and inner crust (at near nuclear saturation, i.e. ρ≈ρnuc/2) and inner and outer crusts (at neutron drip, i.e. ρ≈ 4 × 10¹¹ g cm−3).
2.4 Heat capacity
 is the effective mass. We assume
  for neutrons and protons and take
  for electrons and muons. A reduction of the heat capacity due to nucleon superfluidity can be taken into account by using
 only depends on the ratio T/Tcx and whether the superfluid is of singlet or triplet type (Levenfish & Yakovlev 1994a; Yakovlev, Levenfish & Shibanov 1999b). The ion heat capacity is (van Riper 1991)
2.5 Neutrino emissivity
For the NS core, we calculate neutrino emission due to the neutron and proton branches of the modified Urca process and neutron–neutron, neutron–proton and proton–proton bremsstrahlung using emissivities from Yakovlev et al. (1999b) and Page et al. (2004). When neutrons and/or protons are superfluid, we account for suppression of the above processes (Levenfish & Yakovlev 1994b; Yakovlev et al. 1999b) and neutrino emission due to Cooper pairing of the superfluid component (Yakovlev et al. 1999b; Page et al. 2009).
For the APR I EOS (see Section 2.1), neutrino emission by the direct Urca process occurs when M > 1.829 M⊙ (central densities above 1.680 × 10¹⁵ g cm−3; Gusakov et al. 2005); for this present work in which we consider only M= 1.4 M⊙, we will neglect this process (as well as other ‘fast’ cooling processes; see Yakovlev & Pethick 2004; Page et al. 2006). As shown by Kaminker et al. (2006), cooling by direct Urca has no effect on the surface temperature because of thermal decoupling between the core and outer crust. In addition, since direct Urca is more effective at cooling the core, it would speed up the onset of superfluidity. Hence its inclusion would make our conclusions even more robust.
In the crust, we account for electron–nucleon, neutron–neutron and neutron–nucleon bremsstrahlung, plasmon decay, and e−–e+ pair annihilation using emissivities from Yakovlev et al. (1999a, 2001). When neutrons are superfluid (in the singlet state), we account for the suppression of neutron–neutron and neutron–nucleon bremsstrahlung (Yakovlev et al. 1999b, 2001), as well as including neutrino emission due to neutron Cooper pairing (Yakovlev et al. 1999b; Page et al. 2009). We neglect neutrino synchrotron emission in a magnetic field since this additional emission would cause even more rapid cooling of the crust (Yakovlev et al. 2001).
2.6 Thermal conductivity
For the core, we sum thermal conductivities due to neutrons, electrons and muons (Flowers & Itoh 1979, 1981). We use the results of Baiko, Haensel & Yakovlev (2001) to calculate the neutron thermal conductivity, accounting for neutron–neutron and neutron–proton collisions and superfluid suppression. We use the results of Shternin & Yakovlev (2007) to calculate the electron and muon thermal conductivities and account for superfluid suppression. For the crust, we use conduct08,4 which implements the latest advancements in calculating thermal conductivities (Potekhin et al. 1999; Cassisi et al. 2007; Chugunov & Haensel 2007). We assume no contribution by impurity scattering, which only becomes important at high densities and low temperatures.
2.7 Envelope
Magnetized envelopes produce higher (lower) Ts for a given Tenv due to enhanced (reduced) thermal conduction along (across) the magnetic field, and the effect is stronger for accreted envelopes (Potekhin & Yakovlev 2001; Potekhin et al. 2003). Kaminker et al. (2006, 2009) include the effects of magnetic fields (∼1014–1016 G) in the envelope and inner and outer crusts and find that, though the temperature profile in the crust is modified, the average surface temperature is only weakly affected by anisotropic heat conduction. We mostly neglect magnetized envelopes since their effects would not significantly affect our conclusions (see Section 3.5).
2.8 Heat source
 at t≪τh. Note that Kaminker et al. (2006, 2009) use a heating decay time-scale τh= 5 × 10⁴ yr; the exact value is unimportant for our purposes, as long as it is approximately the age of the oldest (high surface temperature) magnetar, since τh is approximately the time during which a high surface temperature can be maintained by this crust heating (see Section 3.5).
3 RESULTS
We assume a constant  at t= 0. For clarity, the superfluid results shown in all subsequent figures use the shallow neutron triplet model (see Section 2.3); the superfluid results using the deep neutron triplet model are qualitatively similar in the age range considered here (<105 yr). Also we assume an iron envelope, unless noted otherwise. For models which include core heating, we primarily assume an initial magnetic field B0= 1016 G, though we also consider lower, more realistic initial field strengths, as well as extreme fields.
3.1 Cooling with no superfluid nor heating
Fig. 3 shows the temperature as a function of density at different ages for a NS cooling model that neglects superfluidity and has no additional sources of internal heating (Qh= 0). These temperature profiles are very similar to those shown in Gnedin et al. (2001). At very early times, the core cools more rapidly than the crust via stronger neutrino emission, so that the crust is generally at higher temperatures. A cooling wave travels from the core to the surface, bringing the NS to a relaxed, isothermal state. Depending on the properties of the crust, the relaxation time is ∼10–100 yr (Lattimer et al. 1994; Gnedin et al. 2001; Yakovlev et al. 2011). Formation of the inner and outer crusts begins at ∼1 h and ∼1 d, respectively, and is mostly complete after ∼1 month and ∼1 yr, respectively (see also Aguilera et al. 2008a). The temperature profiles demonstrate the need to account for magnetic field effects in more accurate models of the crust and envelope when T≲TB and temperature gradients are significant (see Sections 2.6 and 2.7).
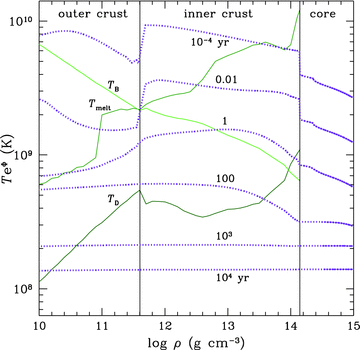
Temperature profiles for cooling model with no superfluidity and no heating (dotted lines). The six profiles are at ages t= 10−4 (top), 0.01, 1, 100, 103 and 104 yr (bottom). Thin solid lines denote the melting temperature Tmelt, Debye temperature TD, and TB, where TB is calculated assuming B= 1015 G (see equation 13). Vertical solid lines indicate boundaries between core and inner crust and inner and outer crusts.
3.2 Cooling with np superfluid and no heating
Fig. 4 shows T(ρ) at different ages for a cooling model that neglects heating but includes superfluidity of neutrons and protons, with critical temperatures also shown. When superfluidity is taken into account, we see the impact of the two effects mentioned in Section 2.3: slower cooling in the core after protons become superconducting and faster cooling after neutrons become superfluid due to neutrino emission from Cooper pair formation. The latter is strongest in regions near the critical temperature. Proton superconductivity occurs at ∼1 min, and much of the core is superconducting after ∼1 yr. Core neutrons start becoming superfluid at around a few × 100 yr.
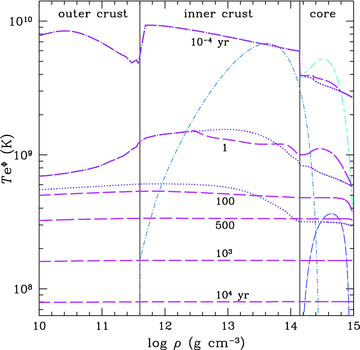
Temperature profiles for cooling model with superfluidity and no heating (long-dashed lines). The six profiles are at ages t= 10−4 (top), 1, 100, 500, 103 and 104 yr (bottom). Also plotted for comparison are profiles (dotted lines) for the model with no superfluidity at ages t= 10−4, 1 and 100 yr (see Fig. 3). Critical temperatures for neutron singlet (dot–short-dashed), neutron triplet (dot–long-dashed) and proton singlet (short–long-dashed) are shown. Vertical solid lines indicate boundaries between core and inner crust and inner and outer crusts.
3.3 Cooling with superfluid and crust heating
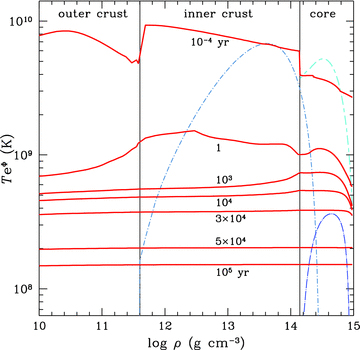
Fig. 5 shows temperature profiles for a cooling model that includes superfluidity and crust heating (see equation 16). The profiles with crust heating are similar to those shown in Kaminker et al. (2006, 2009). In particular, it is clear that an additional heat source in the outer crust can very effectively maintain a high temperature near the NS surface [with redshifted surface temperature  , where
  , for times longer than τh (=104 yr)], but this strong heating in the crust does not prevent the core from cooling rapidly. Due to thermal decoupling between the outer crust and core, the core temperature drops below the critical temperature for neutron triplet superfluidity at a few × 100 yr, whether or not there is crust heating.
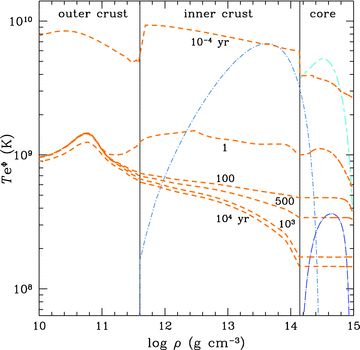
Temperature profiles for cooling model with superfluidity, crust heating and heating time-scale τh= 104 yr (short-dashed lines). The six profiles are at ages t= 10−4 (top), 1, 100, 500, 103 and 104 yr (bottom). Critical temperatures for neutron singlet (dot–short-dashed), neutron triplet (dot–long-dashed) and proton singlet (short–long-dashed) are shown. Vertical solid lines indicate boundaries between core and inner crust and inner and outer crusts.
3.4 Cooling with superfluid and normal core heating
Fig. 6 shows temperature profiles for a model that includes superfluidity and core heating due to magnetic field decay with an initial field B0= 1016 G and τdecay= 104 yr (see equations 17 and 19). We see that, with such strong heating, the core temperature stays above the critical temperature Tcnt for t≫ 100 yr. However, the extra heat created in the core from field decay is efficiently removed by core neutrino emission processes, with their strong temperature dependencies (Yakovlev & Pethick 2004; Page et al. 2006); while the temperatures in the crust are higher than those from models without any heating, they are significantly lower than those from models with crust heating.
Temperature profiles for cooling model with superfluidity, normal core heating, initial magnetic field B0= 1016 G and field decay time-scale τdecay= 104 yr (solid lines). The seven profiles are at ages t= 10−4 (top), 1, 103, 104 , 3 × 10⁴, 5 × 10⁴ and 105 yr (bottom). Critical temperatures for neutron singlet (dot–short-dashed), neutron triplet (dot–long-dashed) and proton singlet (short–long-dashed) are shown. Vertical solid lines indicate boundaries between core and inner crust and inner and outer crusts.
3.5 Comparison with magnetar surface temperatures
Fig. 7 shows the evolution of redshifted surface temperatures  for the cooling models plotted in Figs 3–6. For models with crust or core heating, we also show cooling curves with fully accreted light-element envelopes and a surface magnetic field 1015 G that is directed along the radial direction, which produce higher surface temperatures for the same outer crust temperature (Potekhin et al. 2003; see also Section 2.7). The cooling curves are compared to the estimated ages and measured surface temperatures of magnetars6 and other neutron stars (see Chevalier 2005; Yakovlev et al. 2008; Ho & Heinke 2009; Kaminker et al. 2009, and references therein). Our results clearly indicate that heating in the (outer) crust can produce surface temperatures which match the high magnetar surface temperatures; this is in agreement with the findings of Kaminker et al. (2006, 2009). On the other hand, even using a more realistic core heating prescription that includes magnetic field strength and temperature dependencies (as suggested by Dall’Osso et al. 2009), heating of the core by magnetic field decay produces
  that are too low to explain the observed temperatures of magnetars. Only for extreme (B0 > 1016 G) and long-lived (τdecay≳ 103 yr) magnetic fields and a magnetic, fully accreted light-element envelope (which is unlikely due to diffusive nuclear burning in the hot surface layers; Chang & Bildsten 2004) could a surface temperature at the low end of magnetar temperatures (
 ) be produced. Therefore core heating alone cannot explain magnetar surface temperatures.
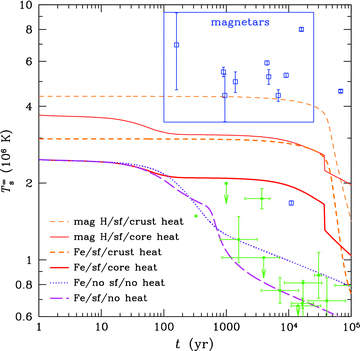
Redshifted surface temperature evolution for models with no superfluid (dotted line), superfluid and no heating (long-dashed line), superfluid and crust heating for heating time-scale τh= 104 yr (short-dashed lines), and superfluid and core heating for initial magnetic field B0= 1016 G and field decay time-scale τdecay= 104 yr (solid lines); the thin upper lines have fully accreted light-element envelopes (with a 1015 G radial surface magnetic field), while the thick lower lines have iron envelopes. Data points are magnetars and other neutron stars taken from the McGill SGR/AXP Online Catalogue and those listed in Chevalier (2005); Yakovlev et al. (2008); Ho & Heinke (2009); Kaminker et al. (2009), respectively.
3.6 Onset of core neutron superfluidity with proton superconductivity
From Figs 4–6, we see that the onset of core neutron superfluidity can be delayed from age a few × 100 yr when the initial core field B0≲ a few × 1015 G to, e.g., ≈104 yr when B0= 5 × 10¹⁵ G (and τdecay= 104 yr) or 3 × 10⁴ yr when B0= 8 × 10¹⁶ G (and τdecay= 103 yr). This is based on our simple model of core heating, especially the assumption that field decay occurs on the time-scale given by equation (18). For the deep neutron triplet model (see Section 2.3), onset occurs earlier since the inner core cools faster and the maximum Tcnt is higher than in the shallow model (see Fig. 2).

 [
[ ] is the reduction factor modified to account for electron–neutron collisions, Rp is the reduction factor of proton–neutron collisions given in Baiko et al. (2001), and Den= 1014 s−1(ρ/ρnuc)−2/3(T/109 K)2 and Dpn= 4.8 × 10¹⁸ s−1(ρ/ρnuc)−1/3(T/109 K)2 are the inverse relaxation time-scales for e–n and p–n collisions, respectively (Yakovlev & Shalybkov 1990). The transition temperature also increases, i.e.
 at T < Tcp and the strong increase in
  (
( ) at low temperatures. Using this heating rate (that accounts for superconducting protons) in our cooling calculations, we find that there is no delay in the onset of core neutron superfluidity. Onset occurs at a few × 100 yr, and the temperature profile/evolution is very similar to the case without core heating (see Figs 4 and 5) for any field ≲1016 G (however, at the high field end, superconductivity is expected to be suppressed; Baym, Pethick & Pines 1969). This is because proton superconductivity greatly increases the time-scale for field decay, which consequently reduces Qh and renders core heating ineffective against cooling by strong neutrino emission.
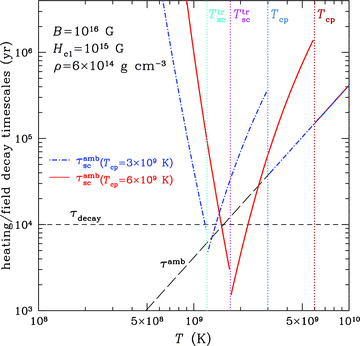
Core heating and field decay time-scales used in this work as a function of temperature for typical parameter values. Long-dashed line is (solenoidal) ambipolar diffusion time-scale τamb in normal matter (see equation 18), dot–dashed and solid lines are ambipolar diffusion time-scales  which account for proton superconductivity at Tcp= 3 × 10⁹ K and 6 × 10⁹ K, respectively (see equation 25), and short-dashed line is the field decay time-scale τdecay (=104 yr; see equation 19). Vertical dotted lines denote the critical temperatures for proton superconductivity Tcp and temperatures for transition between solenoidal and non-solenoidal modes of ambipolar diffusion
  (see equation 24).
4 DISCUSSION
We performed detailed calculations of neutron star cooling, including the effects of superfluidity and additional heating (due to magnetic field decay) in the crust and core. We find that magnetic field decay in the neutron star core cannot be the sole source powering the high observed surface temperature of magnetars in quiescence; the high temperatures require outer crust heating (Kaminker et al. 2006, 2009). Because of crust heating and effective thermal decoupling between the outer crust and core, the state of matter in the core cannot be deduced from these surface temperature measurements. By computing the evolution of the temperature profile T(ρ), we determine the time when core neutrons first become superfluid, i.e. when T < Tcnt(ρ). We find that heating by field decay in the core (with fields ≲1016 G) cannot balance neutrino cooling and thus cannot maintain relatively high core temperatures (cf. Thompson & Duncan 1996; Dall’Osso et al. 2009). As a result, onset of superfluidity for neutrons in the core cannot be delayed, and neutron stars possess superfluid and superconducting cores after a few hundred years; this does not strongly depend on the nuclear EOS. Since core heating is not significant, the temperature profiles T(ρ) and surface temperature evolution  for magnetars are just those with crust heating (see Figs 5 and 7, respectively), and crust heating does not affect the onset of core neutron superfluidity because of thermal decoupling between the outer crust and core.
Magnetar activity may be driven by field decay in the core (Thompson & Duncan 1995, 1996) or by processes in the crust (Thompson & Duncan 1993, 1995; Glampedakis et al. 2011; Price et al. 2012). Although the former may still be true, it must be accompanied by heating in the (outer) crust. On the other hand, field evolution in the crust easily couples to surface emission. Thus in order to understand the high surface temperature of magnetars, detailed studies should focus on magnetic field evolution and heating in the crust (see e.g. Pons et al. 2009; Cooper & Kaplan 2010; Price et al. 2012). We note that several magnetars may have very similar X-ray luminosities (Durant & van Kerkwijk 2006); this could suggest that their crustal field strengths are similar and the field decay time-scale is longer than the age of the oldest of these sources.
Finally, the (normal versus superfluid) state of the core has important consequences for magnetic and rotational evolution of magnetars (Glampedakis & Andersson 2011), as well as their glitching behaviour and possible stellar oscillations; studies of these effects may be effective probes of the neutron star core. We showed that the core can be treated as being in a superfluid and superconducting state after the neutron star is a few hundred years old.
WCGH thanks Dmitry Yakovlev for valuable comments on an early version of the manuscript. WCGH appreciates the use of the computer facilities at the Kavli Institute for Particle Astrophysics and Cosmology. WCGH and NA acknowledge support from the Science and Technology Facilities Council (STFC) in the United Kingdom. KG is supported by the Ramón y Cajal Programme of the Spanish Ministerio de Ciencia e Innovación.
Footnotes
However, there exists an apparently low surface magnetic field magnetar (Rea et al. 2010).
The maximum NS mass for this EOS is 1.923 M⊙, which is below the highest measured mass of 1.97 M⊙ (Demorest et al. 2010). Nevertheless, APR is typical of EOSs that yield higher maximum masses, and our conclusions do not depend strongly on the specific EOS.
Thompson & Duncan (1996) has a 1/14-th power of the denominator and a decay time-scale proportional to τamb, while Dall’Osso et al. (2009) has a 5/6-th power of the denominator and a decay time-scale given by 1.03 × 10⁴ yr (B/1016 G)−6/5(ρ/1015 g cm−3)2/5. The different evolution laws reflect the different ambipolar diffusion modes (solenoidal versus non-solenoidal) considered by these authors. Note that these decay time-scales are shorter for higher magnetic fields. Incidentally, numerical simulations of field evolution in the crust yield equation (19), with τdecay given by the time-scale for Hall drift at times much shorter than the Ohmic decay time-scale (Aguilera, Pons & Miralles 2008a; Aguilera et al. 2008b).
Data are taken from the McGill SGR/AXP Online Catalogue at http://www.physics.mcgill.ca/~pulsar/magnetar/main.html. Magnetar ages and surface temperatures are not well-determined due to additional systematic uncertainties that are large (see e.g. Kaminker et al. 2006, 2009, for details). Kaminker et al. (2009) consider the more reliable surface luminosity. For simplicity, we consider the ‘magnetar box’ illustrated in Fig. 7.
The heating rate could be further corrected by using  when the protons are superconducting. This would make core heating even less important at strong fields.
REFERENCES
