


Abstract
We present photometry of the nearby galaxy NGC 5128 (Centaurus A) observed with the Photodetector Array Camera and Spectrometer (PACS) and Spectral and Photometric Imaging Receiver (SPIRE) instruments on board the Herschel Space Observatory, at 70, 160, 250, 350 and 500 μm, as well as new CO J= 3–2 observations taken with the HARP-B instrument on the James Clerk Maxwell Telescope (JCMT). Using a single-component modified blackbody, we model the dust spectral energy distribution within the disc of the galaxy using all five Herschel wavebands and find dust temperatures of ∼30 K towards the centre of the disc and a smoothly decreasing trend to ∼20 K with increasing radius. We find a total dust mass of (1.59 ± 0.05) × 107 M⊙ and a total gas mass of (2.7 ± 0.2) × 109 M⊙. The average gas-to-dust mass ratio is 103 ± 8, but we find an interesting increase in this ratio to approximately 275 towards the centre of Cen A. We discuss several possible physical processes that may be causing this effect, including dust sputtering, jet entrainment and systematic variables such as the XCO factor. Dust sputtering by X-rays originating in the active galactic nucleus or the removal of dust by the jets is our most favoured explanation.
1 INTRODUCTION
Elliptical galaxies were long thought to be gas and dust poor, but in the past few decades, several observational surveys have shown that a significant fraction of these galaxies contain a rich interstellar medium (ISM). Detections of cold dust (temperatures of ∼30 K) in non-peculiar early-type galaxies using data from IRAS could only be made in about 12 per cent of the sample (e.g. Bregman et al. 1998); with improvements in our ability to detect the cold dust component of the ISM, we are finding more evidence for dust within early types (e.g. Temi et al. 2004; Xilouris et al. 2004; Leeuw et al. 2008; Young, Bendo & Lucero 2009; Smith et al. 2012). Other studies suggest there is a relationship between a detection of cold dust in these galaxies and the likelihood of a radio source at the core (e.g. Walsh et al. 1989). Cold gas has also been found in elliptical galaxies, both molecular (e.g. Thronson et al. 1989; Wiklind, Combes & Henkel 1995; Welch & Sage 2003; Young et al. 2011) and atomic (e.g. Knapp, Turner & Cunniffe 1985; Bregman, Hogg & Roberts 1992; Huchtmeier 1994; Huchtmeier, Sage & Henkel 1995; Morganti et al. 1999, 2006; Welch, Sage & Young 2010).
Centaurus A (Cen A or NGC 5128) is the closest example of a giant elliptical galaxy, located at a distance of 3.8 ± 0.1 Mpc (Harris, Rejkuba & Harris 2010). It has a warped disc, likely the result of a past merger event, which contains an abundance of both gas and dust, and has a central active galactic nucleus (AGN) with radio jets extending out to large distances in both directions. Thus, Cen A is an ideal laboratory for studying variations in the ISM at high resolution and to look for effects the AGN might have on the neighbouring disc. Note that while these interesting traits do make Cen A a somewhat peculiar elliptical galaxy, some studies show that overall Cen A is still a normal elliptical on global scales, and that its proximity is what gives us insight into its peculiarity (e.g. Harris 2010).
Cen A has been observed extensively in the past over a wide range of wavelengths. For a comprehensive review of the numerous physical characteristics of Cen A, see Israel (1998) and Morganti (2010). Observations of H i covering a large area of the sky surrounding Cen A (e.g. van Gorkom et al. 1990; Schiminovich et al. 1994; Morganti et al. 2008; Struve et al. 2010) reveal emission throughout the disc and in shells at large distances from the disc, supporting the merger scenario. The central core itself shows both blueshifted and redshifted H i absorption (Morganti et al. 2008; Struve et al. 2010), consistent with a circumnuclear disc.
Due to its low latitude in the southern sky (13h25m27 6, −43°01′09″), only a small number of telescopes are capable of observing Cen A in CO, such as the Swedish-ESO Submillimeter Telescope (SEST; e.g. Phillips et al. 1987; Eckart et al. 1990a; Quillen et al. 1992; Rydbeck et al. 1993). Detections in the J= 1–0 transition by Eckart et al. (1990a) show that the emission primarily traces the optical disc, but drops off significantly beyond about 90 arcsec on either side of the centre of the disc. In addition, Eckart et al. (1990a,b) report detections of the 12CO and 13CO J= 1–0 line in absorption against the nuclear non-thermal continuum, and suggest the same molecular clouds are responsible for both the emission and absorption features.
Spitzer Space Observatory IRAC observations of Cen A (Quillen et al. 2006) reveal a prominent parallelogram-shaped ring of dusty material in the central disc at higher resolution than earlier mid-infrared observations of Cen A using ISOCAM on the Infrared Space Observatory (ISO; Mirabel et al. 1999). Observations of Cen A at 450 and 850 μm with Submillimetre Common-User Bolometer Array (SCUBA) and at 870 μm with LABOCA show a warped ‘S’-shaped structure close to the nucleus spanning approximately 5 arcmin across, similar to the mid-infrared observations (Leeuw et al. 2002; Weiß et al. 2008). Less defined, fainter emission surrounds this structure and extends over much of the optical dust lane. To explain the ‘S’-shaped disc, Quillen et al. (2006) model the warped morphology of the inner infrared/submm disc using a ‘tilted-ring’ model, consisting of a series of concentric rings. The IRAS measurements of Eckart et al. (1990a) reveal an average dust temperature of about 42 K, with the temperature decreasing towards the edge of the disc. Leeuw et al. (2002) also find a temperature of ∼40 K in the disc that decreases outwards. Furthermore, Weiß et al. (2008) show the first detections at submm wavelengths of non-thermal emission from the radio lobes. Studying the thermal emission within the disc, their two-component dust model shows the dust has temperatures of 30 and 20 K (warm and cold components, respectively), but no decreasing trend at larger radii. Lastly, a complementary study to this paper by Auld et al. (2012) analyses the dust properties of the remains of the smaller merger component in Cen A at large radii from the centre, using data from the Herschel Space Observatory (Pilbratt et al. 2010).
In spite of the number of observations of the disc of Cen A in both the dust and gas components, there are few published values of the gas-to-dust mass ratio in this galaxy. Stickel et al. (2004) report a ratio of ∼300 in a region north of the disc using data taken with ISOPHOT on ISO, and Israel (1998) suggests an upper limit of 450. Even for other early-type galaxies, only a small number of surveys report gas-to-dust mass ratios. The Spitzer Infrared Nearby Galaxies Survey (SINGS) found ratios similar to that of the Milky Way (Draine et al. 2007), while Leeuw et al. (2008) found a range of values between ∼230 and 400 for the inner H2-dominated regions of seven ellipticals. In comparison, the typical value for the Milky Way is ∼160 (e.g. Zubko, Dwek & Arendt 2004). With Herschel, we have the capability to study the gas-to-dust mass ratio for the disc of Cen A at unprecedented resolution, and we can investigate how this ratio varies throughout the galaxy including regions near the AGN, and try to understand how the AGN affects the structure of the ISM. Herschel also gives us increased sensitivity compared to ground-based observatories and extends coverage to longer wavelengths than previous space missions, which are crucial to measuring the dust content of the ISM.
Here we present a detailed analysis of the gas-to-dust mass ratio of Cen A through the central disc. We use photometric observations with both the Photodetector Array Camera and Spectrometer (PACS; Poglitsch et al. 2010) and the Spectral and Photometric Imaging Receiver (SPIRE; Griffin et al. 2010) on Herschel, as well as observations with the HARP-B receiver mounted on the James Clerk Maxwell Telescope (JCMT). In Section 2 we present the observations and data reduction process. In Section 3 we present our Herschel and JCMT photometry, our spectral energy distribution (SED) model and maps of the best-fitting dust temperatures, dust and gas masses, and the gas-to-dust mass ratio across the disc. In Section 4 we discuss the possible mechanisms that might explain the characteristics of our maps, and we conclude in Section 5.
2 OBSERVATIONS
2.1 Herschel observations
We have obtained PACS photometry at 70 and 160 μm (OBSIDs 1342188855 and 1342188856) and SPIRE photometry at 250, 350 and 500 μm (OBSID 1342188663) as part of the Very Nearby Galaxies Survey (VNGS; PI: Christine Wilson), which is a Herschel Guaranteed Time programme. All of these images cover a 37 × 37 arcmin2 area on the sky centred on Cen A. In Table 1 we summarize the basic characteristics of the original Herschel maps, which are shown in Fig. 1.
A summary of the Herschel observation information as well as the pixel noise and calibration uncertainty values. The measurement uncertainty is pixel-dependent (see Section 2.1.3 for details) and thus values are not presented here.
| Wavelength (μm) | Beam size (arcsec) | Pixel size (arcsec) | Colour correctiona | Pixel noiseb (mJy pixel−1) | Calibration uncertaintyc (per cent) |
| 70 | 5.76 | 2 | 1.043 | 0.009 | 3 |
| 160 | 12.13 | 4 | 1.029 | 0.060 | 5 |
| 250 | 18.2 | 6 | 0.9836 | 0.147 | 7 |
| 350 | 24.5 | 8 | 0.9821 | 0.114 | 7 |
| 500 | 36.0 | 12 | 0.9880 | 0.110 | 7 |
aPACS values are divisive and SPIRE values are multiplicative.
bThese uncertainties are for the pixels at their native pixel scale, as listed in this table.
cWe have ignored the fact that the SPIRE calibration errors are correlated between all three bands and our total 7 per cent error comprises 5 per cent correlated error and 5 per cent uncorrelated error.
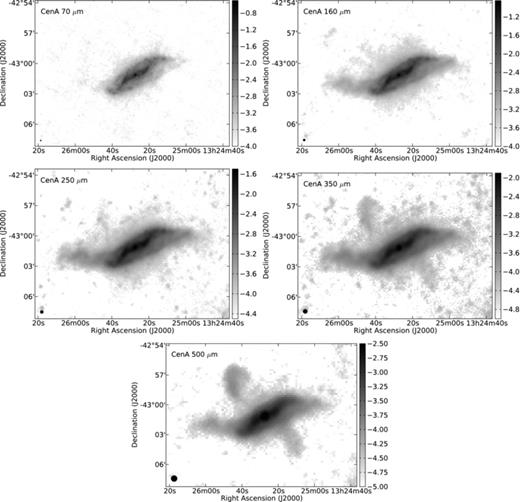
The five Herschel images at their native resolutions. The colour scale units are log(Jy arcsec−2), and the beam size is in the lower-left corner of each image. Note that the radio jets become more prominent at 350 and 500 μm due to synchrotron radiation.
2.1.1 PACS observations
The PACS 70- and 160-μm observations were obtained simultaneously in scan-map mode at the ‘medium’ scan speed of 20 arcsec s−1. The scans were carried out in orthogonal directions to produce a square map with homogenous coverage, with a scan leg length of 37.0 arcmin. The observations were then processed using a pipeline that has been modified from the official one released with the Herschel Interactive Processing Environment (hipe, version 4.0; Ott 2010), using calibration file set (FM, v4). Reduction steps include protecting the data against possible cross-talk effects between bolometers in the array, and deglitching only at the second level. This involves comparing the signal detected within all of the pixels in the data cube that cover the same location in the sky, and flagging any pixels that are outliers as glitches. In addition, flat-field corrections were applied to the images, and the signal was converted to units of Jy pixel−1. We also applied correction factors of 1.119 and 1.174 to the 70- and 160-μm maps, respectively, to update the images with the most recent set of calibration files. Once these steps were done in hipe, the final map making was done in Scanamorphos1 (version 6.0; Roussel 2012) using standard settings and pixel sizes of 2.0 and 4.0 arcsec for the 70- and 160-μm images, respectively. We applied a colour correction to each map to accommodate the non-monochromatic nature of the galaxy’s SED through each of the PACS filters. To do so, we first measure the slope of the SED at 70 and 160 μm using our one-component blackbody fit (see Section 3.1 for details) and applied the colour corrections for those slopes. Then we recalculate the slope of the SED for the corrected fluxes and check for any change in the slope. We find slopes of −3 and +1 at 70 and 160 μm, respectively, and thus we divide these images by correction factors of 1.043 and 1.029 (Müller, Okumura & Klaas 2011). Lastly, we determine the mean sky value within numerous apertures overlaid on to off-target regions surrounding the galaxy at each wavelength, and then determine the average mean across all apertures. We take this mean as our background contribution and subtract it from each PACS image.
The final 70- and 160-μm images have been convolved with appropriate kernels (see Bendo et al. 2012, for details) to match the 36-arcsec resolution of the 500-μm image, and then regridded to a 12-arcsec pixel scale, again to match the 500-μm image.
2.1.2 SPIRE observations
The SPIRE observations were done in large scan-map mode with the nominal scan speed of 30 arcsec s−1 and the cross-scanning method. Data reduction was carried out in hipe using a pipeline that has been altered from the standard one, in which the custom algorithm for temperature drift corrections, BRIght Galaxy ADaptive Element (BriGAdE), was used in lieu of the standard algorithm. A description of the data processing including how BriGAdE applies this correction is given in Auld et al. (2012), Smith et al. (2012) and Smith et al. (in preparation). The final maps were made using hipe’s map-making tool and are in units of Jy beam−1 with pixel scales of 6, 8 and 12 arcsec at 250, 350 and 500 μm, respectively. However, we converted the units from Jy beam−1 to Jy pixel−1 for consistency with the PACS images using beam areas for this conversion of 423, 751 and 1587 arcsec2 for the 250-, 350- and 500-μm images, respectively (SPIRE Observers’ Manual 2011). We calibrated the flux to correct for the extended nature of Cen A, using multiplicative K4 correction factors of 0.9828, 0.9834 and 0.9710 for the 250-, 350- and 500-μm images, respectively (SPIRE Observers’ Manual 2011). Lastly, we applied a colour correction to each image using the same method as for the PACS images (see Table 1 for specific values), as well as a background subtraction. The five Herschel images are presented in Fig. 1 in their original resolutions.
For analysis purposes, we have convolved the 250- and 350-μm images with a Gaussian beam to match the 36-arcsec resolution of the 500-μm image. The point spread function of the SPIRE beam is well represented by a Gaussian function down to about 3 per cent of the peak in all three wavebands (Griffin et al. 2010), justifying our use of a Gaussian kernel. Next, these maps were regridded such that they all had the pixel scale of the 500-μm image, 12 arcsec.
2.1.3 Noise and uncertainties
There are three sources of noise and uncertainty that we take into account for the Herschel images. The dominant uncertainty for all images is the calibration uncertainty. For the PACS 70- and 160-μm images, the calibration uncertainties are 3 and 5 per cent, respectively (PACS Observer’s Manual 2011). For the 250-, 350- and 500-μm images, the calibration uncertainties are taken to be 7 per cent (SPIRE Observers’ Manual 2011). There is also an underlying measurement uncertainty associated with the flux values in each pixel, and a map with these uncertainties is produced as part of the general reduction. Finally, there is a contribution to the error in each pixel from the background subtraction. To calculate this noise, we first find the mean value within a number of apertures overlaid on the convolved and regridded images, just as we did for the background subtraction. Then we find the average mean across all apertures (at each wavelength), and then determine the standard error, given by the standard deviation of the individual aperture mean values divided by the square root of the number of apertures. Note that we have not accounted for the confusion noise in individual pixels in the SPIRE maps (see Nguyen et al. 2010); however, we expect it to be trivial except perhaps in the extreme outer disc, and the global average of the confusion noise has been removed with the background subtraction. A summary of the pixel errors from background subtraction and calibration uncertainties is presented in Table 1.
2.2 JCMT observations
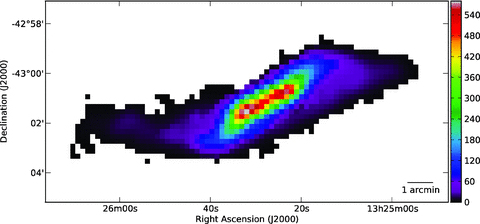
The 12CO J= 3–2 transition at a rest frequency of 345.79 GHz was mapped using the HARP-B instrument on the JCMT, located on Mauna Kea in Hawaii. These observations were taken over the nights of 2010 January 24–26 as part of project M09BC05 (PI: Tara Parkin), with a telescope beam size of 14.5 arcsec. We combined nine overlapping jiggle maps (each with an integration time of 50 s) instead of creating a raster map due to the low elevation of Cen A from the location of the JCMT. The maps were observed using beam switching with a chop throw of 150 arcsec perpendicular to the major axis of Cen A. Each jiggle map covers a 2 × 2 arcmin2 area on the sky, and our final map covers an area of 10 × 2 arcmin2, to observe the dust lane out to D25/2, which is half the distance from the centre of the galaxy to where the optical magnitude falls to 25. The backend receiver, the Auto-Correlation Spectrometer Imaging System (ACSIS), was set to a bandwidth of 1 GHz with 2048 channels, giving us a resolution of 488 kHz or 0.43 km s−1.
The data were reduced using the Starlink2 software package (Currie et al. 2008), maintained by the Joint Astronomy Centre. We first flagged the data for any bad pixels in the raw data and then built a cube (two spatial dimensions and one in frequency) with 7.5-arcsec pixels combining all of our observations. Next, we masked out detections of the 12CO J= 3–2 line in our cube using an automated fitting routine, then fitted a third-order polynomial to the baseline in order to remove it from the cube. We then binned this cube to a resolution of 20 km s−1 to measure the average rms in the line-free regions, which we determined to be  mK.
mK.
The first three moment maps (integrated intensity, integrated velocity and velocity dispersion) were created using the routine ‘findclump’ (part of Starlink), which looks for detections of greater than 2σ. We first convolve the unbinned cube with a Gaussian beam to match the 36-arcsec resolution of the Herschel SPIRE 500-μm map. Next, we determine the average rms within the line-free regions of the spectrum and expand the two-dimensional noise map into a cube. Then we create a signal-to-noise ratio cube by dividing the convolved cube by the noise cube and apply ‘findclump’ to it. This method allows us to make detections of low-level emission better than just applying ‘findclump’ to our image cube. The routine creates a mask of the detections in a smoothed version of the cube and then multiplies this mask by the signal-to-noise ratio cube to obtain a cube containing only detections above several different σ cut-offs. Then this cube is collapsed along the velocity axis to create the three moment maps in terms of the signal-to-noise ratio. Finally, the integrated intensity-to-noise map is multiplied by the two-dimensional noise map to obtain the true integrated intensity map. For a more detailed description of our reduction method see Warren et al. (2010).
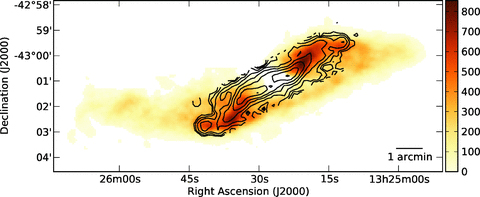
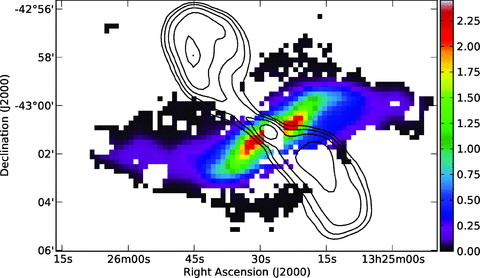
H i map of the disc region of Cen A in units of 1019 cm−2 from Struve et al. (2010; colour scale), with a beam of 19 arcsec. JCMT CO J= 3–2 contours with a resolution of 14.5 arcsec are overlaid in black. CO contour levels are 0.4, 0.8, 1.6, 3.2, …, 25.6 and 38.4 K km s−1, where the temperature units are TA*.
2.3 Ancillary data
The H i map of Cen A was kindly provided to us by Tom Oosterloo and previously published in Struve et al. (2010). This map has a resolution of 19 arcsec and units of 1019 cm−2, with a pixel scale of 4 arcsec. We smoothed the image to a resolution of 36 arcsec using a Gaussian beam to match the resolution of the SPIRE 500-μm image, and regridded the image to match the 12-arcsec pixel size.
We also have a map of the radio continuum at 1.425 GHz, originally published as part of the IRAS Bright Galaxy Atlas (Condon et al. 1996), and retrieved from the NASA Extragalactic Database (NED). This map allows us to trace the jets extending out from the central AGN. We convolved this radio image with a Gaussian beam and then regridded it to match the SPIRE 500-μm image.
3 RESULTS
3.1 SED fitting
To constrain our modified blackbody fits, we created uncertainty maps for each wavelength that are a combination of the measurement uncertainty in the flux value of each pixel, the background noise in each pixel and the calibration uncertainties for both PACS and SPIRE (see Section 2.1.3 for details), added in quadrature. The value in each pixel of the resulting map is taken to be the total uncertainty for the equivalent pixel at a given wavelength.
For each pixel in the images that has a S/N ≥ 10 at all five Herschel wavelengths, we fit equation (2) to our flux measurements to determine the best-fitting temperature T and constant C for that pixel. An example of an SED fit for a typical pixel is shown in Fig. 3, and the pixel location is shown with a cross in Fig. 4. We also show the global SED that was obtained by summing the flux at each wavelength within all of the pixels with good fits in Fig. 3, and fitting the resulting totals. Note that we tested the effect of removing the 70-μm data point from our SED fit to ensure that it was not forcing the curve to peak at shorter wavelengths and that it was not from a separate thermal component of the dust (Bendo et al. 2010a, 2012; Smith et al. 2010). We found that the 70-μm flux falls on the best-fitting curves within uncertainties for these tests, and thus we use all five wavelengths in our fitting routine. We then create a map of the dust temperature where pixels with poor chi-squared fits at the 95 per cent confidence level have been masked out. In general, the pixels with poor fits coincide with those where non-thermal radiation is making a significant contribution to the flux at 500 μm. The temperature map is presented in Fig. 4, with 500-μm contours overlaid to point out the location of the non-thermal emission. The temperature is about 30 K near the central AGN region, and then smoothly falls off to about 20 K in the outer disc, and the average temperature throughout the entire region is approximately (21.8 ± 0.3) K.
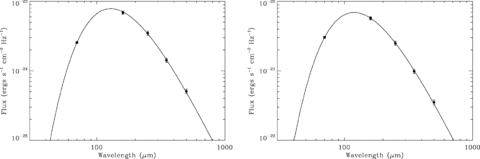
Left: the SED for a typical pixel (pixel location shown as a cross in Fig. 4). The best-fitting modified blackbody is shown as a solid line, while our measured flux values are represented by the data points. Right: a global SED for the entire disc, consisting of all pixels contributing to the total dust mass (see Section 3.2).
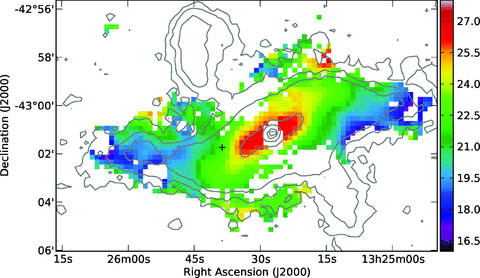
Temperature map of the dust disc of Cen A (colour scale), in units of degrees kelvin. Contours of the 500-μm SPIRE map are shown in grey for reference. The contours for the 500-μm image are 0.0139, 0.0347, 0.0694, 0.347, 0.694, 1.39, 2.78, 4.17 and 4.86 mJy arcsec−2. The black cross is the location of the pixel for which the best-fitting SED is shown in Fig. 3. Note that the central region does not have any reasonable fits due to the non-thermal emission present in the 350- and 500-μm maps.
We have also tried allowing both β and temperature to vary in equation (2) to investigate if the model fits to our data improve. While there is some small variation in β throughout the disc, these deviations are small and the average value of β is 2.07 ± 0.07. Furthermore, there are no obvious trends in the variation of β with radius. Thus, the results of our test are consistent with our one parameter fit, giving us confidence in our fixed β fits.
We evaluated the uncertainty on the dust temperature by implementing a Monte Carlo algorithm on our modified blackbody fitting routine. For each wavelength, an artificial flux value lying within the uncertainty bounds of our observed measured flux value is generated randomly using a Gaussian number generator. Then we run the modified blackbody fitting routine on the simulated data set and extract the temperature and constant for the best-fitting function corresponding to that data set. This process of creating artificial data and then fitting a function to them to determine the temperature is repeated 800 times for each pixel. We take the standard deviation of the temperature distribution for each pixel to be the uncertainty in the temperature. This uncertainty varies throughout the map, with an average of about 1 per cent pixel−1. The highest uncertainties are 5 per cent around the very edge of our map, where the signal-to-noise ratio is lower for the flux maps, and we note that these uncertainties exclude the uncertainties arising from our assumed value for β and thus emissivity.
3.2 Dust mass
Substituting our temperature and the SPIRE 250-μm fluxes returned by our model SED fits into equation (4), we obtain a pixel-by-pixel map of the dust mass, which is shown in Fig. 5. The dust mass distribution peaks towards the centre and falls off in the outer regions. Uncertainties range from about 3 to 30 per cent, with the lower uncertainties corresponding to pixels closer to the centre of the disc. The typical uncertainty in each pixel is ∼5 per cent. Summing up the individual dust masses within each pixel leads to a total dust mass in the disc of (1.59 ± 0.05) × 107 M⊙. As a check, we also evaluated the total dust mass using the global SED fit results, and obtain a total of 1.47 × 10⁷ M⊙.
Dust mass map of Centaurus A. Units of the colour scale are M⊙ pc−2. Contours of the 1.425-GHz radio continuum are overlaid in black to show the regions where synchrotron radiation is present.
3.3 Gas mass
 the mass of one molecular hydrogen atom. The total mass of molecular hydrogen, over the entire coverage of our map, is (1.42 ± 0.15) × 109 M⊙, where we have excluded uncertainty contributions from the assumed CO J= 3–2/CO J= 1–0 ratio.
Following the same method, we also convert the units of the H i map (Fig. 2) to units of mass. Then the molecular gas mass and atomic gas mass maps are combined in such a way that in regions where we have coverage for both H i and H2, the total gas mass is a sum of the two, and for the remaining regions the mass is from H i or H2 alone. We then multiply the resulting map by 1.36 to obtain the total gas mass, including helium. Summing over all pixels, we find a total gas mass of (2.7 ± 0.2) × 109 M⊙. Our map of the total gas is presented in Fig. 6, and covers about half of the area for which we have dust mass measurements.
The total gas mass distribution of the disc of Cen A. This map includes both the H i mass distribution, as well as the H2 mass, where we have coverage for it, and has been multiplied by 1.36 to account for helium as well. Units for the colour scale are M⊙ pc−2.
3.4 The gas-to-dust mass ratio
We present the gas-to-dust mass ratio in Fig. 7, which covers all pixels for which we have both a gas mass and a dust mass. The box outlined in black shows the region that has coverage both in H i and H2, which is 10 × 2 arcmin2 in area. As is seen in this figure, the majority of the disc has a gas-to-dust mass ratio similar to that of the Galaxy with an average value of 103 ± 8; the Galactic value varies from about 120 (Li & Draine 2001) to ∼160 (Zubko et al. 2004) to ∼180 (Draine et al. 2007, and references therein). Interestingly, the gas-to-dust mass ratio increases to a significantly higher value of almost 300 in regions closest to the AGN. Typical uncertainties in this ratio are about 10 per cent. We also present the average gas-to-dust mass ratio as a function of distance from the centre of Cen A along a position angle of 30° north of west in Fig. 8. This plot emphasizes the radial trend of the gas-to-dust mass ratio along the disc. In other galaxies such as those from the SINGS survey, the gas-to-dust mass ratio varies from ∼136 to ∼453 (Draine et al. 2007). We discuss the possible origin of this high central gas-to-dust mass ratio below.
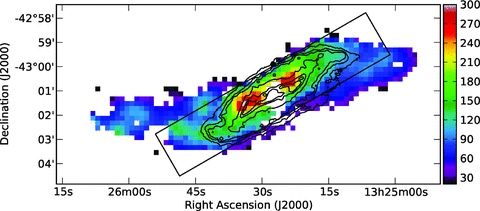
Gas-to-dust mass ratio of Centaurus A (colour scale), with PACS 70-μm contours (at original resolution) overlaid in black. Contour levels are 0.75, 1.5, 2.5, 7.5, 20 and 37.5 mJy arcsec−2. The box shown in black highlights the region in the disc for which the gas contribution is from H i and H2, and is 10 × 2 arcmin2 in size.
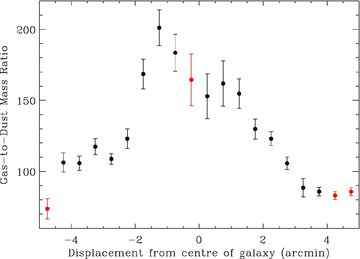
A radial plot of the average gas-to-dust mass ratio along the major axis of Cen A with a position angle of 30° north of west. We measured the average gas-to-dust mass ratio value within 20 bins along this position angle, each measuring 2 × 0.5 arcmin2 in size. The red data points represent the bins in which we had at most 10 good pixels out of a possible 25, and therefore are not as well sampled as those shown in black.
4 DISCUSSION
Our total dust mass of (1.59 ± 0.05) × 107 M⊙ is comparable to other published numbers for Cen A in the literature; however, we note that this value is likely a lower limit as regions where non-thermal emission contaminates the dust continuum had poor model fits. Several publications have used two-component modified blackbody modelling combined with far-infrared and submm observations to derive a dust mass for Cen A. Leeuw et al. (2002) used a wavelength range of 60–850 μm for their SED fit and found a total mass of 2.6 × 10⁶ M⊙ (adjusting for our distance) within an elliptical region 120 × 450 arcsec2 in size, but excluding the unresolved core at the centre. Since this ellipse covers a similar area to our observations, the discrepancy is likely due to an inadequate chop throw in the Leeuw et al. (2002) 850-μm data set, leading to difficulties quantifying the background. Our observations show faint emission at 500 μm extending beyond the 120-arcsec chop throw the authors used, and oversubtracting the background will lead to a lower dust mass estimate. Weiß et al. (2008) studied the submm continuum using LABOCA 870-μm data, and combining these data with fluxes spanning 25–870 μm they found a higher mass of 2.2 × 10⁷ M⊙. They subtract the flux contribution of the unresolved core from the total flux prior to estimating the dust, but do caution that they may not have removed all of the non-thermal emission arising from the radio jet.
The gas mass we have obtained from our H2 map alone is (1.42 ± 0.15) × 109 M⊙, including the central region which we masked out for our dust fitting. Eckart et al. (1990a) determined a molecular gas mass of 1.9 × 10⁸ M⊙, after we adjust their result for our assumed XCO factor and distance. In addition, Morganti (2010) suggests the total molecular gas mass is 4 × 10⁸ M⊙ based on observations of Eckart et al. (1990a) and Quillen et al. (1992). Our molecular gas mass is thus higher than those values previously published; this is likely due to the improved sensitivity of our observations. The molecular gas mass is about twice the atomic mass of 4.9 × 10⁸ M⊙ (Struve et al. 2010).
The high gas-to-dust mass ratio towards the central AGN is a most interesting result. Several studies of spiral galaxies have found that the gas-to-dust mass ratio is not constant throughout the disc, but rather decreases with decreasing distance from the centre of the galaxy (e.g. Muñoz-Mateos et al. 2009; Bendo et al. 2010b; Magrini et al. 2011), in contrast to what we have found here. We have made a rough estimate of the CO J= 3–2/CO J= 1–0 ratio throughout the central disc using the CO J= 1–0 map of Eckart et al. (1990a) to check if our assumption of 0.3 for this ratio is valid in the centremost regions of the disc. Our calculations show an average value of 0.35, and more importantly, they show no significant variation with radius. Furthermore, looking at Fig. 7 we see that there is a smooth transition of the gas-to-dust mass ratio between the H2-dominated region to the H i-dominated region in the outer disc, which also suggests CO excitation is not the primary cause of the high gas-to-dust mass ratio.
The XCO factor is one variable that might affect the gas-to-dust mass ratio if it is not constant throughout the disc. We have assumed the Galactic value for our calculations; however, studies have shown that this conversion factor can vary with metallicity (Wilson 1995; Israel 1997, 2000, 2005; Barone et al. 2000; Israel et al. 2003; Strong et al. 2004; Leroy et al. 2011). If the metallicity decreases as a function of radius within Cen A, we would require a larger conversion factor at larger radii, which in turn would increase the gas-to-dust mass ratio farther out in the disc, potentially bringing it up to a similar value as that in the centre. Alternatively, the XCO factor can be smaller by up to a factor of ∼4 for starbursting galaxies (Downes & Solomon 1998). This effect could reduce the gas-to-dust mass ratio in regions of strong star-forming activity; however, the total far-infrared luminosity for Cen A is ≤1010 L⊙, while the XCO conversion factor is typically affected at luminosities greater than ∼1011 L⊙ (e.g. Downes, Solomon & Radford 1993; Solomon et al. 1997).
One possibility is that dust is being destroyed by the jets extending out in either direction from the AGN. It is plausible that some of the dust grains are being destroyed by the AGN either through dust sputtering or through shocks. The total X-ray luminosity of the AGN of Cen A is 8 × 1042 erg s−1 (Rothschild et al. 2011), which is comparable in X-ray luminosity to the AGN found in M87 (Werner et al. 2006). It might be possible for these photons to deplete the dust in the surrounding ISM. In support of this scenario, Baes et al. (2010) did not detect thermal dust emission in M87, which also contains a jet.
It is also possible that the dust is entrained in the jets of Cen A. Roussel et al. (2010) found a dusty halo surrounding the starbursting galaxy M82 using Herschel observations. They considered entrainment by a galactic wind as a possible explanation even though they finally concluded that the origin was likely due to tidal interactions. We cannot rule out entrainment by galactic winds as a possibility for Cen A. Unfortunately, we cannot probe close enough to the jets to further investigate this assumption due to our limited resolution and the non-thermal emission component.
Alternatively, a larger gas reservoir in the centre could also increase the gas-to-dust mass ratio. This would require dust-poor gas falling on to the disc and being funnelled towards the centre. However, if this was the case, we would likely have found a high gas-to-dust mass ratio throughout the disc and not concentrated towards the innermost part of the disc. It also does not seem plausible for the gas to be migrating through the disc faster than the dust.
Interestingly, there is a large ring of material that is seen in the mid-infrared and far-infrared close to the regions in which we see a high gas-to-dust mass ratio. Mirabel et al. (1999) first noted the ‘S’-shaped structure with ISOCAM observations at 7 and 15 μm, and postulated that this structure was a bar at the centre of the galaxy. Later, observations (Leeuw et al. 2002; Quillen et al. 2006) supported a tilted ring scenario to explain the structure observed. Our Herschel observations at 70 μm also show emission from this ring (Fig. 1), and in fact, the high gas-to-dust mass ratio appears to correspond with the 70-μm contours of the ring, as shown in Fig. 7. The models by Quillen et al. (2006) suggest that there is a deficit in the dust distribution at radii less than about 50 arcsec (∼920 pc). This is at a similar radius to our observed high gas-to-dust mass ratio. A dust deficit throughout r≤ 50 arcsec might seem less likely to be related to the AGN and is perhaps better related to star formation activity. Observations probing closer to the nucleus are necessary to determine if the gas-to-dust mass ratio remains high or increases further as we approach the AGN.
5 CONCLUSIONS
We have presented new observations of the dust continuum from the PACS and SPIRE instruments on board the Herchel Space Observatory at 70, 160, 250, 350 and 500 μm. In addition, we present new data tracing the CO J= 3–2 transition taken with the HARP-B instrument mounted on the JCMT. We have used these data to probe the ISM within the disc of Centaurus A on a pixel-by-pixel basis. We observe the ring of emission at 70 μm previously reported at infrared and submm wavelengths, while our 500-μm (and to some extent the 350-μm) images show detections of the non-thermal continuum emission previously reported at 870 μm by Weiß et al. (2008).
We model the dust SED using a single-component modified blackbody and find temperatures of ≤30 K in the centre that decrease with radius. Using the temperature map, we find the total dust mass to be (1.59 ± 0.05) × 107 M⊙. The total gas mass is (2.7 ± 0.2) × 109 M⊙, and combining the dust and gas masses we have produced a gas-to-dust mass ratio map. The average gas-to-dust mass ratio is approximately 103 ± 8, similar to that of the Milky Way, with an interesting peak to about 275 towards the centre of the galaxy. After exploring several possible scenarios to explain the high gas-to-dust mass ratio, the most appealing one is that of a correspondence between the high gas-to-dust mass ratio and the ring about 1 kpc in size, which is best fitted by a warped tilted ring model by Quillen et al. (2006) that consists of a deficit of dusty material inwards of the ring. The deficit of dust may be due to X-ray emission from the central AGN destroying the dust grains or due to the jets removing dust from the centre of the galaxy.
The research of CDW is supported by the Natural Sciences and Engineering Research Council of Canada and the Canadian Space Agency. PACS has been developed by a consortium of institutes led by MPE (Germany) and including UVIE (Austria); KU Leuven, CSL, IMEC (Belgium); CEA, LAM (France); MPIA (Germany); INAF-IFSI/OAA/OAP/OAT, LENS, SISSA (Italy); and IAC (Spain). This development has been supported by the funding agencies BMVIT (Austria), ESA-PRODEX (Belgium), CEA/CNES (France), DLR (Germany), ASI/INAF (Italy) and CICYT/MCYT (Spain). SPIRE has been developed by a consortium of institutes led by Cardiff University (UK) and including University of Lethbridge (Canada); NAOC (China); CEA, LAM (France); IFSI, University of Padua (Italy); IAC (Spain); Stockholm Observatory (Sweden); Imperial College London, RAL, UCL-MSSL, UKATC, University of Sussex (UK); and Caltech, JPL, NHSC, University of Colorado (USA). This development has been supported by national funding agencies: CSA (Canada); NAOC (China); CEA, CNES, CNRS (France); ASI (Italy); MCINN (Spain); SNSB (Sweden); STFC and UKSA (UK); and NASA (USA). hipe is a joint development by the Herschel Science Ground Segment Consortium, consisting of ESA, the NASA Herschel Science Center and the HIFI, PACS and SPIRE consortia. The James Clerk Maxwell Telescope is operated by The Joint Astronomy Centre on behalf of the Science and Technology Facilities Council of the United Kingdom, the Netherlands Organization for Scientific Research and the National Research Council of Canada. This research has made use of the NASA/IPAC Extragalactic Database (NED) which is operated by the Jet Propulsion Laboratory, California Institute of Technology, under contract with the National Aeronautics and Space Administration. This research made use of APLpy, an open-source plotting package for python hosted at http://aplpy.github.com. TJP thanks the anonymous referee for providing constructive feedback about this work.
Footnotes
The Starlink package is available for download at http://starlink.jach.hawaii.edu.
These data are also available at http://www.astro.princeton.edu/draine/dust/dustmix.html.
REFERENCES
Author notes
Herschel is an ESA space observatory with science instruments provided by European-led Principal Investigator consortia and with important participation from NASA.
