


Abstract
We analyse medium-resolution spectra (R∼ 18 000) of 19 late type dwarfs in order to determine v sin i values using synthetic rather than observational template spectra. For this purpose, observational data around 2.2 μm for stars with spectral classes from G8V to M9.5V were modelled. We find that the Na i (2.2062- and 2.2090-μm) and 12CO 2–0 band features are modelled well enough to use for v sin i determination without the need for suitable observational template spectra. Within the limit of the resolution of our spectra, we use synthetic spectra templates to derive v sin i values consistent with those derived in the optical regime using observed templates. We quantify the errors in our v sin i determination due to incorrect choice of model parameters Teff, log g, vmicro, [Fe/H] or full width at half-maximum and show that they are typically less than 10 percent. We note that the spectral resolution of our data (∼16 km s−1) limited this study to relatively fast rotators and that a resolution of 60 000 will be required to access most late-type dwarfs.
1 INTRODUCTION
The rotational velocity of a star is one of the basic parameters that can be obtained from its spectrum. Much effort has been devoted to the determination of surface rotation of objects like protostars (Doppmann et al. 2005) and main-sequence stars with spectral types from mid-F (Charbonneau, Schrijver & MacGregor 1997) through mid-M (Delfosse et al. 1998) until mid-L (Mohanty & Basri 2003) dwarfs.
Precise determinations of stellar rotational velocities are useful for many different analyses. Investigations have been devoted to study of the connection between v sin i and stellar activity (e.g. Noyes et al. 1984; Patten & Simon 1996; Reiners & Basri 2008). Stellar activity (chromospheric and coronal) increases with increasing v sin i for mid-F to mid-M dwarfs. However, the rotational velocity distribution for stars later than M7V differs from the one for early types (e.g. Jenkins et al. 2009), which is likely caused by the onset of fully convective interiors for spectral types ∼ M3V and later (see e.g. Reiners & Basri 2008). Moreover, correlations of rotational velocity with spectral type and age were investigated for both stars of open clusters (Prosser et al. 1996; Stauffer et al. 1994, 1997) and field stars (Delfosse et al. 1998).
Most studies devoted to the determination of rotational velocities used optical spectra and known velocity templates (Bailer-Jones 2004; Jenkins et al. 2009; West & Basri 2009). Recent progress in observational equipment provides spectra of relatively faint dwarfs in the infrared at high resolution and makes it possible to use them in v sin i determinations (e.g. Lyubchik et al. 2007; Reiners 2007; del Burgo et al. 2009). Such studies should help to provide a better description of stellar parameters such as Teff, log g and atmospheric element abundances for late-type dwarfs where they are rather uncertain (e.g. Jones et al. 2005; Johnson & Apps 2009). In this paper we focus on the derivation of rotational velocities in the infrared K band, where there is a good match between observational and theoretical spectra. This match allows rotational velocities to be derived using theoretical spectra and we can quantify the errors in derived stellar properties in a manner not feasible when using template velocities.
2 PROCEDURE
2.1 Observational spectra
For our derivation of rotational velocities, we used the spectra of late-type dwarfs presented in Doppmann et al. (2005). These near infrared spectra were obtained with the 10-m Keck II telescope on Mauna Kea, Hawaii using the Near InfraRed Spectrograph (NIRSpec) during several observing runs. The details of the observations and reduction procedures are described in Doppmann et al. (2005). The resolution of the observed spectra is ∼18 000 (Doppmann et al. 2005), which corresponds to a rotational velocity of ∼16 km s−1 for the spectral regions in which we are interested. These stars are used as standards in several studies of the properties of embedded young stars, including their evolutionary states (Doppmann et al. 2005), rotational and radial velocities (Covey et al. 2005, 2006) and magnetic field strengths (Johns-Krull et al. 2009).
2.2 Synthetic spectra
Synthetic spectra were computed using the wita6 program (Pavlenko 2000). Calculations were carried out under the assumptions of local thermodynamic equilibrium, hydrostatic equilibrium and the absence of sources and sinks of energy. The atomic line list used for our spectral modelling and line identification is taken from the Vienna Atomic Line Database (VALD: Kupka et al. 1999). The solar abundances reported by Anders & Grevesse (1989) were used in calculations. All details of other input parameters are described by Pavlenko, Zapatero Osorio & Rebolo (2000).
For computation of the synthetic spectra we used molecular line lists from different sources.
Water vapour is the main contributor to the line opacity across most of the infrared for late type M dwarfs and brown dwarfs. There are several H2O line lists used at the present time in computations of synthetic spectra of dwarfs (see Pavlenko 2002; Jones et al. 2002, Jones et al. 2003, 2005 for details and comparisons of H2O line lists). In our computations we used the BT2 line list (Barber et al. 2006).
To model the CO band at ∼2.3 μm we used the line list by Goorvitch (1994).
The relative contributions of these molecules to the formation of the spectra around 2.2 μm are shown in Fig. 1. This figure shows synthetic spectra with effective temperatures 2800, 3500 and 4200 K, log g= 5.0, microturbulent velocity vmicro= 2 km s−1 and [Fe/H] = 0.0.
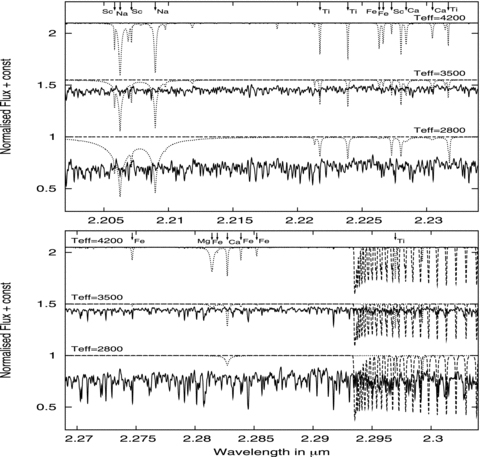
The relative contribution of different opacity sources to the stellar spectra (atomic spectra are shown by dotted lines, molecular spectra of CO and H2O by dashed and solid lines, respectively).
The grid of synthetic spectra was computed from model structures of NextGen (Hauschildt, Allard & Baron 1999) for the following range of parameters: temperatures from 2500–5000 K, log g from 4.5–5.5, microturbulent velocities from 1–3 km s−1 and metallicities from −0.5 to 0.0.
Theoretical spectra were computed with a wavelength step of 10−5 μm and convolved with Gaussians to match the instrumental broadening (R∼ 18 000). The rotational broadening of spectral lines is implemented following Gray (1976).
2.3 Testing of model atmosphere parameters and synthetic spectra
In most papers, determinations of v sin i are made with reference to template spectra (e.g. Mohanty & Basri 2003; Reiners & Basri 2008). Such determinations are based on the assumption that the choice of rotational velocity standard is appropriate. However, in practice rotational velocity standards may have quite different physical properties although they share similar spectra. The primary goal of our paper is to obtain the rotational velocities using synthetic spectra. For these purposes we investigate the effect of small changes in temperature, metallicity, gravity, microturbulent velocity and full width at half-maximum (FWHM) on v sin i determination in the spectral region of interest, 2.2670–2.3050 μm. Our tests are based on the automatic minimization procedure of Pavlenko & Jones (2002).
Table 1 presents the results of analysis for synthetic spectra with effective temperatures 2800, 3500 and 4200 K and v sin i values 10, 20 and 35 km s−1. Other model atmosphere parameters were fixed: log g= 5.0, vmicro= 2 km s−1 and [Fe/H] = 0.0. Hereafter all these parameters are called reference parameters.
The v sin i deviations based on an automatic minimization procedure for different model atmosphere parameters.
| Reference model Teff (K), v sin i (km s−1) | ±0.1 of FWHM | ΔTeff, ±100 K | Δlog g, ±0.5 dex | vmicro±1 km s−1 | Δ[Fe/H] −0.5 dex |
| per cent | per cent | per cent | per cent | per cent | |
| 2800 10 | 18.0 /10.0 | 20.0 /25.0 | 15.0 /5.0 | 20.0 /20.0 | 10.0 |
| 20 | 2.0 /3.0 | 7.5 /12.5 | 10.0 /2.5 | 9.8 /9.8 | 2.5 |
| 35 | <1.0 /<1.0 | 5.7 /8.6 | 5.7 /2.9 | 4.2 /7.0 | 2.9 |
| 3500 10 | 14.6 /12.5 | 5.0 /5.0 | 35.0 /45.0 | 20.0 /25.0 | 45.0 |
| 20 | 2.0 /2.0 | 2.5 /<1.0 | 10.0 /20.0 | 10.0 /10.0 | 15.0 |
| 35 | <1.0 /<1.0 | 1.4 /1.4 | 7.1 /11.4 | 5.7 /5.7 | 8.6 |
| 4200 10 | 16.3 /12.2 | 5.0 /10.0 | 70.0 /40.0 | 20.0 /20.0 | (*) |
| 20 | 2.0 /2.0 | 2.5 /5.0 | 22.5 /17.5 | 10.0 /10.0 | (*) |
| 35 | <1.0 /<1.0 | 1.4 /2.9 | 14.3 /11.4 | 5.7 /5.7 | (*) |
(*) – we had no low-metallicity model atmosphere for this temperature.
First, we analysed how our determination of v sin i reacts to increasing and decreasing the FWHM parameter. Synthetic spectra were computed with reference model atmosphere parameters and then convolved with fixed FWHM corresponding to R= 18 000 (16.65 km s−1) in the 2.2670–2.3050 μm wavelength region. We then changed the instrumental profile width within the limits of 10 per cent. Deviations of the determined v sin i values from the reference v sin i values are presented in column 3 of Table 1. Once the resolution limit is exceeded, the errors in rotational velocity determination depending on instrumental profile decrease to a few per cent. Using synthetic spectra at v sin i= 10 km s−1, the errors are higher but remain less than 20 per cent, which is equal to 2 km s−1, the average accuracy for v sin i determination with template spectra.
Other columns of Table 1 present the percentage deviations of v sin i determination for model atmospheres Δ of Teff, log g, vmicro and [Fe/H] from the reference v sin i values. Macroturbulent velocity is masked by using a Gaussian profile for the FWHM, so we did not analyse this parameter. Errors in v sin i determination related to deviations of model atmosphere parameters are larger than in the case of FWHM. Partially this is caused by the relatively large step of parameters in the available grid of model atmospheres. Even so, the errors are at the ∼10 per cent level, with the only exception being the gravity parameter at 4200 K where the errors increase to 11–23 per cent.
Our investigations indicate that the errors for the reference value v sin i= 10 km s−1 arise from minimization procedure errors while computing v sin i values less than the instrumental resolution, so in Table 1 the model differences are denoted in an italic font. Our method of rotational velocity determination gives v sin i/c∼ 1/R, although in our sample of stars we have no rotators with 17 < v sin i < 25 km s−1 to show this. Thus for the precise determination of rotational velocities we should use spectra with a resolution comparable to or higher than v sin i.
3 RESULTS OF v sin i DETERMINATIONS
Using our grid of synthetic spectra, we investigate the best fits to the observed spectra from Doppmann et al. (2005), which provide partial coverage from 2.0814–2.3040 μm (2.0800–2.1150 μm: Mg 2.1066-μm and Al 2.1099-μm strong lines; 2.1380–2.1750 μm: region containing H i Brγ 2.1661-μm line; 2.2000–2.2390 μm: strong Na 2.2062- and 2.2090-μm lines; 2.2670–2.3050 μm: region with CO 2–0 band head at 2.2935 μm). We show the fits of synthetic spectra to the observed VB 10 (M5 V) in all spectral regions of interest as an example in Fig. 2. The positions of atomic lines according to the VALD are labelled by arrows at the top of each panel.
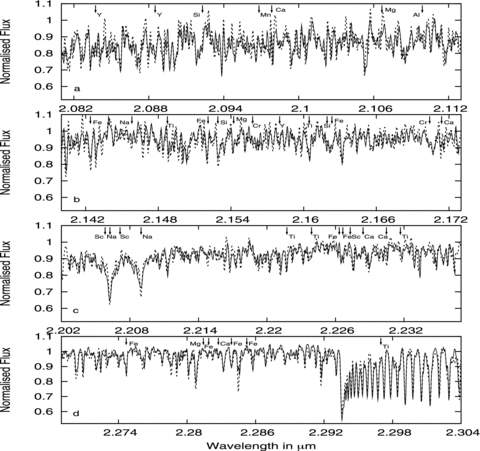
Synthetic spectra (dashed line) fitted to the observed spectra of VB 10 (solid line) in the regions of interest.
We found that our automatic procedure works better for hotter stars, where the contribution of strong molecular water lines is lower or has almost disappeared. However, for the cooler stars we found that the v sin i values derived from the Na lines (2.2062 and 2.2090 μm) and the CO-band lines were usually considerably lower than those derived from other features. Rather than attribute such differences to astrophysical causes, we believe this arises because the Na and CO features are intrinsically stronger than other spectral features and thus suffer less from blending with weak, worse modelled lines, mostly H2O. We focus on two particular regions of interest: 2.2000–2.2390 μm (specifically around the strong Na doublet), hereafter ‘Na region’ and 2.2670–2.3050 μm (specifically around the region with CO-band lines), ‘CO region’ hereafter in the text. Fig. 1 shows these spectral ranges and the identification of other atomic lines in these regions: Fe, Sc, Ti, Mg, Ca and Cr. Fig. 3, along with Fig. 2(c) and (d), shows examples of the best-fitting synthetic spectra for Na and CO regions for stars of different spectral types.
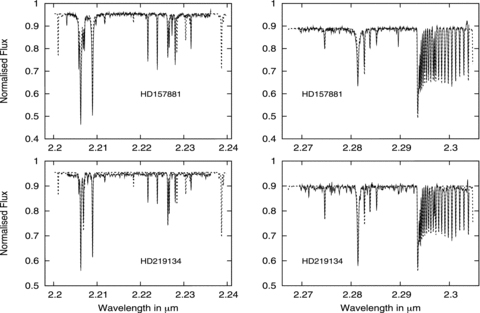
Synthetic spectra (dashed line) fitted to the observations (solid line) for ‘Na’ (left) and ‘CO’ (right) regions for stellar spectra of K-type stars.
Tables 2 and 3 present effective temperature and v sin i determinations for the whole sample of stars from M9.5 to G8 spectral types for the different spectral regions. The optical spectral and luminosity classes taken from the Simbad database1 are also shown. In this work, initial effective temperature estimates were assigned on the based of spectral class using Tsuji, Ohnaka & Aoki (1996) for M dwarfs, Allen (1973) for K dwarfs and Doppmann & Jaffe (2003) for G subdwarfs. Here, log g is defined by fitting to the wings of Na lines in the observed spectrum.
The v sin i determinations for the regions of the K-band Na doublet and CO band.
| ‘Na region’Teff/log g | v sin i | ‘CO region’Teff/log g | v sin i | v sin i Lit. | Ref. | ||
| GJ569B | M8.5 V | 2400 /5.0 | 19.0±6.5 | 2400 /5.0 | 32.0 ± 6.5 | — | |
| 2500 /5.0 | 27.0 ± 1.0 | 2500 /5.0 | 28.0 ± 1.0 | ||||
| GJ 1245A | M5.5 V | 3000 /5.5 | 27.0 ± 1.0 | 3000 /5.5 | 27.0 ± 1.0 | 22.5 ± 2.0 | MB03 |
| 3100 /5.5 | 23.0 ± 1.0 | 3100 /5.5 | 24.5 ± 1.0 | ||||
| GJ791.2 | M4.5 V | 3200 /5.5 | 31.5 ± 3.0 | 3200 /5.5 | 37.5 ± 3.0 | 32 ± 2.0 | MB03 |
| 3300 /5.5 | 34.0 ± 1.0 | 3300 /5.5 | 35.5 ± 1.0 |
MB03 –Mohanty & Basri (2003).
The v sin i upper-limit determinations for the regions of the Na doublet and CO band. Spectral types for observed stars were taken from the Simbad database (http://simbad.u-strasbg.fr/simbad).
| ‘Na region’Teff/log g | v sin i | ‘CO region’Teff/log g | v sin i | v sin i Lit. | Ref. | ||
| LHS2924 | M9 V | 2500/5.0 | 18 | 2600/5.0 | 14 | 11.0 ± 2.0 | MB03 |
| VB10 | M8 V | 2800/5.0 | 12 | 2800/5.0 | 10 | 6.5 ± 2.0 | MB03 |
| VB8 | M6.5 V | 2900/5.0 | 10 | 2800/5.0 | 12 | 9.0 ± 2.0 | MB03 |
| GJ4281 | M6.5 V | 2800/5.0 | 16 | 2900/5.0 | 13 | 7.0 ± 2.0 | MB03 |
| GJ569A | M2.5 V | 3500/5.0 | 12 | 3400/5.0 | 12 | 4 ± 0.6/2.9 ± 0.8 | MCh92 |
| GJ806 | M1.5 | 3600/5.0 | 10 | 3600/5.0 | 12 | 1.5 ± 0.8/3.7 ± 1.6 | MCh92 |
| HD131976 | M1 V | 3700/5.0 | 11 | 3700/5.0 | 13 | 10.6 ± 2.5 | DM88 |
| HD184489 | K5 V | 4000/5.0 | 15 | 4000/5.0 | 15 | ||
| HD201091 | K5 V | 4200/5.0 | 16 | 4200/5.0 | 15 | ||
| HD157881 | K5 IV | 4200/5.0 | 10 | 4200/5.0 | 11 | ||
| ADS14636 | K5 V | 4000/5.0 | 13 | 4200/5.0 | 14 | ||
| HD219134 | K3 V | 4800/5.0 | 10 | 4800/5.0 | 10 | ||
| HD168387 | K2 III | 4400/4.0 | 14 | 4400/4.0 | 12 | ||
| HD166620 | K2 V | 5000/5.0 | 12 | 5000/5.0 | 13 | ||
| HD175225 | G9 IV | 4800/4.5 | 14 | 5000/5.0 | 13 | ||
| HD182572 | G8 IV | 4800/4.5 | 13 | 5000/5.0 | 20 |
DM88 –Duquennoy & Mayor (1988); MCh92 –Marcy & Chen (1992); MB03 –Mohanty & Basri (2003).
The best-fitting synthetic spectra are uncertain to within the range of ±Δ of the model atmosphere parameters. The standard NextGen (Hauschildt et al. 1999) model atmosphere grid steps of ΔTeff= 100 K for temperatures below 4000 K and 200 K above this, Δlog g= 0.5 and Δv sin i= 2 km s−1 are used for determinations of upper-limit values of v sin i. We used solar metallicities for all stellar atmosphere calculations.
For stars with rotational velocity values available from the literature, column (7) in Tables 2 and 3 gives the v sin i values determined using templates. In Mohanty & Basri (2003, hereafter MB03) such a star was Gl 406 with v sin i less than 3 km s−1; in Marcy & Chen (1992, hereafter MCh92) Gl 411 and Gl 820B, with rotational velocities less than 2 km s−1, were used, so two v sin i values are given. In Duquennoy & Mayor (1988),v sin i values were obtained using the widths of the cross-correlation dips based on the calibration of Benz & Mayor (1981, 1984). The v sin i determination by use of the cross-correlation function was studied by other authors. Hartmann et al. (1986) and Rhode, Herbst & Mathieu (2001) indicate that this technique allows v sin i determinations at the 90 per cent confidence level, so the errors are less than 10 per cent.
The differences in the derived model atmosphere parameters for some stars are at the same level as the model grid step. For Teff and v sin i determinations of M dwarfs, only strong atomic lines like Na i 2.2062 μm, 2.2090 μm and lines of the CO molecule can be used. For hotter stars, Mg i 2.2814 μm and Ti i 2.2217, 2.2239, 2.2316, 2.2969 μm can be used.
In Table 2 we present the v sin i determinations for three stars with rotational velocities greater than the instrumental resolution limit. For all stars we provide two values of Teff and v sin i to show the impact of Teff on v sin i determination. Features are shown in Fig. 4. Looking at the sample as a whole in Table 2, it appears that Na and CO derivations of v sin i are consistent within the error bars with the values of Mohanty & Basri (2003) derived using template spectra. We note that systematically slightly higher values of v sin i are derived from the ‘CO region’ than from Na lines. In the ‘CO region’, water lines are slightly stronger (see Fig. 1) and thus can add some ‘extra broadening’ to the CO features.
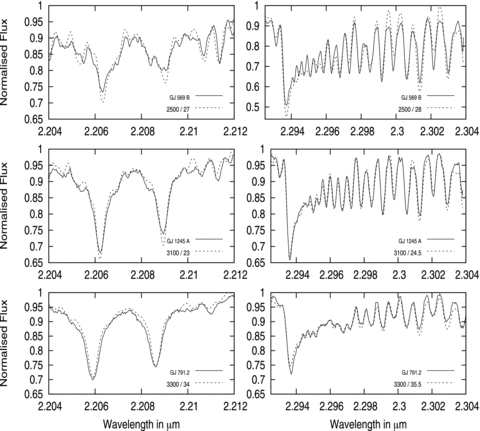
Synthetic spectra (dashed lines) of Na (left) and CO (right) lines fitted to the observed spectra (solid line). Teff (K) and v sin i (km s−1) are shown for the modelled spectra.
We should note that GJ 569B and GJ 1245A are known to be close-orbiting binary systems and this may affect the observations analysed here. Our GJ 569B spectra are formed by near-equal mass and spectral type components: GJ 569Ba M8.5V and GJ 569Bb M9V (e.g. Lane et al. 2001). Our GJ 1245A spectra consist of GJ 1245A (M5.5V) and GJ 1245C spectra. GJ 1245C is 3.3 mag fainter in the V band (Henry et al. 1999) and so can only make a minor contribution in the K band.
Table 3 shows the v sin i upper-limit determination for 16 stars in a wide range of spectral classes from M9 to G8. We do not show the v sin i errors in columns 4 and 6, but from the analysis in Section 2 we infer that the accuracy is about ±2–4 km s−1. Table 3 shows that we can apply synthetic spectra method for the determination of v sin i values through a wide range of stellar spectral types.
4 DISCUSSION
Due to ongoing improvements in input data and synthetic spectra, modelling is becoming a precise method for the determination of stellar atmosphere parameters including rotational velocities. Although there are many remaining uncertainties regarding abundance patterns (Gustafsson 2004), 3D modelling (Pereira, Asplund & Kiselman 2009) and non-local thermodynamic equilibrium (NLTE: see Melendez et al. 2009), the synthetic spectra of solar-type stars are relatively well determined. For the case of cool dwarf stars, the conditions of fully convective atmospheres and dust formation mean that there are still some uncertainties regarding the model structures (e.g. Pavlenko et al. 2007). The presence of many H2O, FeH and other molecular lines in the infrared region also makes spectral analysis and stellar parameter determination rather difficult (see e.g. del Burgo et al. 2009). For example, in the case of cool dwarf atmosphere conditions, broad wings of resonance lines are overlapped by blends of numerous molecular lines. It is very challenging to analyse the pure shape of lines in such spectra and to separate the noise effects from the errors in molecular line modelling.
In this paper we show the perspective of the K-band region, especially individual features like Na or CO lines, as regards use for model atmosphere parameter determination. This region is suitable for such a task because only H2O molecules play a significant role in formation of late-type star spectra here (see Fig. 1 and Pavlenko et al. 2006). Around 2.2 μm there is a good match between observational and synthetic spectra. This circumstance makes the K-band region preferable to the optical region, where there is strong TiO and VO absorption, and the J band (around 1.1 μm), where FeH and CrH along with H2O make spectral analysis much more difficult.
Although there are no established standards for rotational velocity determinations for late-type stars, usually these values are determined using the spectrum of a slowly rotating star with a close spectral type as a template star. Mohanty & Basri (2003) used as template spectrum the M6 dwarf Gl 406, while Marcy & Chen (1992) used spectra of two dwarfs: Gl 411 M2 and Gl 820B M0/K7. The choice of template can affect the result, as is seen in column 7 of Table 3. On the other hand, the synthetic spectra method depends mainly on input parameters. In Section 2 we have shown that model atmosphere parameter deviations within the boundaries of standard model atmosphere grid steps will cause errors of as much as 10 per cent in the region around 2.2 μm.
For stars with rotational velocities above the resolution limit of observed data, our determinations of v sin i and results using the template method are within the error bar (Table 2). Unfortunately the spectral resolution of our observations corresponds to v sin i∼ 16 km s−1, which allows us to perform accurate analysis only for fast rotators. For determination of the rotational velocities of slow rotating M dwarfs with v sin i∼ 5 km s−1, one should have observations with spectral resolution better than ∼60 000. It is worth noting that determination of rotational velocities on a level of a few km s−1 become complicated by uncertainties in the model atmosphere parameters. Deviations of effective temperature, gravity, microturbulent or macroturbulent velocities and other parameters lead to errors in v sin i determination at the level of 1–2 km s−1. In spite of these uncertainties, however, we are sure that the synthetic spectra method applied to suitable spectra in the infrared region will be useful in the determination of v sin i (and other parameters). When the new generation of infrared instruments, e.g. Apache Point Observatory Galactic Evolution Experiment (APOGEE)-like projects,2 start to work, such techniques will enable reliable automated v sin i determination.
We thank Greg Doppmann for acquiring and sharing the data and the authors of the PHOENIX model atmospheres for making their data available. We very much appreciate the referee’s useful comments, which improved this manuscript. We thank the Royal Society and the RoPACS network for support of travel and work.
Footnotes
REFERENCES
