


Abstract
We study the properties of the population of optically dark events present in a carefully selected complete sample of bright Swift long gamma-ray bursts. The high level of completeness in redshift of our sample (52 objects out of 58) allows us to establish the existence of a genuine dark population, and we are able to estimate the maximum fraction of dark burst events (∼30 per cent) expected for the whole class of long gamma-ray burst. The redshift distribution of this population of dark bursts is similar to that of the whole sample. Interestingly, the rest-frame X-ray luminosity (and the de-absorbed X-ray flux) of the subclass of dark bursts is slightly higher than the average luminosity of the non-dark events. At the same time, the prompt properties do not differ and the optical flux of dark events is at the lower tail of the optical flux distribution, corrected for Galactic absorption. All these properties suggest that dark bursts events generate in much denser environments with respect to normal bright events. We can therefore exclude the high-z and the low-density scenarios and conclude that the major cause of the origin of optically dark events is the dust extinction.
1 INTRODUCTION
Gamma-ray bursts (GRBs) are brief and intense flashes of high-energy gamma-rays, originating at cosmological distances and often associated with radiation emitted at longer wavelengths for longer periods, identified as the afterglow. The afterglow is almost always detected in the X-ray band [for ∼95 per cent of the events detected by Swift X-ray Telescope (XRT); Evans et al. 2009], while the optical afterglow is not. The GRBs that have no optical afterglow or a very low optical-to-X-ray flux ratio are classified as ‘dark burst’. Jakobsson et al. (2004) proposed that a GRB should be classified as ‘dark’ if the slope of the spectral energy distribution between the optical and the X-ray band (βOX) is <0.5. This working definition is a direct implication of the simplest fireball model. In fact, the spectral index β (Fν ∝ ν−β) is related to the power-law index of the electron energy distribution (p) and the location of the cooling frequency (νc), independently of the nature of circumburst environment (homogeneous or wind-like) and the collimation of the outflow (see Sari, Piran & Narayan 1998). The average value of βOX is then expected to be between 0.5 (if p= 2 and νc lies above the X-ray band) and 1.25 (if p= 2.5 and νc lies below the optical frequency). Therefore, any optically subluminous burst should be located below a constant line βOX= 0.5 in an optical versus X-ray flux (fO–fX) diagram, providing that the fluxes are estimated at a common time, chosen to be tobs= 11 h post-burst (Jakobsson et al. 2004). A slightly more elaborated method was presented by Rol et al. (2005) that compared the optical and X-rays fluxes at a given time extrapolating the latter to the optical band using not only the spectral index but also the temporal power-law index, in the context of the standard fireball model. Both Jakobsson et al. (2004) and Rol et al. (2005) found similar results (∼10–20 per cent of possible dark bursts) on samples of pre-Swift GRBs, and these methods are still used as immediate diagnostic tools to discriminate between optically bright and dark bursts.
Recently, van der Horst et al. (2009) proposed a new method for the optical classification of dark GRBs. Their method is less affected by assumptions about the emitting region with respect to the one done in Jakobsson et al. (2004). They improved the previous method by defining the region of optically (subluminous) dark bursts in the βOX–βX plane: they are located below the dividing line of βOX=βX− 0.5. In the same diagram, optically bright bursts are placed above the line βOX=βX, while all the GRBs that are still consistent with the fireball model will lie in the region defined by the relations βOX=βX and βOX=βX− 0.5. Optically bright events, for which the optical luminosity is too high if compared to the X-ray luminosity, are pretty rare, while there is a sizable fraction of events for which the X-ray emission seems to be in excess with respect to the observed optical one.
Based on these definitions, studies on GRBs samples in the Swift era showed that, despite an advancement on the GRB detection quality both in the prompt response and position accuracy, the fraction of genuinely dark GRBs remains significant. Melandri et al. (2008), Cenko et al. (2009), Zheng, Deng & Wang (2009), Gehrels et al. (2008), Fynbo et al. (2009) and Greiner et al. (2011) found a fraction of dark GRB in their samples of about 50, 50, 20, 20, 30 and 40 per cent, respectively. A higher fraction of dark GRBs is found in samples based on observations done by single ground-based telescopes (i.e. the 2-m Liverpool and Faulkes telescopes, Melandri et al. 2008; the 60-inch Palomar telescope, Cenko et al. 2009; the 2.2-m GROND telescope, Greiner et al. 2011), while a smaller fraction is detected if the whole Swift sample is considered (Gehrels et al. 2008; for GRBs up to the end of 2007). This difference is certainly related to the different properties of the GRB samples considered. In any case, the population of dark bursts seems to be ≥20 per cent of the entire GRB class.
In the era of rapid follow-ups, the darkness of these events could not be ascribed to the lack of sensitivity, late observational times or rapid temporal decays (Roming et al. 2006; Melandri et al. 2008). Different scenarios have been proposed to explain it.
Low-density scenario. If the relativistic ejecta decelerate in a uniform low-density medium, then the optical afterglow can be intrinsically faint with respect to the X-ray emission.
Dust scenario. If dark bursts are exploding in galaxies with local thick and dusty (i.e. high metallicity) environments (with possibly some intervening systems along the line of sight), their optical afterglows could be suppressed by extinction, without thereby affecting their higher energy radiation. The extinction law characterizing the bursts environment might be similar to that observed in the local Universe or biased towards large dust grains.
High-redshift scenario. If the burst is occurring at very large distances, its visible light could be completely extinguished as a result of the absorption of the Lyα forest and Lyα dropout redshifted into the optical bands.
The latter explanation seems to be responsible for the non-detection only for a small fraction of the population of ‘dark burst’ (Greiner et al. 2011), while a combination of the first two effects seems to be a more realistic scenario (Perley et al. 2009).
In this paper, we will investigate the properties of the population of ‘dark burst’ present in a complete subsample of Swift long GRBs, with a high percentage of redshift determination (Nava et al. 2011; Salvaterra et al. 2011). The use of a complete subsample of GRBs allowed us to draw more firm conclusions about the properties of this class of events with no bias in the selection criteria. The paper is organized as follows. In Section 2, we will describe the general properties of the dark bursts that belong to our selected sample. We then discuss the results on the dark bursts population, their redshift distribution and their luminosity in Section 3, and finally we draw our conclusions in Section 4. Throughout the paper, we assume a standard cosmology with H0= 70 km s−1 Mpc−1, Ωm= 0.3 and ΩΛ= 0.7.
2 SAMPLE SELECTION
The 58 GRBs in our sample have been selected to be relatively bright in the 15–150 keV Swift Burst Alert Telescope (BAT) band, i.e. with the 1-s peak photon flux P≥ 2.6 photon s−1 cm−2, and have favourable conditions for ground-based multiwavelength follow-up observations1 (Nava et al. 2011; Salvaterra et al. 2011). This corresponds to an instrument that is about six times less sensitive than Swift. Therefore, whatever GRB would have exploded in the sky with a flux equal to or brighter than this limit, BAT would have detected for sure (if it was in its field of view). With this limit, no GRB would have been missed; in the meantime, this value gives us also a reasonable number of GRB to perform statistical studies. Therefore, our sample is complete with respect to this flux limit; it is of course biased towards the bright GRBs, but it is complete. Moreover, it turned out that ∼90 per cent of these bursts have also a redshift determination (∼95 per cent have a constrained redshift).
From the observed light curve of each burst in our sample (as reported in the Burst Analyser of Evans et al. 2010), we estimated the fluxes at tobs= 11 h in the X-rays (fX at 3 keV 2). In the optical band, we used all the available public data to build the optical light curve, corrected for the Galactic absorption, and measure the optical flux (fO in the R filter) at t=tobs. We then used those two fluxes to calculate the values of the spectral index βOX and we collected from the spectrum repository the values of the X-ray spectral index (βX) from the late-time spectrum fit (Evans et al. 2009). All the values are reported in Table 1. For the majority of the bursts in our sample, we were able to estimate the fluxes with good accuracy: in only one case (GRB 070328) it was not possible to estimate the optical flux due to the lack of optical observations. Instead, for the cases that had not enough detections to sample their decay, the value at 11 h was estimated by interpolations and extrapolations of their observed light curve. We report below the assumptions that we made for these cases.
Properties of our samples: we reported the observed X-ray (fX) and optical (fO) fluxes at t= 11 h post-burst together with the βX from the Swift burst spectrum repository (Evans et al. 2009) and the estimated values of βOX (at tobs= 11 h) and β′OX (at t′obs= 600 s.). GRBs with βOX < 0.5 are in bold font, while in italic we show the three GRBs that we excluded from our analysis (see main text for details).
| GRB | Redshift | fX (μJy) | fO (μJy) | βX | βOX | β′OX | GRB | Redshift | fX (μJy) | fO (μJy) | βX | βOX | β′OX |
| 050318 | 1.44 | 0.036 ± 0.010 | 14.386 ± 1.633b | 0.95+0.07−0.06 | 0.816 | 0.443 | 080602 | ∼1.4 | – | <3.703c | 0.90+0.12−0.13 | – | – |
| 050401 | 2.90 | 0.272 ± 0.067 | 2.205 ± 0.210a | 0.83+0.15−0.14 | 0.285 | 0.220 | 080603B | 2.69 | 0.085 ± 0.016 | 45.996 ± 6.373a | 0.87+0.26−0.21 | 0.859 | 0.695 |
| 050416A | 0.65 | 0.046 ± 0.012 | 4.678 ± 0.296a | 1.11+0.11−0.14 | 0.629 | 0.477 | 080605 | 1.64 | 0.080 ± 0.017 | 12.758 ± 0.470a | 0.86+0.11−0.16 | 0.689 | 0.286 |
| 050525A | 0.61 | 0.068 ± 0.014 | 36.076 ± 5.913a | 1.08+0.15−0.13 | 0.854 | 0.868 | 080607 | 3.04 | 0.034 ± 0.008 | 0.046 ± 0.004a | 1.13+0.06−0.11 | 0.038 | 0.217 |
| 050802 | 1.71 | 0.050 ± 0.014 | 12.417 ± 1.190b | 0.89+0.04−0.07 | 0.749 | 0.893 | 080613B | – | 0.0014 ± 0.0007 | <0.631c | 1.39+1.28−0.87 | <0.829 | <1.220 |
| 050922C | 2.20 | 0.020 ± 0.005 | 36.194 ± 4.527a | 1.25+0.06−0.07 | 1.019 | 0.720 | 080721 | 2.59 | 0.307 ± 0.064 | 27.216 ± 2.510a | 0.91+0.05−0.05 | 0.611 | 0.616 |
| 060206 | 4.05 | 0.090 ± 0.021 | 76.699 ± 3.943a | 1.30+0.57−0.53 | 0.919 | 0.797 | 080804 | 2.20 | 0.029 ± 0.008 | 8.385 ± 0.309a | 0.97+0.12−0.12 | 0.769 | 0.529 |
| 060210 | 3.91 | 0.275 ± 0.067 | 1.164 ± 0.291a | 1.08+0.05−0.05 | 0.196 | 0.390 | 080916A | 0.69 | 0.088 ± 0.024a | 7.239 ± 0.200 | 1.07+0.13−0.18 | 0.601 | 0.657 |
| 060306 | 3.50 | 0.054 ± 0.012 | <9.009b | 1.38+0.06−0.15 | <0.696 | <0.762 | 081007 | 0.53 | 0.089 ± 0.023 | 22.315 ± 0.822a | 1.04+0.10−0.18 | 0.752 | 0.618 |
| 060614 | 0.13 | 0.269 ± 0.066 | 71.082 ± 3.943a | 0.89+0.06−0.04 | 0.759 | 0.199 | 081121 | 2.51 | 0.254 ± 0.050 | 33.012 ± 6.116a | 0.95+0.08−0.08 | 0.663 | 0.792 |
| 060814 | 1.92 | 0.194 ± 0.050 | <0.851c | 1.13+0.07−0.07 | <0.201 | <0.091 | 081203A | 2.10 | 0.030 ± 0.007 | 40.409 ± 6.507a | 1.14+0.09−0.10 | 0.981 | 1.047 |
| 060904A | – | 0.079 ± 0.019 | <0.001b | 0.28+0.74−0.47 | – | – | 081221 | 2.26 | 0.076 ± 0.021 | <0.406c | 1.50+0.12−0.11 | <0.228 | <0.003 |
| 060908 | 1.88 | 0.008 ± 0.002 | 8.079 ± 0.361a | 1.42+0.32−0.36 | 0.937 | 0.524 | 081222 | 2.77 | 0.118 ± 0.031 | 4.586 ± 0.550a | 1.03+0.07−0.06 | 0.498 | 0.557 |
| 060912A | 0.94 | 0.016 ± 0.004 | 7.075 ± 2.786a | 0.71+0.19−0.25 | 0.829 | 0.671 | 090102 | 1.55 | 0.127 ± 0.031 | 4.773 ± 0.484a | 0.78+0.06−0.08 | 0.493 | 0.362 |
| 060927 | 5.47 | 0.005 ± 0.002 | 3.568 ± 1.447a | 0.96+0.33−0.25 | 0.881 | 0.642 | 090201 | <4.0 | 0.155 ± 0.037 | <0.357c | 1.25+0.10−0.10 | <0.113 | <−0.207 |
| 061007 | 1.26 | 0.048 ± 0.012 | 16.240 ± 0.228a | 1.01+0.09−0.06 | 0.792 | 0.799 | 090424 | 0.54 | 0.361 ± 0.082 | 31.319 ± 2.309a | 0.95+0.10−0.09 | 0.607 | 0.476 |
| 061021 | 0.35 | 0.169 ± 0.047 | 33.468 ± 2.058b | 1.00+0.04−0.05 | 0.720 | 0.620 | 090709A | <3.5 | 0.463 ± 0.113 | <1.124b | 0.99+0.08−0.08 | <0.120 | <−0.336 |
| 061121 | 1.31 | 0.322 ± 0.079 | 23.474 ± 0.345a | 0.91+0.06−0.06 | 0.584 | 0.460 | 090715B | 3.00 | 0.035 ± 0.010 | 15.853 ± 0.730a | 1.04+0.09−0.09 | 0.832 | 0.425 |
| 061222A | 2.09 | 0.302 ± 0.082 | <4.303c | 0.95+0.07−0.06 | <0.361 | <−0.125 | 090812 | 2.45 | 0.070 ± 0.018 | 1.381 ± 0.216a | 0.95+0.07−0.06 | 0.404 | 0.503 |
| 070306 | 1.50 | 0.545 ± 0.113 | <2.543c | 0.95+0.07−0.06 | <0.209 | <0.446 | 090926B | 1.24 | 0.035 ± 0.005 | 0.748 ± 0.117b | 0.95+0.07−0.06 | 0.424 | 0.283 |
| 070328 | 4.0 | 0.230 ± 0.058 | – | 0.95+0.08−0.08 | – | – | 091018 | 0.97 | 0.073 ± 0.020 | 35.938 ± 6.657a | 1.10+0.18−0.23 | 0.844 | 0.537 |
| 070521 | 1.35 | 0.095 ± 0.020 | <1.878c | 1.03+0.15−0.13 | <0.405 | <−0.005 | 091020 | 1.71 | 0.088 ± 0.024 | 11.866 ± 0.437a | 1.11+0.05−0.06 | 0.667 | 0.720 |
| 071020 | 2.15 | 0.092 ± 0.031 | 3.843 ± 2.294a | 0.89+0.16−0.14 | 0.508 | 0.499 | 091127 | 0.49 | 1.157 ± 0.284 | 214.595 ± 39.757a | 0.80+0.11−0.11 | 0.711 | 0.399 |
| 071112C | 0.82 | 0.017 ± 0.004 | 6.105 ± 0.561a | 0.79+0.21−0.27 | 0.799 | 0.313 | 091208B | 1.06 | 0.058 ± 0.013 | 13.102 ± 3.665a | 0.94+0.13−0.08 | 0.736 | 0.451 |
| 071117 | 1.33 | 0.035 ± 0.008 | 0.628 ± 0.080a | 1.09+0.13−0.19 | 0.392 | 0.475 | 100615A | – | 0.651 ± 0.156 | <1.000c | 1.39+0.20−0.20 | <0.058 | <−0.198 |
| 080319B | 0.94 | 0.195 ± 0.051 | 61.390 ± 4.772a | 0.82+0.06−0.06 | 0.784 | 0.577 | 100621A | 0.54 | 0.416 ± 0.098 | <5.021c | 1.40+0.13−0.12 | <0.278 | <0.096 |
| 080319C | 1.95 | 0.069 ± 0.016 | 1.984 ± 0.091a | 0.97+0.28−0.23 | 0.457 | 0.094 | 100728B | 2.11 | 0.010 ± 0.002 | 5.242 ± 0.532a | 1.08+0.17−0.18 | 0.856 | 0.655 |
| 080413B | 1.10 | 0.105 ± 0.028 | 49.461 ± 1.822a | 0.97+0.05−0.07 | 0.838 | 0.485 | 110205A | 2.22 | 0.024 ± 0.005 | 29.684 ± 2.738a | 1.13+0.09−0.09 | 0.970 | 0.406 |
| 080430 | 0.77 | 0.148 ± 0.041 | 36.649 ± 2.567a | 1.06+0.06−0.07 | 0.751 | 0.817 | 110503A | 1.613 | 0.106 ± 0.029 | 29.189 ± 2.422a | 0.95+0.04−0.06 | 0.764 | 0.419 |
Note. Optical fluxes have been corrected for the Galactic absorption and obtained by:
ainterpolation of the light curve;
bextrapolation of the light curve;
cassuming as a conservative value the closest upper limit (the exact times are reported in Section 2).
GRB 060814, GRB 061222A, GRB 070306, GRB 070521, GRB 080613B, GRB 090201, GRB 100621A. For these bursts, we considered, as a conservative upper limit for fO, the closest (and deepest) upper limit (or detection) in the optical band to t=tobs. For these GRBs, the individual times at which fO was estimated were 0.97, 0.54, 33.7 (host detection), 0.61, 10.7, 7.5 and 6.0 h, respectively. This allows us to put a safe upper limit on βOX.
GRB 060306, GRB 061021. For these bursts, there were only few optical detections or upper limits, so we needed to extrapolate fO from the closest observation to t=tobs, assuming αR= 1.0.
GRB 080603B. The last X-ray observation was acquired ∼3.3 h after the burst. For this event, we extrapolated fX assuming the observed decay slope αX∼ 1.8.
GRB 060904A. For this event, there is a gap in the XRT data that does not allow us to constrain the value of βOX. Using late-time data acquired with the photon counting (PC) mode (mean photon time arrival ∼58.5 ks), we obtain βPCX= 0.28+0.40−0.47, while using the data acquired with the windowed timing (WT) mode (mean photon time arrival ∼0.35 ks) the value is βWTX= 1.07 ± 0.05. Moreover, there are no secure optical detections. Therefore, we could only put a conservative upper limit on the value of fO for this event. Due to this uncertainty, we excluded this event from our analysis.
GRB 080602. Only an optical upper limit at early time (∼3.4 h post-burst; Malesani et al. 2008) is available for this event. Also the XRT observations stop after ∼0.4 h with a not well-defined decay slope. This prevented us from estimating fO, fX and thus βOX with good accuracy. We also excluded this event from our analysis.
GRB 081221. As a conservative upper limit for the optical flux at t=tobs, we considered the only optical detection at ∼9 h, having in mind that this value could be contaminated by the host galaxy (Alfonso et al. 2008).
GRB 090709A. The optical decay of this event is not well defined since the afterglow has been detected in the R filter for only three epochs (Guidorzi et al. 2009; Cenko et al. 2010). We extrapolated the optical flux using the observed value of the optical decay (αR∼ 0.3) and we decided to consider this flux as conservative upper limit of fO.
GRB 100615A. Very conservatively we assumed the observed upper limit at ∼0.3 h (Nicuesa et al. 2010) as the upper limit for the optical flux. Even assuming the optical flux at such an early time, the βOX remains pretty low (∼0.06). In fact, the nature of this burst has already been analysed and discussed in detail by D’Elia & Stratta (2011), showing how this event is indeed a very dark burst.
After this analysis, we ended up with a total of 55 GRBs (49 with secure redshift) for which it was possible to estimate the value (or an upper limit) of βOX at the observed time tobs= 11 h post-burst.
3 RESULTS AND DISCUSSION
3.1 Dark bursts population
For all the GRBs in our sample, we estimated the optical flux (fO) and the X-rays flux (fX) in the observed frame at a common time tobs= 11 h. Then we calculated the values of βOX and we took the estimates of βX from the Swift burst spectrum repository (late-time PC-mode data; Evans et al. 2009). With these data, we reproduced the dark bursts distribution of our sample according to the definition and diagram of Jakobsson et al. (2004) and van der Horst et al. (2009). The results are shown in Fig. 1.
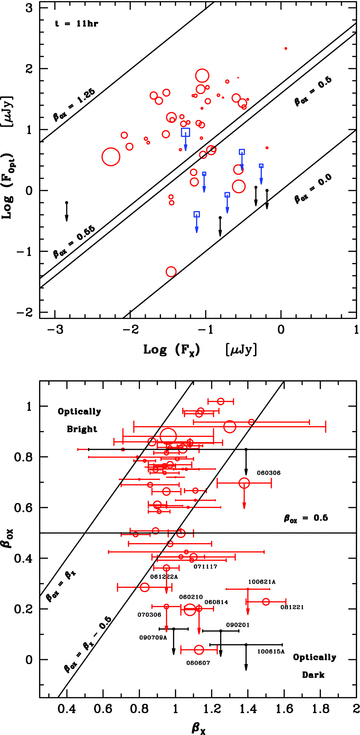
Top panel: dark bursts distribution in our sample according to the definitions of Jakobsson et al. (2004). Open red circles and blue squares are GRBs with secure redshift, while filled black circles are the GRBs with no redshift measurement. Bottom panel: dark bursts distribution according to the definitions of van der Horst et al. (2009). The dimension of the symbol for both plots is a direct visual of the value of the redshift of the GRB; the larger the symbol the bigger the associated redshift.
Following the practical definition of Jakobsson et al. (2004), we find a total of 18 GRBs lying below the βOX= 0.5 line: 10 of them are optically detected (nine with secure redshift: GRB 050401, GRB 060210, GRB 071117, GRB 080319C, GRB 080607, GRB 081222, GRB 090102, GRB 090812 and GRB 090926B; one with no redshift: GRB 090709A), while for the remaining eight only upper limits in the optical bands are available (five with redshift: GRB 060814, GRB 061222A, GRB 070306, GRB 070521 and GRB 100621A; three with no redshift: GRB 081221, GRB 090201 and GRB 100615A). In the βOX–βX plane defined by van der Horst et al. (2009), only 11 out of these 18 events above (GRB 060210, GRB 060814, GRB 061222A, GRB 070306, GRB 071117, GRB 080607, GRB 081221, GRB 090201, GRB 090709A, GRB 100615A and GRB 100621A) still fall into the region for the optically dark events.3 The remaining seven (GRB 050401, GRB 080319C, GRB 081222, GRB 090102, GRB 090812, GRB 090926B and GRB 050721) still have βOX consistent with βX− 0.5.
The fraction of dark bursts in our sample, including both detections and optical upper limits, is ∼32.7 per cent (18 out of 55 events) according to the Jakobsson et al. (2004) definition and ∼20.0 per cent (11/55) with respect to the van der Horst et al. (2009) diagram. These results are similar to previous studies of dark bursts in the Swift era (Gehrels et al. 2008; Fynbo et al. 2009), confirming the existence of a genuine dark bursts population. Finally, if we include in our analysis also the three GRBs for which we do not have an accurate estimate of βOX (events in italic font in Table 1), we obtain a strong upper limit for the fraction of the population of dark bursts of ∼36 per cent in the case of Jakobsson et al. (2004) definition; the upper limit is ∼26 per cent in the case of the van der Horst et al. (2009) definition, for which we consider also GRB 060306 as a possible dark burst (Table 2).
Fraction of dark bursts in our sample according to the definitions of Jakobsson et al. (2004) and van der Horst et al. (2009). The third column represents the strongest upper limit of the fraction of dark bursts when considering also the three excluded GRBs as possible dark bursts.
| Definition | Dark bursts (per cent) | Max. dark bursts (per cent) |
| βOX < 0.5 | 32.7 | <36.2 |
| βOX < βX− 0.5 | 20.0 | <25.9 |
| Definition | Dark bursts (per cent) | Max. dark bursts (per cent) |
| βOX < 0.5 | 32.7 | <36.2 |
| βOX < βX− 0.5 | 20.0 | <25.9 |
We note that from our analysis GRB 050401 is not classified as dark in the van der Horst et al. (2009) diagram, while these authors classified it as dark. This difference is due to the fact that van der Horst et al. (2009) used the quick available X-ray spectral index βX, while we decided to use the more accurate value from the late-time spectrum. This choice should be more accurate as the average value of βX is usually estimated around the chosen time for the measurement of the optical and X-ray fluxes.
3.2 Darkness evolution
The historical choice to extrapolate the optical and X-ray fluxes to the common time tobs= 11 h has been motivated by the need to measure only the radiation arising from the afterglow component, ensuring the cessation of the possible central engine activity and the end of the plateau phase. However, the nature of a dark burst can be further investigated by looking at the evolution of its darkness. In principle, early- and/or late-time central engine activity can mask the real forward shock X-ray emission, adding an additional component that might be not so relevant at later times. Therefore, the total flux in that band at early time would be higher than the expected emission from the X-ray forward shock alone. The increase of the X-ray emission with respect to the optical one, for example during the so-called plateau phase, would change the value of βOX and therefore the estimate of the darkness for some events (previously noted also in Melandri et al. 2008). Flares are seen only for a few events in our sample and they are not responsible for the darkness of the events in our sample. We investigated the darkness evolution of the GRBs in our sample by estimating, when possible, the spectral index β′OX at an earlier time t′obs= 600 s after the burst event.
We then reclassified the dark bursts according to the definition of van der Horst et al. (2009) and compared the values of βOX at early and late times. Results are shown in Fig. 2: this diagram is divided in four regions differently populated. The upper left-hand quadrant is occupied by bright events (filled triangles) and by those events that are classified dark at early time but they are not dark at tobs= 11 h (open symbols): typical example of this class is GRB 050416A, classified as dark at t= 600 s, still dark at t= 1000 s (Cenko et al. 2009; Perley et al. 2009) but no longer dark at late time. These are the events for which the central engine is probably still active at early time. Located in the upper right-hand quadrant are the GRBs that are always bright. The bottom right-hand quadrant is the region that would be populated by GRBs that are not dark at early time and that evolve to become dark at late time: this is an implausible case and this region is indeed not populated. This region would be populated by bursts having an additional X-ray component at late time. Finally, in the bottom left-hand quadrant, we find those events that are classified as dark according to van der Horst et al. (2009) at any given time (filled squares), the events that are compatible with the criterion of van der Horst et al. (2009) at t=tobs or t′obs (open symbols), and also the remaining dark bursts according to the Jakobsson et al. (2004) definition only (filled circles).
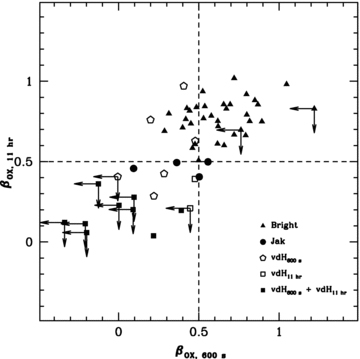
Darkness evolution from t′obs= 600 s to tobs= 11 h of the events in our sample. See legend and main text for details about different symbols; ‘Jak’ and ‘vdH’ refer to Jakobsson et al. (2004) and van der Horst et al. (2009) dark burst definition, respectively.
We note that, according to the definition of Jakobsson et al. (2004), the fraction of dark bursts at early time (∼50 per cent) is much higher than the fraction at late time (∼33 per cent, Table 2), while with the criterion of van der Horst et al. (2009) these fractions are similar, being ∼27 and ∼20 per cent at early and late time, respectively. This is clearly visible in Fig. 2 where some bright events populate the upper left-hand quadrant. Such a high percentage of dark bursts was previously reported in works based on sample of GRBs observed with ground-based facilities (Melandri et al. 2008; Cenko et al. 2009). In general, we can say that bona fide dark events are the ones that are found to be dark both at early and late time (≥14 per cent, filled squares in Fig. 2). This fraction increases to a maximum of ∼25–35 per cent when considering only late-time optical and X-ray emission.
3.3 Dark bursts redshift distribution
Thanks to the high completeness in redshift of our sample, we built the cumulative redshift distribution for the subclass of optically dark bursts (Fig. 3). In this plot, we show the distribution for our entire sample of GRBs together with the ones for dark bursts according to both definitions from literature (‘DB Jak’ for Jakobsson et al. 2004; ‘DB vdH’ for van der Horst et al. 2009). To quantify the existence of a separated populations of optically dark bursts, we applied the Kolmogorov–Smirnov (KS) statistic to our subsample of optically dark events.
![Cumulative redshift distribution of dark bursts [cyan and dark olive according to van der Horst et al. (2009) and Jakobsson et al. (2004) definition, respectively] compared with our whole sample (dark red).](https://oup.silverchair-cdn.com/oup/backfile/Content_public/Journal/mnras/421/2/10.1111/j.1365-2966.2011.20398.x/2/m_mnras0421-1265-f3.jpeg?Expires=1750189380&Signature=zVMYZRd00MSSb7ZP9dLYl5WX~Xey2beeiFcSkYlzrrCyH8-DMbWejQCxy7kIRzqxV0a-ELK~Kxj9BdKp6QorvjsxYYpYcS1s0tlXye6K5kTnkWy7juK42LhsDiAIrUY5rn7lfUKfAHQ6DqGEK5n4iJcYW-jgoWJ89vTkoaCl0pMUlyWACGwQDxEgtLDlL5jd-k4SqGSFI7x0ypm8CDxy2r6vj92byV~csPD7n8fzwPxfiCIMiGyNjCGcMky2Ort2I~dY1N~Q2-LO81NcLoatbQ8o3zrNcgoV9YJiXE2adTnp-gAaZ0LxO8MPTkIpuJgo1TYFHkOXnCWhmYhqiFkdVA__&Key-Pair-Id=APKAIE5G5CRDK6RD3PGA)
Cumulative redshift distribution of dark bursts [cyan and dark olive according to van der Horst et al. (2009) and Jakobsson et al. (2004) definition, respectively] compared with our whole sample (dark red).
For both definitions, we compared the distribution of dark bursts population to that of the whole sample, including (zall) and excluding (zno-DB) the dark bursts considered. Results are reported in Table 3, where we quantify the maximum deviation between the cumulative redshift distributions (D) and the associated probability that two set of data are drawn from the same distribution (P). In order to say something conclusive about two populations being separated, the value of P should be as low as possible. Clearly, the subsample of dark bursts, independently by the definition, is consistent with coming from the same population of the whole sample (Table 3).
Result of the KS tests for our sample. DB(Jak) are the events classified as dark according to the definition of Jakobsson et al. (2004), while DB(vdH) are the dark events following van der Horst et al. (2009).
| Samples | D | P |
| zDB(Jak) versus zall | 0.062 | 0.999 |
| zDB(vdH) versus zall | 0.122 | 0.999 |
| zDB(Jak) versus zno-DB(Jak) | 0.065 | 0.999 |
| zDB(vdH) versus zno-DB(vdH) | 0.119 | 0.999 |
| zDB(Jak) versus zDB(vdH) | 0.116 | 0.999 |
| Observed frame | ||
| fX, 11 h, DB versus fX,11 h,no-DB | 0.517 | 0.010 |
| fO, 11 h, DB versus fO,11 h,no-DB | 0.767 | 2.14 × 10⁻⁵ |
| Rest frame | ||
| LX, 11 h, DB versus LX,11 h,no-DB | 0.461 | 0.076 |
| Eiso, DB versus Eiso,no-DB | 0.375 | 0.240 |
| Epeak, DB versus Epeak,no-DB | 0.225 | 0.840 |
| Liso, DB versus Liso,no-DB | 0.350 | 0.314 |
The range of redshift for the events in our sample belonging to the optically dark region spans from 0.54 up to 3.91. The contribution of high-z events in our sample for the dark bursts population can be estimated to be ≤3.6 per cent; in fact, only two events out of the 55 that we considered in our analysis do not have a redshift determination and can, in principle, be at very high-z. Theoretical models for GRBs redshift distribution predict ≤1 dark event at a redshift z > 6 (Salvaterra et al. 2011), which is indeed what we observe in our complete sample of 58 GRBs (Fig. 3). This allows us to ascertain that the darkness of the fraction of bursts in our sample that satisfy the dark bursts definition of van der Horst et al. (2009) is not due to the so-called high-redshift scenario.
3.4 Dark bursts X-ray luminosity
Using the observed X-ray fluxes, we calculated the rest-frame unabsorbed X-ray luminosity for each event with secure redshift in our sample at a common rest-frame time t= 11 h. We then investigated the properties of the subclass of dark bursts compared to the bright bursts.
Pre-Swift studies of the X-ray properties of optically bright and dark bursts show that the latter seems to be on average five times fainter in the X-ray band than optically bright events (de Pasquale et al. 2003). In their sample, de Pasquale and collaborators had 31 GRBs, with 20 events belonging to the ‘dark’ subclass and the remaining 11 bursts with an optically detected afterglow. However, their definition of ‘dark’ event was only based on the absence in the optical band of a detected afterglow, resulting in upper limits for the optical flux of these events. Using those upper limits to infer the upper limits on βOX, we find that only three events (of the 20 reported in their Table 1) would have been classified as dark bursts according to the definition of Jakobsson et al. (2004). Therefore, their results are biased and not representative of the differences between the dark and bright populations.
Instead, in our complete sample we have an indication that the observed X-ray fluxes of the dark events are, on average, larger than the fluxes of bright events. This is still true, but slightly less significant (Table 3 for the results of the KS tests), when we consider the rest-frame X-ray luminosity. In Fig. 4, we show the histograms that summarize the properties of the dark population with respect to the standard bright bursts. The prompt properties, such as Eiso, Epeak and Liso, do not differ and are still consistent with a single population of events.4 The class of dark bursts does show a clear difference on the amount of X-ray absorbing column density, having systematically higher column densities with respect to bright events, as studied in detail by Campana et al. (2011). In the optical and X-ray bands, the two classes seem to be well defined, although a clear dichotomy is not visible. The dark bursts are at the same time on the lower tail of the optical flux distribution and on the higher tail of the X-ray flux distribution. In other words, they are consistently less luminous in optical and more luminous in X-rays. This is conserved and still visible in the high tail of the X-ray luminosity distribution (Fig. 4).
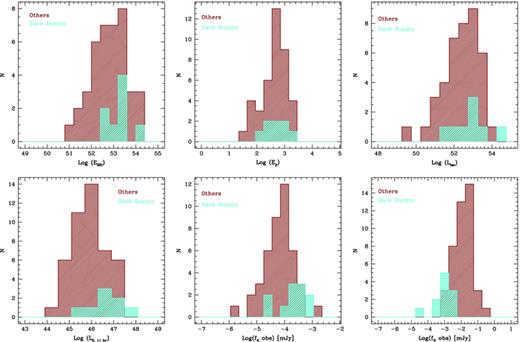
Histograms of the properties of dark (cyan) and non-dark (dark red) events: dark bursts have similar prompt properties (here we show the estimated isotropic energy Eiso, the peak energy Epeak and the isotropic luminosity Liso), higher X-ray luminosity (LX) and observed flux (fX), and lower observed optical flux (fO).
The higher X-ray luminosity for some GRBs can be a direct consequence of the fact that the X-ray emission is the sum of emission coming from internal and external processes, long-lived central engine or late prompt emission (e.g. Ghisellini et al. 2007). An additional emission will enhance the X-ray emission with respect to that expected from the forward shock emission alone. In the case of the dark population in our sample, the contribution of one of these components might be more pronounced, resulting in a higher X-ray luminosity than the ‘normal’ events. However, this might be the explanation for those events that display an evolution of their darkness from early to late time, since this additional component might be more active at early times. As shown in Fig. 2, this is the case for a few events that would be classified as dark at early time, which subsequently lost their darkness at later time (upper left-hand quadrant in Fig. 2). None of the GRBs classified as dark in our sample displays this behaviour and therefore, even if they tend to lie in the high end of the X-ray flux and luminosity distribution, this cannot be the explanation of their darkness.
A possible explanation of the slightly higher X-ray luminosity of the dark bursts could be found in the different local environment of these event with respect to normal bursts. Dark bursts are the events that display the higher X-ray column densities (Campana et al. 2011), indication of a metal-rich environment where the absorption is more efficient. In that case, the NH/AV ratio might be significantly lower for these events, which for a fixed value of NH translates into a higher value of AV. Therefore, the attenuation of the X-ray emission for dark bursts can be significantly lower with respect to the absorption in their optical band.
4 CONCLUSIONS
We studied the properties of the subclass of optically dark bursts detected in the complete sample of bright Swift long GRBs presented in Salvaterra et al. (2011) and Nava et al. (2011). From our analysis, we find that this population has the same redshift distribution as the whole sample. Thanks to the high completeness in redshift of this sample, we have been able to confirm the existence of a genuine fraction (∼25–35 per cent) of optically dark events. The majority of those do not show any darkness evolution, being optically dark from very early time. Those events cannot be explained in the context of the high-z scenario and we confidently exclude that their darkness is due to the Lyα absorption in the optical bands.
The dark bursts do not have different prompt properties compared to the normal events (see Table 3 and Fig. 4). However, the former display lower optical flux and relatively higher X-ray flux with respect to the latter, as also noted by van der Horst et al. (2009). In particular, they are always located in the high tail of the X-ray luminosity distribution, showing that they are, at the same time, not only fainter in the optical, but also brighter in the X-ray. Because we are dealing with bright prompt events, it is unlikely that the darkness of the events in our sample could be ascribed only to their intrinsic faintness or to rapid temporal decay. These bursts are indeed faint events in the optical band but they also have a slight excess of emission in the X-ray band (although the excess is not statistically significant as the optical deficiency). The higher X-ray column densities observed for the dark bursts in our sample (Campana et al. 2011) clearly indicate that they formed in metal-rich environments where a fair amount of dust must be present. This disfavour the low-density scenario.
Therefore, the most plausible explanation is left to be found in the context of the dust scenario. Since we take into account the Galactic absorption, if this scenario is correct then the observed darkness is due to high local extinction in a dense environment or absorption from intervening material. Unfortunately, we do not have complete information regarding all the possible intervening systems that the light of these events may encounter along their lines of sight and probably this effect becomes relevant only for GRBs at high redshift (Campana et al. 2006, 2010). Therefore, it can play a significant role only for a small fraction of dark bursts in our sample. The former possibility instead plays for sure an important role for a couple of events in our sample: GRB 060210 (AV≥ 4; Curran et al. 2007) and GRB 080607 (AV≥ 3.5; Perley et al. 2009).
High values of X-ray column densities are hint of high local absorption; however, we do not know what happens to the dust environment in the vicinity of the GRB. Their prompt emission could, for example, alter the local dust composition, destroying small dust grains in favour of the bigger ones. This may change the extinction law that will become flatter, nearly constant and independent of the observed wavelength, in the ultraviolet–optical band, with respect to that commonly observed in the local Universe. This effect, known as grey dust, even though not easy to recognize, was successfully invoked to explain a few GRB spectral energy distributions (Stratta et al. 2005). We do not have clear hints of this scenario in our subsample of dark bursts but we cannot exclude that it plays a significant role. However, the investigation of the ‘dust scenario’ and the ‘grey dust scenario’ needs a more detailed analysis of the spectral energy distribution of each single event in our sample; this is beyond the aim of this work and will be exhaustively treated in a dedicated forthcoming work.
On the basis of our results, we were able to understand more about the nature of dark bursts when compared to bright events:
they have similar prompt properties;
they have a higher X-ray flux and X-ray luminosity and, at the same time, lower optical flux;
they are located in different (denser) environments;
they cannot be explained in the context of the high-z or low-density scenarios;
their darkness must be mainly related to circumburst dust absorption.
Footnotes
In particular, we required that (i) the burst has been well localized by Swift-XRT and its coordinates quickly distributed, (ii) the Galactic extinction in the burst direction is low, AV < 0.5, (iii) the GRB declination is −70° < δ < 70°, (iv) the Sun-to-field distance is θSun > 55° and (v) no nearby bright star is present.
We take into account all the effects due to X-ray absorption, even if at this energy they are negligible, and so fX is the de-absorbed flux.
One further event (GRB 060306) falls into the βOX < βX− 0.5 region. However, there are large uncertainties in the extrapolation at tobs of the optical flux and we decided not to include this event in the list of secure dark bursts. We note that there also some indication from K-band observations (Lamb et al. 2006) in favour of the dark nature of this object; therefore, we include this event when we estimate the maximum fraction of dark bursts for the van der Horst et al. (2009) definition.
We compared the prompt properties of dark and bright events in our sample using the values computed by Nava et al. (2011).
We thank the referee for providing constructive and well-directed comments. This work has been supported by ASI grant I/011/07/0. This work made use of data supplied by the UK Swift Science Data Centre at the University of Leicester.
REFERENCES
