


Abstract
We present a detailed analysis of the neutral hydrogen kinematics of 12 nearby dwarf irregular galaxies observed as part of the Local Volume H i Survey conducted at the Australia Telescope Compact Array. For each galaxy we measure the disc parameters (inclination, position angle) and the H i rotation curve. Six galaxies in our sample (AM 0605−341, Argo Dwarf, ESO 059−G001, ESO 137−G018, ESO 174−G?001 and ESO 308−G022) have their atomic hydrogen distribution studied for the first time. AM 0605−341 was found to have an extension of redshifted H i which we propose is due to a tidal interaction with NGC 2188. There is evidence that ESO 215−G?009 has extraplanar H i gas. We also compare the global galaxy properties, in particular the integrated H i flux density and velocity widths of the observed H i spectra, with the results from the low angular resolution H i Parkes All Sky Survey. We discuss under what circumstances the 21 cm emission-line profile can accurately predict the galaxies rotation velocity, an observational parameter crucial to study the classical and baryonic Tully–Fisher relations.
1 Introduction
The kinematics of the gas and stars in galaxies is often very complex, reflecting both internal and external processes such as turbulence, infall/outflow, rotation, tidal interactions and ram pressure stripping. The rotational component, which dominates in most spiral galaxies, provides a direct measure of the gravitational potential. In contrast, small dwarf galaxies often show similar rotational and non-rotational amplitudes (e.g. Begum & Chengalur 2003) that sometimes are consequence of interactions (López-Sánchez 2010).
The rotation curve, i.e. the rotational velocity as a function of galaxy radius, gives an accurate estimate of the total galaxy mass out to the largest measured radial extent. When deriving a galaxy’s rotation curve from the data, projection effects as well as the shape and orientation of the disc/orbits must be taken into account. In particular, the majority of spiral galaxies display mild or strong bars in the inner region and warps in the outer regions and these effects can make the derivation of an accurate rotation curve problematic.
Rotation curves have long been used as a tool to study the bulk motion of the H i disc. Following several early studies of 21-cm (H i) rotation curves, e.g. by Rogstad & Shostak (1972) and Roberts & Rots (1973), Bosma (1981) carried out the first comprehensive analysis of relatively high-resolution H i rotation curves of 35 galaxies with a range of morphological types. Begeman (1989) described a new method, the tilted-ring analysis, to derive rotation curves and demonstrated it for the extended H i disc of the spiral galaxy NGC 3198. This method is still the most commonly used for modelling mildly inclined galaxy discs.
The Local Volume (LV; D < 10 Mpc) is the ideal place to study the kinematics of galaxies. More than 550 galaxies are currently known to reside in this volume (Karachentsev et al. 2008), approximately 85 per cent of which are dwarf galaxies (Karachentsev et al. 2004). Because of their proximity, independent distances are available for most LV galaxies, and they can be studied with high spatial resolution.
A large range of H i rotation curve studies already exist and more are underway. While we are working towards a large set of excellent galaxy rotation curves, each individual galaxy requires suitable data and a lot of time to accurately model their kinematics and mass distribution. Dwarf galaxies are particularly difficult to model, because of their small size, low rotation velocity, non-rotational motions such as turbulence, infall/outflow, etc. as well as large neighbours. Côté, Carignan & Freeman (2000) presented rotation curves for eight dwarfs irregular galaxies located in the nearby Sculptor and Centaurus A groups, several of which are also discussed in this paper (see also van Eymeren et al. 2009). Swaters et al. (2009) just published the H i rotation curves of 62 late-type dwarf galaxies based on data from the Westerbork Observations of Neutral Hydrogen in Irregular and Spiral Galaxies (WHISP) project (see Swaters et al. 2002) while Verheijen & Sancisi (2001) derived rotation curves for 43 spiral galaxies in the nearby Ursa Major cluster. Several high-resolution, high-sensitivity H i surveys of nearby galaxies are currently underway which together will provide a comprehensive picture of the local galaxy dynamics and mass distribution. These are (1) ‘The H i Nearby Galaxy Survey’ (THINGS; Walter et al. 2008) which provides a detailed analysis of the rotation curves of 19 nearby galaxies (de Blok et al. 2008; Oh et al. 2008), (2) Little THINGS (Hunter et al. 2007) which is obtaining deep H i-line maps of dwarf galaxies, (3) the ‘Faint Irregular GMRT Galaxies Survey’ (FIGGS; Begum et al. 2008a) which provides detailed H i velocity fields (Begum et al. 2006) and rotational velocities (Begum et al. 2008b) for a large number of dwarf galaxies, (4) Very Large Array (VLA)-ACS Nearby Galaxy Survey Treasury (ANGST; Ott et al. 2010) which is obtaining high-resolution (∼6) H i maps of 36 nearby galaxies and (5) Westerbork Synthesis Radio Telescopes-Local Volume H i Survey (WRST-LVHIS) which a new Northern hemisphere extension to the LVHIS survey. Most of the THINGS targets are well-resolved, large spiral galaxies, while the FIGGS targets are faint dwarf irregular galaxies observed with very high velocity and angular resolution. The LVHIS (Koribalski et al., in preparation) will initially provide medium resolution (∼45 arcsec) H i data for a complete sample of ∼70 southern galaxies (see Section 2) aimed at studying their large-scale gas distribution and kinematics. High-resolution (10 arcsec) data will be published after further data processing.
This paper is organized as follows. In Section 2 we describe the 12 nearby galaxies that were selected for the rotation curve analysis, followed by a brief outline of the radio observations and data reduction in Section 3. In Section 4 we discuss the galaxy properties as measured and derived from interferometric and single dish H i data. Rotation curves, v(r), and disc orientation parameters are presented for each galaxy in Section 5. In Section 6 we compare the rotation curve and spectral properties of our sample galaxies. The kinematics of individual galaxies is presented in Section 7 and the Tully–Fisher relation discussed in Section 8. Finally, the results are summarized in Section 9.
2 The Galaxy Sample
The LVHIS1 (Koribalski 2008; Koribalski et al., in preparation) is a large project which aims to provide H i distributions, H i velocity fields and 20 cm radio continuum maps for all galaxies within 10 Mpc. For observations with the Australia Telescope Compact Array (ATCA) we initially chose only those LV galaxies that are detected in the H i Parkes All-Sky Survey (HIPASS; Barnes et al. 2001; Koribalski et al. 2004) and reside south of approximately −30° declination. For a brief overview of the LVHIS observations and data reduction see Section 3.
While we would like to derive rotation curves and mass models for all ∼70 LVHIS galaxies observed with the ATCA, the typical angular resolution of the H i maps used here allows us to study only those galaxies with H i diameters larger than ∼5 arcmin. Furthermore, a number of large, nearby galaxies have already been extensively studied and good rotation curves are available in the literature (see e.g. Circinus: Jones et al. 1999; ESO 215−G?009: Warren, Jerjen & Koribalski 2004; ESO 245−G005, ESO 381−G020, ESO 325−G011, ESO 444−G084 and UGC 442: Côté et al. 2000; M83: Tilanus & Allen 1993; NGC 247: Carignan & Puche 1990b; NGC 253: Puche, Carignan & van Gorkom 1991; NGC 300: Puche, Carignan & Bosma 1990; Westmeier, Braun & Koribalski 2011; NGC 625: Cannon et al. 2004; NGC 1313: Ryder et al. 1995; NGC 1512: Koribalski & López-Sánchez 2009; NGC 1705: Meurer, Staveley-Smith & Killeen 1998; NGC 2188: Domgoergen, Dahlem & Dettmar 1996; NGC 2915: Bureau et al. 1999; NGC 4945: Ott et al. 2001; NGC 5102: van Woerden et al. 1993; NGC 5128: Schiminovich et al. 1994; NGC 5253: Kobulnicky & Skillman 1995; NGC 6822: Weldrake, de Blok & Walter 2003; NGC 7793: Carignan & Puche 1990a). A tilted-ring analysis is most appropriate for galaxies with inclination angles of i= 30°–80°. Edge-on galaxies (i > 80°) require a different method (the envelope tracing method of Sofue 1996, 1997) to derive robust rotation curves as the observed line-of-sight crosses a large range of projected velocities. For nearly face-on galaxies, non-rotational and rotational motions in the line-of-sight can be of similar amplitude, leading to large uncertainties in the derived rotation curve (Lewis 1975; Meyer et al. 2008). Following de Blok et al. (2008) we chose a lower limit of i= 30°. Using the above criteria, we select 12 LVHIS galaxies for our kinematical study.
In Fig. 1 we show deep (24 < μlim < 26 mag arcsec−2) near-IR, H-band images, if available from Kirby et al. (2008), or B-band (optical) images of the selected galaxies. We prefer near-IR over optical images to reveal the full extent and shape of the stellar disc because (a) dust attenuation is minimal and (b) the observed light emission is not dominated by that of short-lived giant O and B stars. Deep H-band (1.65 μm) images are, unfortunately, not yet available for AM 0605−341, ESO 174−G?001, ESO 215−G?009, ESO 325−G?011 and ESO 381−G020, so B-band (468 nm) Digitised Sky Survey (DSS) images are displayed instead. Based on their stellar distribution we find that all 12 sample galaxies are dwarf irregular galaxies, some are of magellanic type and some have central bars.
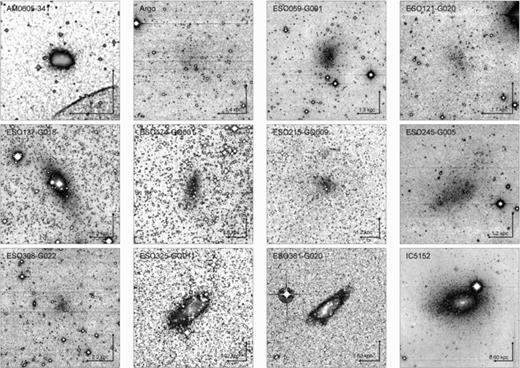
Near-IR H-band images (Kirby et al. 2008) for seven sample galaxies. For another five galaxies (AM 0605−341, ESO 174−G?001, ESO 215−G?009, ESO 325−G?011 and ESO 381−G020) no H-band images are currently available. Instead we show their B-band (468 nm) images from the DSS. The displayed scaling bar equals 1 arcmin; the corresponding linear scale is also indicated. North is up and east is to the left. The H- and B-band intensity is represented by a grey-scale, which goes from white (low intensity) to black (medium intensity) and then back to white (high intensity).
The basic optical properties of the sample galaxies are given in Table 1. The columns are organized as follows.
Optical properties.
| Galaxy (1) | RA (J2000) (2) | Dec. (J2000) (3) | Distance (Mpc) (4) | Method (5) | PA (°) (6) | Incl. (°) (7) | mB (mag) (8) | mH (mag) (9) | E(B−V) (mag) (10) | MB (mag) (11) |
| AM 0605−341 |  | −34°12′04″ | 7.2 | H | 85d | 65d | 14.3f | – | 0.036 | −15.1 |
| AM 0704−582 |  | −58°31′28″ | 4.90 | TRGBb | 45c | 60c | 14.4i | 12.72 ± 0.08 | 0.119 | −14.6 |
| ESO 059−G001 |  | −68°11′29″ | 4.57 | TRGBa | 160c | 41c | 13.7g | 11.28 ± 0.06 | 0.147 | −15.2 |
| ESO 121−G020 |  | −57°43′50″ | 6.05 | TRGBa | 45c | 45c | 15.9g | 13.87 ± 0.09 | 0.040 | −13.2 |
| ESO 137−G018 |  | −60°29′14″ | 6.40 | TRGBh | 30e | 55e | 12.2g | –k | 0.243 | −17.9 |
| ESO 174−G?001 |  | −53°20′51″ | 6.0 | H | 165d | 60d | 14.4f | – | 0.494 | −16.6 |
| ESO 215−G?009 |  | −48°10′40″ | 5.25 | TRGBh | 40j | 30j | 16.0g | – | 0.221 | −13.4 |
| ESO 245−G005 |  | −43°35′47″ | 4.43 | TRGBb | 127c | 52c | 12.8g | 11.10 ± 0.10 | 0.016 | −15.6 |
| ESO 308−G022 |  | −40°43′13″ | 7.6 | H | 130c | 37c | 16.2g | 13.40 ± 0.10 | 0.089 | −13.6 |
| ESO 325−G?011 |  | −41°51′32″ | 3.40 | TRGBb | 130d | 60d | 14.0g | – | 0.087 | −14.0 |
| ESO 381−G020 |  | −33°50′17″ | 5.44 | TRGBh | 130d | 40d | 14.2g | – | 0.065 | −14.7 |
| IC 5152 |  | −51°17′53″ | 2.07 | TRGBb | 95c | 50c | 11.1g | 8.26 ± 0.03 | 0.025 | −15.6 |
| Galaxy (1) | RA (J2000) (2) | Dec. (J2000) (3) | Distance (Mpc) (4) | Method (5) | PA (°) (6) | Incl. (°) (7) | mB (mag) (8) | mH (mag) (9) | E(B−V) (mag) (10) | MB (mag) (11) |
| AM 0605−341 | | −34°12′04″ | 7.2 | H | 85d | 65d | 14.3f | – | 0.036 | −15.1 |
| AM 0704−582 | | −58°31′28″ | 4.90 | TRGBb | 45c | 60c | 14.4i | 12.72 ± 0.08 | 0.119 | −14.6 |
| ESO 059−G001 | | −68°11′29″ | 4.57 | TRGBa | 160c | 41c | 13.7g | 11.28 ± 0.06 | 0.147 | −15.2 |
| ESO 121−G020 | | −57°43′50″ | 6.05 | TRGBa | 45c | 45c | 15.9g | 13.87 ± 0.09 | 0.040 | −13.2 |
| ESO 137−G018 | | −60°29′14″ | 6.40 | TRGBh | 30e | 55e | 12.2g | –k | 0.243 | −17.9 |
| ESO 174−G?001 | | −53°20′51″ | 6.0 | H | 165d | 60d | 14.4f | – | 0.494 | −16.6 |
| ESO 215−G?009 | | −48°10′40″ | 5.25 | TRGBh | 40j | 30j | 16.0g | – | 0.221 | −13.4 |
| ESO 245−G005 | | −43°35′47″ | 4.43 | TRGBb | 127c | 52c | 12.8g | 11.10 ± 0.10 | 0.016 | −15.6 |
| ESO 308−G022 | | −40°43′13″ | 7.6 | H | 130c | 37c | 16.2g | 13.40 ± 0.10 | 0.089 | −13.6 |
| ESO 325−G?011 | | −41°51′32″ | 3.40 | TRGBb | 130d | 60d | 14.0g | – | 0.087 | −14.0 |
| ESO 381−G020 | | −33°50′17″ | 5.44 | TRGBh | 130d | 40d | 14.2g | – | 0.065 | −14.7 |
| IC 5152 | | −51°17′53″ | 2.07 | TRGBb | 95c | 50c | 11.1g | 8.26 ± 0.03 | 0.025 | −15.6 |
aKarachentsev et al. (2006); bKarachentsev et al. (2004); cKirby et al. (2008); dmeasured independently using DSS image; emeasured independently using a previously unpublished Local Sphere of Influence Survey (Kirby et al. 2008) image; fDoyle et al. (2005); gESO-LV catalogue (Lauberts & Valentijn 1989); hKarachentsev et al. (2007); iParodi, Barazza & Binggeli (2002); jmeasured independently using Warren et al. (2004) image; knot measured due to foreground contamination.
Optical properties.
| Galaxy (1) | RA (J2000) (2) | Dec. (J2000) (3) | Distance (Mpc) (4) | Method (5) | PA (°) (6) | Incl. (°) (7) | mB (mag) (8) | mH (mag) (9) | E(B−V) (mag) (10) | MB (mag) (11) |
| AM 0605−341 | | −34°12′04″ | 7.2 | H | 85d | 65d | 14.3f | – | 0.036 | −15.1 |
| AM 0704−582 | | −58°31′28″ | 4.90 | TRGBb | 45c | 60c | 14.4i | 12.72 ± 0.08 | 0.119 | −14.6 |
| ESO 059−G001 | | −68°11′29″ | 4.57 | TRGBa | 160c | 41c | 13.7g | 11.28 ± 0.06 | 0.147 | −15.2 |
| ESO 121−G020 | | −57°43′50″ | 6.05 | TRGBa | 45c | 45c | 15.9g | 13.87 ± 0.09 | 0.040 | −13.2 |
| ESO 137−G018 | | −60°29′14″ | 6.40 | TRGBh | 30e | 55e | 12.2g | –k | 0.243 | −17.9 |
| ESO 174−G?001 | | −53°20′51″ | 6.0 | H | 165d | 60d | 14.4f | – | 0.494 | −16.6 |
| ESO 215−G?009 | | −48°10′40″ | 5.25 | TRGBh | 40j | 30j | 16.0g | – | 0.221 | −13.4 |
| ESO 245−G005 | | −43°35′47″ | 4.43 | TRGBb | 127c | 52c | 12.8g | 11.10 ± 0.10 | 0.016 | −15.6 |
| ESO 308−G022 | | −40°43′13″ | 7.6 | H | 130c | 37c | 16.2g | 13.40 ± 0.10 | 0.089 | −13.6 |
| ESO 325−G?011 | | −41°51′32″ | 3.40 | TRGBb | 130d | 60d | 14.0g | – | 0.087 | −14.0 |
| ESO 381−G020 | | −33°50′17″ | 5.44 | TRGBh | 130d | 40d | 14.2g | – | 0.065 | −14.7 |
| IC 5152 | | −51°17′53″ | 2.07 | TRGBb | 95c | 50c | 11.1g | 8.26 ± 0.03 | 0.025 | −15.6 |
aKarachentsev et al. (2006); bKarachentsev et al. (2004); cKirby et al. (2008); dmeasured independently using DSS image; emeasured independently using a previously unpublished Local Sphere of Influence Survey (Kirby et al. 2008) image; fDoyle et al. (2005); gESO-LV catalogue (Lauberts & Valentijn 1989); hKarachentsev et al. (2007); iParodi, Barazza & Binggeli (2002); jmeasured independently using Warren et al. (2004) image; knot measured due to foreground contamination.
Column (1) – galaxy name.
Columns (2) and (3) – equatorial coordinates of the centre of the optical emission for the epoch of J2000, obtained from the ESO-LV catalogue (Lauberts & Valentijn 1989) and the Arp & Madore (1987) catalogue.
Columns (4) and (5) – distance to the galaxy and an indication of the method used: tip of the red giant branch (TRGB) or Hubble flow distance (H), D=vLG/H0, where vLG is the Local Group velocity calculated using the HIPASS derived heliocentric velocity (see Table 2) and coordinate transformation of Karachentsev & Makarov (1996). Here, H0= 73 km s−1 Mpc−1 is adopted [Wilkinson Microwave Anisotropy Probe (WMAP); Spergel et al. 2007]. An uncertainty of 10 per cent is adopted (Karachentsev et al. 2006).
Columns (6) and (7) – the position angle and inclination of the outer isophotes in degrees. For the galaxies with H-band images available, the surface brightness at which these values were measured is typically 26 mag arcsec−2. When DSS images were used, the surface brightness is higher. The position angle is listed taken in the anticlockwise direction, between the north direction on the sky and the major axis. It is important to note that these parameters are defined by the optical morphology and may not be equivalent to the position angle and inclination defined kinematically.
Column (8) – the total B-band magnitude and its source. An uncertainty of 0.2 mag is adopted.
Column (9) – the total H-band magnitude obtained from Kirby et al. (2008).
Column (10) – reddening estimate, E(B−V), which has an uncertainty of 16 per cent (Schlegel, Finkbeiner & Davis 1998).
Column (11) – the absolute B-band magnitude calculated as MB=mB− 5log D− 25 −AB, where AB= 4.32 E(B−V) (Schlegel et al. 1998).
Radio properties from HIPASS.
| Galaxy (1) | HIPASS ID. (2) |  (Jy km s−1) (3) (Jy km s−1) (3) | vhel (km s−1) (4) | w50 (km s−1) (5) | w20 (km s−1) (6) | Ref.b (7) |  (108 M⊙) (8) (108 M⊙) (8) |  (M⊙/L⊙, B) (9) (M⊙/L⊙, B) (9) |
| AM 0605−341 | HIPASS J0607−34 | 9.0 ± 1.4 | 765 ± 6 | 123 ± 12 | 168 ± 18 | 1 | 1.1 ± 0.2 | 0.6 ± 0.1 |
| AM 0704−582 | HIPASS J0705−58 | 34.8 ± 4.4 | 564 ± 2 | 68 ± 4 | 84 ± 6 | 2 | 2.0 ± 0.4 | 1.9 ± 0.4 |
| ESO 059−G001 | HIPASS J0731−68 | 17.7 ± 2.5 | 530 ± 3 | 82 ± 6 | 104 ± 9 | 2 | 0.9 ± 0.2 | 0.5 ± 0.1 |
| ESO 121−G020a | HIPASS J0615−57 | 14.1 ± 2.9 | 577 ± 5 | 65 ± 10 | 96 ± 15 | 2 | 1.2 ± 0.3 | 4.1 ± 1.0 |
| ESO 137−G018 | HIPASS J1620−60 | 37.4 ± 4.9 | 605 ± 3 | 139 ± 6 | 155 ± 9 | 2 | 3.6 ± 0.7 | 0.16 ± 0.03 |
| ESO 174−G?001 | HIPASS J1348−53 | 55.1 ± 5.9 | 688 ± 3 | 71 ± 6 | 103 ± 9 | 2 | 4.7 ± 0.8 | 0.7 ± 0.1 |
| ESO 215−G?009 | HIPASS J1057−48 | 104.4 ± 11.5 | 598 ± 2 | 67 ± 4 | 83 ± 6 | 2 | 6.8 ± 1.2 | 16.8 ± 3.0 |
| ESO 245−G005 | HIPASS J0145−43 | 81.0 ± 9.1 | 391 ± 2 | 60 ± 4 | 85 ± 6 | 2 | 3.9 ± 0.7 | 1.5 ± 0.3 |
| ESO 308−G022 | HIPASS J0639−40 | 3.8 ± 1.0 | 822 ± 5 | 52 ± 10 | 74 ± 15 | 1 | 0.5 ± 0.2 | 1.2 ± 0.4 |
| ESO 325−G?011 | HIPASS J1345−41 | 26.6 ± 3.7 | 545 ± 2 | 59 ± 4 | 75 ± 6 | 2 | 0.7 ± 0.1 | 1.1 ± 0.2 |
| ESO 381−G020 | HIPASS J1246−33 | 30.9 ± 3.7 | 589 ± 2 | 83 ± 4 | 100 ± 6 | 2 | 2.2 ± 0.4 | 1.8 ± 0.3 |
| IC 5152 | HIPASS J2202−51 | 97.2 ± 9.5 | 122 ± 2 | 84 ± 4 | 100 ± 6 | 2 | 1.0 ± 0.2 | 0.4 ± 0.1 |
| Galaxy (1) | HIPASS ID. (2) | (Jy km s−1) (3) | vhel (km s−1) (4) | w50 (km s−1) (5) | w20 (km s−1) (6) | Ref.b (7) | (108 M⊙) (8) | (M⊙/L⊙, B) (9) |
| AM 0605−341 | HIPASS J0607−34 | 9.0 ± 1.4 | 765 ± 6 | 123 ± 12 | 168 ± 18 | 1 | 1.1 ± 0.2 | 0.6 ± 0.1 |
| AM 0704−582 | HIPASS J0705−58 | 34.8 ± 4.4 | 564 ± 2 | 68 ± 4 | 84 ± 6 | 2 | 2.0 ± 0.4 | 1.9 ± 0.4 |
| ESO 059−G001 | HIPASS J0731−68 | 17.7 ± 2.5 | 530 ± 3 | 82 ± 6 | 104 ± 9 | 2 | 0.9 ± 0.2 | 0.5 ± 0.1 |
| ESO 121−G020a | HIPASS J0615−57 | 14.1 ± 2.9 | 577 ± 5 | 65 ± 10 | 96 ± 15 | 2 | 1.2 ± 0.3 | 4.1 ± 1.0 |
| ESO 137−G018 | HIPASS J1620−60 | 37.4 ± 4.9 | 605 ± 3 | 139 ± 6 | 155 ± 9 | 2 | 3.6 ± 0.7 | 0.16 ± 0.03 |
| ESO 174−G?001 | HIPASS J1348−53 | 55.1 ± 5.9 | 688 ± 3 | 71 ± 6 | 103 ± 9 | 2 | 4.7 ± 0.8 | 0.7 ± 0.1 |
| ESO 215−G?009 | HIPASS J1057−48 | 104.4 ± 11.5 | 598 ± 2 | 67 ± 4 | 83 ± 6 | 2 | 6.8 ± 1.2 | 16.8 ± 3.0 |
| ESO 245−G005 | HIPASS J0145−43 | 81.0 ± 9.1 | 391 ± 2 | 60 ± 4 | 85 ± 6 | 2 | 3.9 ± 0.7 | 1.5 ± 0.3 |
| ESO 308−G022 | HIPASS J0639−40 | 3.8 ± 1.0 | 822 ± 5 | 52 ± 10 | 74 ± 15 | 1 | 0.5 ± 0.2 | 1.2 ± 0.4 |
| ESO 325−G?011 | HIPASS J1345−41 | 26.6 ± 3.7 | 545 ± 2 | 59 ± 4 | 75 ± 6 | 2 | 0.7 ± 0.1 | 1.1 ± 0.2 |
| ESO 381−G020 | HIPASS J1246−33 | 30.9 ± 3.7 | 589 ± 2 | 83 ± 4 | 100 ± 6 | 2 | 2.2 ± 0.4 | 1.8 ± 0.3 |
| IC 5152 | HIPASS J2202−51 | 97.2 ± 9.5 | 122 ± 2 | 84 ± 4 | 100 ± 6 | 2 | 1.0 ± 0.2 | 0.4 ± 0.1 |
aWarren, Jerjen & Koribalski (2006) identified a nearby companion, ATCA J061608−574552, which is not resolved from ESO 121−G020 by HIPASS.
Radio properties from HIPASS.
| Galaxy (1) | HIPASS ID. (2) | (Jy km s−1) (3) | vhel (km s−1) (4) | w50 (km s−1) (5) | w20 (km s−1) (6) | Ref.b (7) | (108 M⊙) (8) | (M⊙/L⊙, B) (9) |
| AM 0605−341 | HIPASS J0607−34 | 9.0 ± 1.4 | 765 ± 6 | 123 ± 12 | 168 ± 18 | 1 | 1.1 ± 0.2 | 0.6 ± 0.1 |
| AM 0704−582 | HIPASS J0705−58 | 34.8 ± 4.4 | 564 ± 2 | 68 ± 4 | 84 ± 6 | 2 | 2.0 ± 0.4 | 1.9 ± 0.4 |
| ESO 059−G001 | HIPASS J0731−68 | 17.7 ± 2.5 | 530 ± 3 | 82 ± 6 | 104 ± 9 | 2 | 0.9 ± 0.2 | 0.5 ± 0.1 |
| ESO 121−G020a | HIPASS J0615−57 | 14.1 ± 2.9 | 577 ± 5 | 65 ± 10 | 96 ± 15 | 2 | 1.2 ± 0.3 | 4.1 ± 1.0 |
| ESO 137−G018 | HIPASS J1620−60 | 37.4 ± 4.9 | 605 ± 3 | 139 ± 6 | 155 ± 9 | 2 | 3.6 ± 0.7 | 0.16 ± 0.03 |
| ESO 174−G?001 | HIPASS J1348−53 | 55.1 ± 5.9 | 688 ± 3 | 71 ± 6 | 103 ± 9 | 2 | 4.7 ± 0.8 | 0.7 ± 0.1 |
| ESO 215−G?009 | HIPASS J1057−48 | 104.4 ± 11.5 | 598 ± 2 | 67 ± 4 | 83 ± 6 | 2 | 6.8 ± 1.2 | 16.8 ± 3.0 |
| ESO 245−G005 | HIPASS J0145−43 | 81.0 ± 9.1 | 391 ± 2 | 60 ± 4 | 85 ± 6 | 2 | 3.9 ± 0.7 | 1.5 ± 0.3 |
| ESO 308−G022 | HIPASS J0639−40 | 3.8 ± 1.0 | 822 ± 5 | 52 ± 10 | 74 ± 15 | 1 | 0.5 ± 0.2 | 1.2 ± 0.4 |
| ESO 325−G?011 | HIPASS J1345−41 | 26.6 ± 3.7 | 545 ± 2 | 59 ± 4 | 75 ± 6 | 2 | 0.7 ± 0.1 | 1.1 ± 0.2 |
| ESO 381−G020 | HIPASS J1246−33 | 30.9 ± 3.7 | 589 ± 2 | 83 ± 4 | 100 ± 6 | 2 | 2.2 ± 0.4 | 1.8 ± 0.3 |
| IC 5152 | HIPASS J2202−51 | 97.2 ± 9.5 | 122 ± 2 | 84 ± 4 | 100 ± 6 | 2 | 1.0 ± 0.2 | 0.4 ± 0.1 |
aWarren, Jerjen & Koribalski (2006) identified a nearby companion, ATCA J061608−574552, which is not resolved from ESO 121−G020 by HIPASS.
The basic H i properties of our sample were established by HIPASS (Koribalski et al. 2004; Meyer et al. 2004). In Table 2 we list the following columns.
Column (1) – galaxy name.
Column (2) – HIPASS name.
Column (3) – integrated (spatially and spectrally) H i flux density,
 , and its uncertainty in Jy km s−1.
Column (4) – H i heliocentric velocity, vhel, measured at the midpoint of the 50 per cent level of peak flux (Koribalski et al. 2004).
Column (5) and (6) – the H i velocity line widths, w50 and w20, measured at the 50 and 20 per cent level, respectively.
Column (7) – reference used.
Column (8) – the H i mass in solar units calculated as
 (Roberts 1975; Roberts & Haynes 1994), with D in Mpc and
  in Jy km s−1.
Column (9) – the H i mass-to-light ratio,
 , in solar units. Here
  , where MB, ⊙ is the absolute solar B magnitude taken as 5.48 (Bessell, Castelli & Plez 1998) and AB= 4.32 E(B−V) (Schlegel et al. 1998). The mass-to-light ratio is independent of the galaxy’s distance.
3 Observations and Data Reduction
A detailed description of the LVHIS project, including observations, data reduction and analysis as well as first results is the subject of an upcoming paper (Koribalski et al., in preparation).
The H i line observations analysed in this paper were obtained with the ATCA as part of the LVHIS project. The data was taken between 2005 January and 2009 January using three arrays, EW352/EW367 m, 750 m and 1.5 km (∼12 h each), to ensure excellent uv coverage and sensitivity to large-scale structure. Each sample galaxy was observed for a full synthesis (12 h) in each of the three arrays, unless equivalent archival observations were available. In addition, all other available archival data were used where available, including the ATCA observations in the 6-km array for ESO 215−G?009 (no 1.5 km were taken for this galaxy).
The first frequency band was centred on 1418 MHz with a bandwidth of 8 MHz, divided into 512 channels. This gives a channel width of 3.3 km s−1 and a velocity resolution of 4 km s−1. The ATCA primary beam is 33.6 arcmin at 1418 MHz.
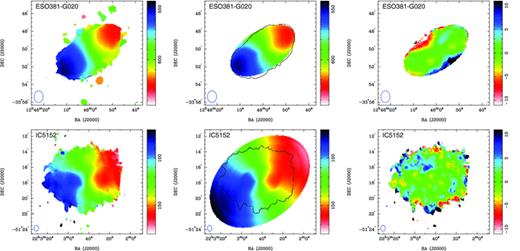
Data reduction was carried out with the Multichannel Image Reconstruction, Image Analysis and Display (miriad; Sault, Teuben & Wright 1995) software package using standard procedures. Here we use the H i moment maps made using ‘natural’ weighting of the uv data in the velocity range covered by the H i emission using steps of 4 km s−1. To obtain low-resolution maps we excluded the longest baselines, to the distant sixth antenna. The average synthesized beam size is 45 arcsec. The integrated H i intensity distribution is shown in Fig. 2 for each galaxy.
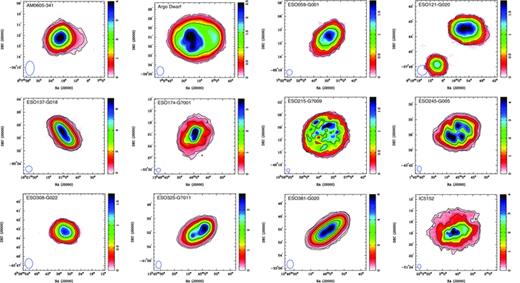
The integrated H i intensity distribution with contour levels at 0.1 (∼0.3σ), 0.2, 0.5, 1, 2, 3 and 4 Jy beam−1 km s−1. The synthesized beam is displayed in the bottom left-hand corner of each panel. The image of ESO 121−G020 also shows its dwarf companion, ATCA J061608−574552, which was identified by Warren et al. (2006). Note that the intensity scale is adjusted for each galaxy.
4 Galaxy Spectra
The H i line spectra for the selected LVHIS data were obtained using the mbspect task in miriad. For each galaxy, the spectrum was integrated over the coordinates with detected H i emission (defined by the region of emission in the first moment map) for the entire range of observed velocities. In Fig. 3, the LVHIS spectrum for each sample galaxy is provided (solid line) with its HIPASS spectrum for comparison (dotted line).
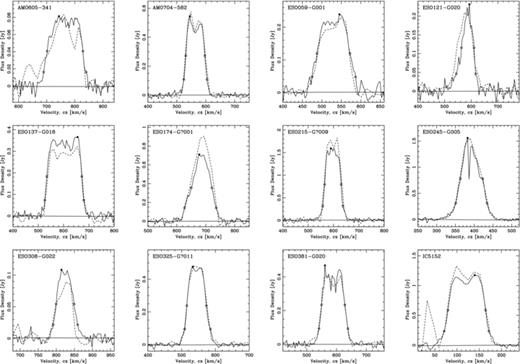
The global H i line spectra as obtained from LVHIS (solid line) and HIPASS (dashed line). The solid dot indicates the peak flux, and the open circles show the points used to measure the H i velocity line widths at the 50 and 20 per cent peak flux density levels. The zero baseline is shown for the LVHIS data only.
The HIPASS spectrum was extracted from the HIPASS data cubes. We derive the spectral parameters to ensure that an accurate comparison can be made between the HIPASS and the LVHIS data. For each galaxy the H i spectrum was integrated over the area and velocity range of the detected H i signal. A first-order polynomial was fitted to the line-free channels and subtracted. Table 3 lists the measured H i properties as well as the ratio of single dish (HIPASS) to interferometric  (LVHIS). Fig. 4 shows a comparison of HIPASS and LVHIS spectra of each of the 12 galaxies in our sample. A detailed description of each galaxy is given in Section 7.
Measured ATCA H i properties.
| Galaxy (1) | Speak (mJy beam−1) (2) |  (Jy km s−1) (3) (Jy km s−1) (3) | vhel (km s−1) (4) | w50 (km s−1) (5) | w20 (km s−1) (6) |  (108 M⊙) (7) (108 M⊙) (7) |  (8) (8) |
| AM 0605−341 | 81 ± 4 | 9.6 ± 0.7 | 765 ± 3 | 127 ± 4 | 151 ± 6 | 1.2 ± 0.2 | 1.1 ± 0.3 |
| AM 0704−582 | 545 ± 27 | 33.2 ± 1.5 | 564 ± 1 | 66 ± 1 | 80 ± 2 | 1.9 ± 0.3 | 1.0 ± 0.1 |
| ESO 059−G001 | 239 ± 12 | 19.6 ± 2.2 | 530 ± 3 | 85 ± 6 | 112 ± 9 | 1.0 ± 0.2 | 1.1 ± 0.2 |
| ESO 121−G020 | 231 ± 12 | 10.0 ± 1.2 | 587 ± 2 | 47 ± 4 | 73 ± 6 | 0.9 ± 0.2 | 0.7 ± 0.2 |
| ESO 137−G018 | 366 ± 18 | 47.8 ± 1.5 | 603 ± 1 | 138 ± 2 | 154 ± 2 | 4.6 ± 0.7 | 1.3 ± 0.2 |
| ESO 174−G?001 | 710 ± 36 | 48.8 ± 2.6 | 686 ± 1 | 71 ± 3 | 109 ± 4 | 4.1 ± 0.6 | 0.9 ± 0.1 |
| ESO 215−G?009 | 1591 ± 80 | 100.9 ± 3.1 | 598 ± 1 | 65 ± 1 | 79 ± 1 | 6.6 ± 0.9 | 1.0 ± 0.1 |
| ESO 245−G005 | 1561 ± 78 | 81.6 ± 2.6 | 393 ± 1 | 60 ± 1 | 83 ± 2 | 3.8 ± 0.5 | 1.0 ± 0.1 |
| ESO 308−G022 | 109 ± 6 | 5.3 ± 0.8 | 824 ± 2 | 50 ± 5 | 67 ± 7 | 0.7 ± 0.1 | 1.4 ± 0.4 |
| ESO 325−G?011 | 477 ± 24 | 27.1 ± 0.9 | 544 ± 1 | 58 ± 1 | 76 ± 2 | 0.7 ± 0.1 | 1.0 ± 0.1 |
| ESO 381−G020 | 468 ± 23 | 33.4 ± 1.7 | 589 ± 1 | 78 ± 2 | 97 ± 3 | 2.3 ± 0.4 | 1.1 ± 0.1 |
| IC 5152 | 1175 ± 59 | 96.4 ± 3.0 | 122 ± 1 | 85 ± 1 | 101 ± 2 | 1.0 ± 0.1 | 1.0 ± 0.1 |
| Galaxy (1) | Speak (mJy beam−1) (2) | (Jy km s−1) (3) | vhel (km s−1) (4) | w50 (km s−1) (5) | w20 (km s−1) (6) | (108 M⊙) (7) | (8) |
| AM 0605−341 | 81 ± 4 | 9.6 ± 0.7 | 765 ± 3 | 127 ± 4 | 151 ± 6 | 1.2 ± 0.2 | 1.1 ± 0.3 |
| AM 0704−582 | 545 ± 27 | 33.2 ± 1.5 | 564 ± 1 | 66 ± 1 | 80 ± 2 | 1.9 ± 0.3 | 1.0 ± 0.1 |
| ESO 059−G001 | 239 ± 12 | 19.6 ± 2.2 | 530 ± 3 | 85 ± 6 | 112 ± 9 | 1.0 ± 0.2 | 1.1 ± 0.2 |
| ESO 121−G020 | 231 ± 12 | 10.0 ± 1.2 | 587 ± 2 | 47 ± 4 | 73 ± 6 | 0.9 ± 0.2 | 0.7 ± 0.2 |
| ESO 137−G018 | 366 ± 18 | 47.8 ± 1.5 | 603 ± 1 | 138 ± 2 | 154 ± 2 | 4.6 ± 0.7 | 1.3 ± 0.2 |
| ESO 174−G?001 | 710 ± 36 | 48.8 ± 2.6 | 686 ± 1 | 71 ± 3 | 109 ± 4 | 4.1 ± 0.6 | 0.9 ± 0.1 |
| ESO 215−G?009 | 1591 ± 80 | 100.9 ± 3.1 | 598 ± 1 | 65 ± 1 | 79 ± 1 | 6.6 ± 0.9 | 1.0 ± 0.1 |
| ESO 245−G005 | 1561 ± 78 | 81.6 ± 2.6 | 393 ± 1 | 60 ± 1 | 83 ± 2 | 3.8 ± 0.5 | 1.0 ± 0.1 |
| ESO 308−G022 | 109 ± 6 | 5.3 ± 0.8 | 824 ± 2 | 50 ± 5 | 67 ± 7 | 0.7 ± 0.1 | 1.4 ± 0.4 |
| ESO 325−G?011 | 477 ± 24 | 27.1 ± 0.9 | 544 ± 1 | 58 ± 1 | 76 ± 2 | 0.7 ± 0.1 | 1.0 ± 0.1 |
| ESO 381−G020 | 468 ± 23 | 33.4 ± 1.7 | 589 ± 1 | 78 ± 2 | 97 ± 3 | 2.3 ± 0.4 | 1.1 ± 0.1 |
| IC 5152 | 1175 ± 59 | 96.4 ± 3.0 | 122 ± 1 | 85 ± 1 | 101 ± 2 | 1.0 ± 0.1 | 1.0 ± 0.1 |
Measured ATCA H i properties.
| Galaxy (1) | Speak (mJy beam−1) (2) | (Jy km s−1) (3) | vhel (km s−1) (4) | w50 (km s−1) (5) | w20 (km s−1) (6) | (108 M⊙) (7) | (8) |
| AM 0605−341 | 81 ± 4 | 9.6 ± 0.7 | 765 ± 3 | 127 ± 4 | 151 ± 6 | 1.2 ± 0.2 | 1.1 ± 0.3 |
| AM 0704−582 | 545 ± 27 | 33.2 ± 1.5 | 564 ± 1 | 66 ± 1 | 80 ± 2 | 1.9 ± 0.3 | 1.0 ± 0.1 |
| ESO 059−G001 | 239 ± 12 | 19.6 ± 2.2 | 530 ± 3 | 85 ± 6 | 112 ± 9 | 1.0 ± 0.2 | 1.1 ± 0.2 |
| ESO 121−G020 | 231 ± 12 | 10.0 ± 1.2 | 587 ± 2 | 47 ± 4 | 73 ± 6 | 0.9 ± 0.2 | 0.7 ± 0.2 |
| ESO 137−G018 | 366 ± 18 | 47.8 ± 1.5 | 603 ± 1 | 138 ± 2 | 154 ± 2 | 4.6 ± 0.7 | 1.3 ± 0.2 |
| ESO 174−G?001 | 710 ± 36 | 48.8 ± 2.6 | 686 ± 1 | 71 ± 3 | 109 ± 4 | 4.1 ± 0.6 | 0.9 ± 0.1 |
| ESO 215−G?009 | 1591 ± 80 | 100.9 ± 3.1 | 598 ± 1 | 65 ± 1 | 79 ± 1 | 6.6 ± 0.9 | 1.0 ± 0.1 |
| ESO 245−G005 | 1561 ± 78 | 81.6 ± 2.6 | 393 ± 1 | 60 ± 1 | 83 ± 2 | 3.8 ± 0.5 | 1.0 ± 0.1 |
| ESO 308−G022 | 109 ± 6 | 5.3 ± 0.8 | 824 ± 2 | 50 ± 5 | 67 ± 7 | 0.7 ± 0.1 | 1.4 ± 0.4 |
| ESO 325−G?011 | 477 ± 24 | 27.1 ± 0.9 | 544 ± 1 | 58 ± 1 | 76 ± 2 | 0.7 ± 0.1 | 1.0 ± 0.1 |
| ESO 381−G020 | 468 ± 23 | 33.4 ± 1.7 | 589 ± 1 | 78 ± 2 | 97 ± 3 | 2.3 ± 0.4 | 1.1 ± 0.1 |
| IC 5152 | 1175 ± 59 | 96.4 ± 3.0 | 122 ± 1 | 85 ± 1 | 101 ± 2 | 1.0 ± 0.1 | 1.0 ± 0.1 |
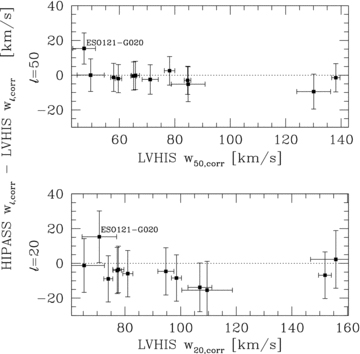
Comparison between the derived H i velocity line widths from the LVHIS galaxies and the offset from the H i velocity line widths measured by HIPASS, corrected for instrumental broadening.
Various quantities have been obtained to describe the spectral properties of each galaxy. The spectral properties for the sample galaxies obtained from the LVHIS data are listed in Table 3. The columns are organized as follows.
Column (1) – galaxy name.
Column (2) – the H i peak flux density, Speak, with its uncertainty given by σ(Speak)2= rms2+ (0.05Speak)2, following that described in Koribalski et al. (2004) and Barnes et al. (2001).
Column (3) – integrated (spatially and spectrally) H i flux density,
 , and its uncertainty in Jy km s−1. The uncertainty has been calculated as
  (Fouque et al. 1990; Koribalski et al. 2004), where Δv= 4 km s−1 is the velocity resolution of LVHIS.
Column (4) – the H i heliocentric velocity, vhel which has been measured as the midpoint of the 50 per cent level of peak flux density. The uncertainty in vhel was calculated as σ(vhel) = 3σ(Speak)/Speak(Pδv)1/2, where P= 0.5(w20−w50) is a measure of the steepness of the profile edges (Fouque et al. 1990; Koribalski et al. 2004).
Columns (5) and (6) – the velocity line widths, w50 and w20 which are the widths of the H i line profile measured at the 50 and 20 per cent level of peak flux density, respectively. The uncertainties are calculated as σ(w50) = 2σ(vhel) and σ(w20) = 3σ(vhel) following that of Schneider et al. (1986) (using the same definition as Koribalski et al. 2004).
Column (7) – the H i mass in solar units calculated as
 (Roberts 1975; Roberts & Haynes 1994).
Column (8) – the ratio of the flux detected by LVHIS to the flux detected by HIPASS.
4.1 A comparison with HIPASS
The HIPASS measurement of the H i line width of ESO 121−G020 (96 km s−1 at the 20 per cent level of peak flux density) is significantly larger than the LVHIS measurement (73 ± 6 km s−1). Warren et al. (2006) identified a nearby companion ATCA J061608−574552 at a projected distance of 3 arcmin from ESO 121−G020. HIPASS measured these two galaxies as a single point source because the intrinsic size is much smaller than the angular resolution of 15.5 arcmin and hence the HIPASS spectrum is broadened by the companion galaxy.
The mean difference between the HIPASS and LVHIS H i velocity line widths for all sample galaxies excluding ESO 121−G020 is −2.0 ± 3.1 and −6.1 ± 6.2 km s−1 (or −0.6 ± 5.9 and −4.6 ± 8.0 km s−1 including ESO 121−G020) at the 50 and 20 per cent levels of peak flux density, respectively. HIPASS measurements of the H i line width have a median uncertainty of 8 and 12 km s−1 for w50 and w20, respectively. We conclude that the two H i surveys obtained consistent measurements of the H i velocity line widths, however, the agreement is clearly better for w50. We note that the use of the Verheijen & Sancisi (2001) method to correct for instrumental broadening does not change the overall results.
The HIPASS spectrum at the coordinates of IC 5152 also contains H i emission from Galactic high-velocity clouds at a velocity of 33 km s−1 with a peak flux of 0.7 Jy. Fortunately this does not overlap with the velocity range of IC 5152 and does not affect the HIPASS measurements. This is resolved and excluded from the spectrum in the LVHIS observations. The LVHIS spectrum of ESO 245−G005 shows a strong H i absorption line at a redshift of 386 km s−1. Similarly, the LVHIS spectrum of ESO 381−G020 shows two weak absorption lines at 581 and 597 km s−1. LVHIS measured the integrated flux density of ESO 174−G?001 11 per cent lower than HIPASS. This indicates that the interferometer filtered out the more extended, diffuse H i emission due to the missing short baselines but the flux was observed by the single dish observations of HIPASS. Note that although LVHIS measured the integrated flux density of ESO 137−G018 to be higher than HIPASS, it appears to be due to uncertainty in the HIPASS baseline.
5 Rotation Curves
5.1 Fitting procedure
The H i rotation curves were derived by fitting a tilted ring model to the mean H i velocity fields. We utilized the tilted ring fitting algorithm, ROTCUR, which is incorporated in the Groningen Image Processing System (GIPSY; van der Hulst et al. 1992; Vogelaar & Terlouw 2001). The width of each tilted ring was set to 2/3 that of the synthesized beam (following that adopted by Verheijen & Sancisi 2001) with an average value of 30 arcsec.
First, the systemic velocity and the dynamic centre of the galaxy were determined by fitting one large ring that encompasses all of the data. All data points within the ring were given equal consideration, i.e. were uniformly weighted. The uncertainty in the systemic velocity and the dynamic centre was estimated by fitting multiple tilted rings to the data and taken to be the range in the values obtained. Once the systemic velocity and dynamic centre were determined, they were kept at that value for the rest of the analysis.
Next, the kinematical position angle and inclination of the galaxy’s H i disc was obtained. The data was weighted by |cos θ|, where θ is the angle from the semimajor axis of the galaxy. Hence data near the semimajor axis are given the most consideration whereas data near the semiminor axis are given the least consideration to avoid large deprojection errors. The position angle was fixed first, either to the average value for all tilted rings if appropriate, or to a general trend, if it was found to vary systematically as a function of radius. Once the position angle was fixed, the inclination was investigated. The inclination could sometimes be highly variable. Hence at this step, the inclination would either be obtained via the titled ring model, or the inclination was set such that the model has the same semimajor/semiminor axis ratio as the observed distribution of the H i gas. We indicate in the results when the titled ring model failed and the inclination is obtained to reproduce the galaxy’s axis ratio and correct this value for the thickness of the disc (Maller et al. 2009) using qz= 0.1 as the galaxy compression (Nedyalkov 1993). The uncertainty in the position angle and inclination was estimated from the range in values obtained for the multiple rings fitted.
Finally, the rotation curve was obtained by fitting a final tilted ring model to the |cos θ| weighted data with systemic velocity, dynamic centre, position angle and inclination fixed to the values obtained in the previous steps. The rotation curve for the receding and approaching sides of a galaxy were obtained separately by fixing the dynamic centre and the systemic velocity to that found when analysing the whole galaxy, and obtaining the position angle and inclination separately for each side. The difference between the approaching and receding sides of the rotation curve is representative of the uncertainties due to asymmetries in the galaxy rotation (Swaters 1999; de Blok et al. 2008).
To accurately obtain a true measure of the rotational velocity, the effect of pressure on the rotation curve needs to be considered (i.e., an asymmetric drift correction). However, this is only important if the rotational velocity is comparable to the velocity dispersion (Begum & Chengalur 2003), which is not the case for our sample galaxies. Swaters et al. (2009) calculated the correction required for a sample of similar galaxies and showed that the correction is typically smaller than 3 km s−1; less than the uncertainties in our derived velocities. Therefore we have not corrected the rotation curves for asymmetric drift.
Any deviations from the method stated above will be noted in the detailed discussion for each galaxy.
5.2 Rotation curve results
The H i rotation curve parameters obtained by the titled ring analysis for each galaxy are listed in Table 4. There we list the following columns.
Rotation curve results.
| Galaxy (1) | Beam (arcsec2) (2) | Centre RA (J2000) (3) | Centre Dec. (J2000) (4) | Δ centre (arcsec) (5) | vsysa (km s−1) (6) | PAa (°) (7) | ia (°) (8) | vmaxb (km s−1) (9) | vflatb (km s−1) (10) |
| AM 0605−341 | 80 × 52 |  | −34°12′22″ | 7.5 | 757 ± 2 | 274 ± 5 | (50) | 85 | A |
| AM 0704−582 | 59 × 53 |  | −58°31′10″ | 10.5 | 564 ± 3 | 276 ± 2 | (35) | 57 | A |
| ESO 059−G001 | 51 × 47 |  | −68°11′17″ | 8 | 527 ± 2 | 329–319 | 45 ± 10 | 61.8 | B |
| ESO 121−G020 | 40 × 37 | 06h15m54s c | −57°43′32″c | – | 584 ± 1 | 265 ± 5 | (40) | 48.7 | A |
| ESO 137−G018 | 57 × 49 |  | −60°29′23″ | 19.5 | 601 ± 2 | 33–28 | 50 ± 6 |  | 80 ± 2 |
| ESO 174−G?001 | 61 × 50 |  | −53°21′08″ | 10 | 682 ± 5 | 233–202 | 40 ± 5 |  | 65 ± 9 |
| ESO 215−G?009 | 47 × 41 |  | −48°10′45″ | 30 | 598 ± 3 | 123–116 | 35 ± 3 |  | 54 ± 5 |
| ESO 245−G005 | 71 × 48 |  | −43°36′38″ | 20 | 392 ± 3 | 70–98 | 36 ± 6 | 51 | 51 |
| ESO 308−G022 | 65 × 46 |  | −40°43′12″ | 7 | 823 ± 1 | 82 ± 2 | (40) | 40 | A |
| ESO 325−G?011 | 62 × 43 |  | −41°51′50″ | 15 | 546 ± 5 | 302 ± 4 | 42 ± 10 |  | A–B |
| ESO 381−G020 | 80 × 49 |  | −33°50′11″ | 10 | 587 ± 2 | 295–314 | 55 ± 10 | 46.7 | – |
| IC 5152 | 47 × 40 |  | −51°17′50″ | 16 | 121 ± 2 | 271–198 | 49 ± 6 |  | A–B |
| Galaxy (1) | Beam (arcsec2) (2) | Centre RA (J2000) (3) | Centre Dec. (J2000) (4) | Δ centre (arcsec) (5) | vsysa (km s−1) (6) | PAa (°) (7) | ia (°) (8) | vmaxb (km s−1) (9) | vflatb (km s−1) (10) |
| AM 0605−341 | 80 × 52 | | −34°12′22″ | 7.5 | 757 ± 2 | 274 ± 5 | (50) | 85 | A |
| AM 0704−582 | 59 × 53 | | −58°31′10″ | 10.5 | 564 ± 3 | 276 ± 2 | (35) | 57 | A |
| ESO 059−G001 | 51 × 47 | | −68°11′17″ | 8 | 527 ± 2 | 329–319 | 45 ± 10 | 61.8 | B |
| ESO 121−G020 | 40 × 37 | 06h15m54s c | −57°43′32″c | – | 584 ± 1 | 265 ± 5 | (40) | 48.7 | A |
| ESO 137−G018 | 57 × 49 | | −60°29′23″ | 19.5 | 601 ± 2 | 33–28 | 50 ± 6 | | 80 ± 2 |
| ESO 174−G?001 | 61 × 50 | | −53°21′08″ | 10 | 682 ± 5 | 233–202 | 40 ± 5 | | 65 ± 9 |
| ESO 215−G?009 | 47 × 41 | | −48°10′45″ | 30 | 598 ± 3 | 123–116 | 35 ± 3 | | 54 ± 5 |
| ESO 245−G005 | 71 × 48 | | −43°36′38″ | 20 | 392 ± 3 | 70–98 | 36 ± 6 | 51 | 51 |
| ESO 308−G022 | 65 × 46 | | −40°43′12″ | 7 | 823 ± 1 | 82 ± 2 | (40) | 40 | A |
| ESO 325−G?011 | 62 × 43 | | −41°51′50″ | 15 | 546 ± 5 | 302 ± 4 | 42 ± 10 | | A–B |
| ESO 381−G020 | 80 × 49 | | −33°50′11″ | 10 | 587 ± 2 | 295–314 | 55 ± 10 | 46.7 | – |
| IC 5152 | 47 × 40 | | −51°17′50″ | 16 | 121 ± 2 | 271–198 | 49 ± 6 | | A–B |
aValue for tilted ring model fitted to both approaching and receding sides, inclinations given in parenthesis indicate that the tilted ring analysis failed and the H i dimensions were used to constrain this parameter.
bThe uncertainty in the measurement represents the tilted ring model for the approaching and receding sides; A – the flat part of the rotation curve is not reached; B – the rotation curve appears to be flattening at the outermost radii with measured rotational velocity.
cCould not be fixed using the tilted ring analysis and was set to the optical centre.
Rotation curve results.
| Galaxy (1) | Beam (arcsec2) (2) | Centre RA (J2000) (3) | Centre Dec. (J2000) (4) | Δ centre (arcsec) (5) | vsysa (km s−1) (6) | PAa (°) (7) | ia (°) (8) | vmaxb (km s−1) (9) | vflatb (km s−1) (10) |
| AM 0605−341 | 80 × 52 | | −34°12′22″ | 7.5 | 757 ± 2 | 274 ± 5 | (50) | 85 | A |
| AM 0704−582 | 59 × 53 | | −58°31′10″ | 10.5 | 564 ± 3 | 276 ± 2 | (35) | 57 | A |
| ESO 059−G001 | 51 × 47 | | −68°11′17″ | 8 | 527 ± 2 | 329–319 | 45 ± 10 | 61.8 | B |
| ESO 121−G020 | 40 × 37 | 06h15m54s c | −57°43′32″c | – | 584 ± 1 | 265 ± 5 | (40) | 48.7 | A |
| ESO 137−G018 | 57 × 49 | | −60°29′23″ | 19.5 | 601 ± 2 | 33–28 | 50 ± 6 | | 80 ± 2 |
| ESO 174−G?001 | 61 × 50 | | −53°21′08″ | 10 | 682 ± 5 | 233–202 | 40 ± 5 | | 65 ± 9 |
| ESO 215−G?009 | 47 × 41 | | −48°10′45″ | 30 | 598 ± 3 | 123–116 | 35 ± 3 | | 54 ± 5 |
| ESO 245−G005 | 71 × 48 | | −43°36′38″ | 20 | 392 ± 3 | 70–98 | 36 ± 6 | 51 | 51 |
| ESO 308−G022 | 65 × 46 | | −40°43′12″ | 7 | 823 ± 1 | 82 ± 2 | (40) | 40 | A |
| ESO 325−G?011 | 62 × 43 | | −41°51′50″ | 15 | 546 ± 5 | 302 ± 4 | 42 ± 10 | | A–B |
| ESO 381−G020 | 80 × 49 | | −33°50′11″ | 10 | 587 ± 2 | 295–314 | 55 ± 10 | 46.7 | – |
| IC 5152 | 47 × 40 | | −51°17′50″ | 16 | 121 ± 2 | 271–198 | 49 ± 6 | | A–B |
aValue for tilted ring model fitted to both approaching and receding sides, inclinations given in parenthesis indicate that the tilted ring analysis failed and the H i dimensions were used to constrain this parameter.
bThe uncertainty in the measurement represents the tilted ring model for the approaching and receding sides; A – the flat part of the rotation curve is not reached; B – the rotation curve appears to be flattening at the outermost radii with measured rotational velocity.
cCould not be fixed using the tilted ring analysis and was set to the optical centre.
Column (1) – galaxy name.
Column (2) – beam size, in arcsec.
Columns (3)–(5) – dynamic centre position and uncertainty.
Column (6) – the systemic velocity, vsys.
Column (7) – the position angle, taken in anticlockwise direction, between the north direction on the sky and the major axis of the receding half of the galaxy. Here if two values are given, then the position angle was found to vary as a function of radius, with the inner position angle given by the first value and the outer position angle given by the second.
Column (8) – the inclination of the tilted ring model. Here, for galaxies where the tilted ring model failed to obtain a solution for the inclination, the value was chosen such that the physical dimensions of the tilted ring model matched the observed distribution of the H i gas. This is indicated by listing the value obtained in parentheses.
Column (9) – the maximum rotational velocity obtained via the tilted ring model. The uncertainties, if given, represent the difference between the maximum rotational velocity obtained by fitting the tilted ring model to the entire galaxy and the maximum rotational velocity obtained by fitting the tilted ring model to the approaching and receding sides.
Column (10) – the rotational velocity at which the flat part of the rotation curve is obtained. Note that this value may be lower than the maximum rotational velocity as it is taken as the average of the flat part of the rotation curve (if sufficient data points are available).
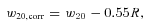
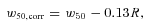
The derived tilted ring models are best compared visually to the mean H i velocity field of the galaxy. In Figs 5–7, we present the mean H i velocity field (the first moment map), the model velocity field (the tilted ring model) and the residual field (the difference between the observed field and the model). In Fig. 8 the derived rotation curve for each of the sample galaxies is presented. The derived rotation curve is presented with the solid line representing the tilted ring model fitted to the entire galaxy and the dashed lines represent the approaching and receding sides. In Fig. 9 we show the rotation curve of all sample galaxies overlaid for comparison.
From left to right: the H i velocity field, the derived tilted ring model and the difference between the mean H i velocity field and the model velocity field. The black contour overlaid on the derived tilted ring model shows the distribution of H i flux at the level of 0.5 Jy beam−1. Note that the velocity range chosen for the residual H i velocity field is adjusted for each galaxy.
From left to right: the H i velocity field, the derived tilted ring model and the difference between the mean H i velocity field and the model velocity field. The black contour overlaid on the derived tilted ring model shows the distribution of H i flux at the level of 0.5 Jy beam−1. Note that the velocity range chosen for the residual H i velocity field is adjusted for each galaxy.
From left to right: the H i velocity field, the derived tilted ring model and the difference between the mean H i velocity field and the model velocity field. The black contour overlaid on the derived tilted ring model shows the distribution of H i flux at the level of 0.5 Jy beam−1. Note that the velocity range chosen for the residual H i velocity field is adjusted for each galaxy.
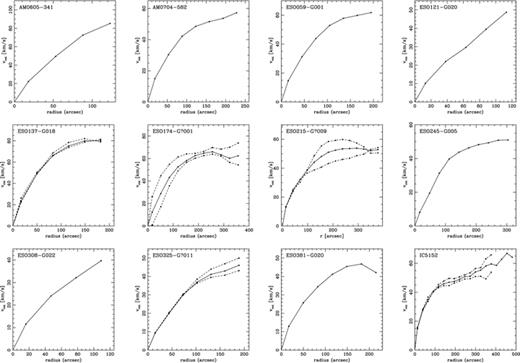
The derived rotation curve for sample galaxies. The solid line represents the titled ring model fitted to the entire galaxy, and the dashed lines represent the approaching and receding sides.
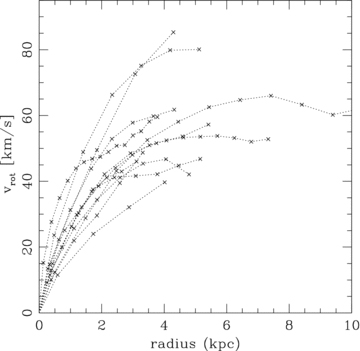
The derived rotation curve for sample galaxies overlaid for comparison. Here, only the average rotation curve for each galaxy is presented. The rotation curves for the individual approaching and receding sides are omitted.
6 Analysis
6.1 The kinematic systemic velocity of LVHIS galaxies
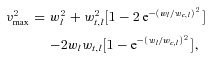
The heliocentric velocity (the central velocity of the H i spectrum) is fundamentally different from the systemic velocity derived from detailed studies of the kinematics of these galaxies. For example, a spectrum with a classic, symmetrical, double horn profile will likely have the centre of the spectrum coincide with the true systemic velocity. However in galaxies with an asymmetric spectral profile, this may not be the case if there is inflowing gas or if their dynamic centre is not aligned with the centre of the gas distribution (axisymmetric or peculiar H i distributions). In Fig. 10 we show the comparison between our derived systemic velocity (given in Table 4) and the centre of the H i spectrum where the latter is defined as the midpoint of the 50 per cent level of the peak flux (Koribalski et al. 2004). The vertical error bars are calculated as the sum in quadrature of the uncertainties in the derived systemic velocity and the HIPASS heliocentric velocity.
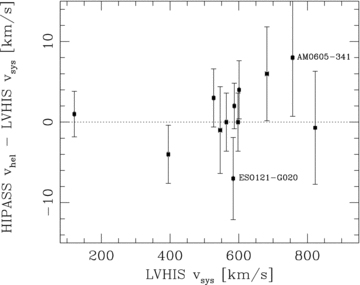
Comparison between the derived systemic velocity from the LVHIS galaxies (the centre of the tilted ring model) and the offset from the heliocentric velocity measured by HIPASS (the midpoint of the H i line profile). This shows that HIPASS data can be used to obtain the true systemic velocity of a galaxy to an accuracy of ∼10 km s−1.
It can be seen in Fig. 10 that the heliocentric velocities are similar to the true systemic velocities. The two furthest outliers are ESO 121−G020 and AM 0605−341. The heliocentric velocity of ESO 121−G020 cannot be correctly measured using HIPASS data due to the inclusion of an unresolved nearby companion (Warren et al. 2006) as mentioned before. The offset of the galaxy AM 0605−341 is due to the dynamical centre being offset from the centre of the H i distribution. This galaxy has an extension of redshifted atomic hydrogen, thus the heliocentric velocity is larger than the true systemic velocity. The distribution of the H i gas in AM 0605−341 is discussed in further detail in Section 7.1. Fig. 10 shows that there is no significant difference between the centre of the H i line profile and the true systemic velocity, with HIPASS data suitable to obtain the systemic velocity to an accuracy of approximately 10 km s−1.
6.2 Measuring rotation velocities from H i line profiles
Information on the rotational velocities of disc galaxies is of great importance for the study of their evolution and the reconstruction of the underlying dark matter potential (see e.g. Bosma 1978, 1981; Rubin, Thonnard & Ford 1978). Key areas of research in this context are the classical and baryonic Tully–Fisher relations, two empirical relations between the luminous or baryonic mass of a spiral galaxy and its peak rotation velocity (for recent studies see Pfenniger & Revaz 2005; Begum et al. 2008a; Stark, McGaugh & Swaters 2009; Trachternach et al. 2009). These relations can be used to measure distances, constrain properties of dark matter and study galaxy evolution as a function of redshift (Combes 2009). In this section we compare the rotational velocity obtained from H i line profiles and those obtained from kinematic modelling.
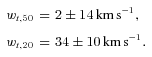
In Fig. 11 we show the relationship between the H i line width (from the LVHIS spectrum; Table 3) measured at the 50 per cent (w50, left-hand panel) and 20 percent (w20, right-hand panel) level of peak flux density and the maximum rotational velocity obtained by tilted ring modelling (see Table 4). The black squares represent the rotational velocity corrected using the inclination of the tilted ring model whereas the crosses show the rotational velocity corrected using the optical inclination. The H i line width has been corrected for instrumental broadening using the Bottinelli et al. (1990) method.
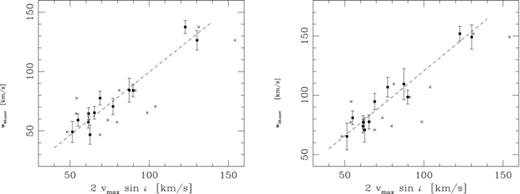
Comparison between the derived rotational velocity using the tilted ring analysis and the H i line width measured at the 50 and 20 per cent level of peak flux density. The H i line width is corrected for instrumental broadening. The black squares show the rotational velocity corrected using the inclination of the tilted ring model. The crosses show the considerable scatter introduced when the optical inclination is used. The dashed lines show the weighted least-squares fit to the data (equations 3 and 4).


From the tight correlations in equations (3) and (4) we conclude that w20 and w50 both are highly suitable quantities to infer the rotational velocity in the velocity range 50 < v < 150 km s−1. Previous studies (Corbelli & Schneider 1997; Meyer et al. 2008) were suggesting that w50 is the optimal quantity. This preference is not surprising as the HIPASS data on which the Meyer et al. (2008) study was based on had a much lower signal-to-noise ratio than our data (average rms noise of 13 mJy compared to 1.5 mJy for our sample). Using w50 naturally is less affected by the noise in the radio continuum. The Corbelli & Schneider (1997) study also recommended adopting the w50 to minimize the effects of warped outer discs, a feature that was not observed in our sample.
7 Individual Galaxies
7.1 AM 0605−341
AM 0605−341 is a nearby (D= 7.2 Mpc) magellanic-type spiral galaxy (see Fig. 1). It has a structureless stellar disc and a very bright bar (Matthews & Gallagher 1997), possibly with a starburst nucleus (Matthews & Gallagher 2002). This galaxy forms a small ensemble with the late-type spiral NGC 2188 (separation of 35.6 arcmin and 18 km s−1) and the irregular galaxy ESO 364−G?029 (separation of 70.2 arcmin and 22 km s−1). The HIPASS image of this group is shown in Fig. 12 along with contours showing the H i distribution measured by LVHIS (enlarged by a factor of 3 so that it is visible on the wide-field HIPASS image).
The HIPASS image of the galaxy group containing AM 0605−341, NGC 2188 and ESO 364−G?029. Because of the large beam size (shown at bottom right), these galaxies were unresolved in the HIPASS image. Overlaid are contours of the LVHIS integrated H i intensity distribution which have been enlarged (×3) so that they are visible on the wide field HIPASS image. Both NGC 2188 and AM 0605−341 have extensions of H i gas which we propose is of tidal origin.
The small angular diameter of AM 0605−341 (∼4 arcmin) makes resolved H i imaging extremely difficult to obtain. Previous H i observations (Gallagher, Littleton & Matthews 1995; Matthews, van Driel & Gallagher 1998; Meyer et al. 2004) have been from single dish telescopes and were able to measure only a point source spectrum. Our H i synthesis imaging of AM 0605−341 thus reveals the atomic hydrogen distribution for the first time.
We find an asymmetric H i distribution with respect to the optical and dynamic centres (see Fig. 5). There is an extension of redshifted H i located to the west of the galaxy. This is opposite to the direction of NGC 2188 (located to the east of AM 0605−341). Domgoergen et al. (1996) have already noticed that NGC 2188 shows a similar extension directly opposite to AM 0605−341. These authors suggested that the extension observed in NGC 2188 is unlikely to be due to some interaction. However, they identify only ESO 364−G?029 as a potential disturber although they do point out that an interaction with an unknown neighbour was possible. We propose that the extensions of NGC 2188 and AM 0605−341 are of tidal origin due to their interaction. The angular distance of the two galaxies is 77 kpc.
There is no distortion to the AM 0605−341 velocity field indicating a bar feature. However, the bright bar observed by Matthews & Gallagher (1997) is smaller than the synthesized beam, so the non-detection in the H i is to be expected.
We derive a H i rotation model in Fig. 5. Because of the galaxy’s small angular size, the inclination measurement did not converge using a tilted ring model. Thus a value was chosen such that the model had the same semimajor and minor dimensions as the observed H i distribution. This corresponds to an inclination of 50° which was adopted to derive the AM 0605−341 rotation curve. Setting the inclination to slightly higher or lower values (±10°) does not significantly increase the residual difference between the observed H i velocity field and the model due to the degeneracy between the rotational velocity and the inclination (Begeman 1989). Furthermore, the chosen inclination is higher than the optical inclination of 26° from Matthews & Gallagher (2002). A rotation curve could not be obtained separately for the approaching and receding sides of the galaxy.
A Hα position velocity curve was measured for AM 0605−341 out to r= 20 arcsec by Matthews & Gallagher (2002) who concluded that the galaxy must have extended H i and reach its maximum rotational velocity well outside its stellar disc. Our result, with the rotation curve still increasing at the observed H i column density limit (r= 120 arcsec), is in good agreement with the Matthews & Gallagher result.
7.2 AM 0704−582/Argo
The near-IR image of the Argo Dwarf (Fig. 1, top panel, second to left) shows a very low surface brightness galaxy with no visible structures such as a bar or spiral features. The optical emission appears very extended and has almost no compact region (Parodi et al. 2002). The galaxy is extremely isolated in space with a tidal index of −2 using the Karachentsev & Makarov (1999) measure of interaction. The atomic hydrogen emission of this galaxy has been observed previously by HIPASS (Koribalski et al. 2004) and a point source spectrum was obtained. Here we present the first resolved H i synthesis imaging of the Argo Dwarf.
Our H i map reveals a regular velocity field. We also see that the peak integrated density is offset from the centre of the H i emission. The stellar component is located at the centre of the H i emission which is also the location of the dynamic centre as derived by our rotation curve analysis.
The orientation parameters of the H i disc are inconsistent with orientation parameters for the stellar disc in the literature, but this is due to the large uncertainty in the optical measurements rather than a detection of a warp. The position angle of the H i disc derived by rotation curve fitting was effectively constant as a function of radius and determined at 276°± 2°. This is different to the values of 225° (Kirby et al. 2008) and 354° (Parodi et al. 2002); however, due to the extreme low surface brightness of the optical emission, these values have considerable uncertainty. Hence deeper optical imaging is required to determine whether the optical position angle and H i position angle are aligned. We found that the inclination could not be determined using the tilted ring analysis. Thus the inclination was chosen so that the model had the same semimajor and semiminor dimensions as the observed H i distribution. This yielded an inclination of 35° which was used to derive the rotation curve. Once again, it should be noted that the inclination and the rotational velocity are degenerate parameters (Begeman 1989), therefore, changing the inclination does not significantly change the residual difference between the observed H i velocity field and the model. Kirby et al. (2008) measured the inclination of the outermost isophote to be 65° by fitting ellipses as a function of radii, however, once again, it should be noted that due to the extreme low surface brightness, this value has considerable uncertainty.
The kinematic model obtained by rotation curve analysis is in good agreement with the observed velocity field. The typical differences between the observations and the model are less than 4 km s−1. A rotation curve could not be obtained separately for the approaching and receding sides of the galaxy.
7.3 ESO 059−G001
ESO 059−G001 is an isolated low surface brightness dwarf irregular galaxy 4.57 Mpc away from the Milky Way (Karachentsev et al. 2006). The galaxy has a tidal index of −1.5 using the Karachentsev & Makarov (1999) measure of interaction. Parodi et al. (2002) found rudiments of spiral arms in their B-band imaging which were subsequently confirmed by Advanced Camera for Surveys (ACS)-Hubble Space Telescope (HST) imaging (Karachentsev et al. 2006). Helmboldt et al. (2004, 2005) reported two H ii regions and a total Hα flux of log (FHα) =−12.19 erg s−1 cm−2.
An H i point source spectrum was initially obtained by HIPASS (Koribalski et al. 2004) while our resolved H i synthesis image of ESO 059−G001 reveals details of the atomic hydrogen distribution for the first time. The galaxy shows a regularly rotating H i velocity field. The kinematic model obtained by the rotation curve analysis is in excellent agreement with the observed velocity field with a typical residual less than 4 km s−1. We found that the inclination varied between 35° and 55° with no clear trend. Thus the inclination was set to 45°. We also note that this average value optimized the dimensions of the model compared to the observed H i distribution. A rotation curve could not be obtained separately for the approaching and receding sides of the galaxy.
7.4 ESO 121−G020
ESO 121−G020 is a dwarf irregular galaxy located 6.05 Mpc from the Milky Way. The galaxy is about 2.6 mag fainter in the near-IR than ESO 059−G001. It has a small companion, ATCA J061608−574552, located approximately 3 arcmin to the south-east. Warren et al. (2006) detected neither an H i nor a stellar bridge between the two galaxies.
The galaxy ESO 121−G020 was analysed using new LVHIS data and ATCA archival data that was originally obtained by Warren et al. (2006). The combined data set easily resolves the two galaxies in angular and velocity space. A slight distortion is observed in the south-eastern region of the velocity field most likely caused by the companion, however, the strength of this feature is low compared to the overall bulk rotation. The companion galaxy was masked from the data during the kinematic analysis of ESO 121−G020.
The dynamic centre could not be obtained with the help of a tilted ring model and was thus assumed to be the optical centre. This assumption was justified by the observation that the dynamic centres for all galaxies in our sample agree with the optical centres as defined by the outermost isophotes (see Trachternach et al. 2008 for similar result). In contrast to the Warren et al. (2006) kinematic model, the inclination value was statistically unstable. The value of 78 ± 5 used by Warren et al. implies that the galaxy would be almost edge-on which is clearly not the case (see Fig. 5). This discrepancy was investigated more closely and we concluded that the high inclination obtained by Warren et al. was in fact the result of fitting a small number of data points rather than a genuine better fit. The H i image had very low resolution and the fitting routine tended to higher inclination values to reduce the number of data points used in the fitting process. While the residuals were lower, this was a direct consequence of comparing fewer data points, not that the obtained model was intrinsically more accurate. We choose to model ESO 121−G020 by keeping the inclination fixed at 40° which results in a model with the same semimajor and semiminor dimensions as the observed H i distribution.
The overestimation of the inclination in the Warren et al. result has a direct effect on some of the values quoted in their paper. We measure a rotation velocity of 36 km s−1 at the maximum radius of 80 arcsec compared to their value of 21 km s−1. At our outermost radius (113 arcsec) we measure a rotation velocity of 49 km s−1 with the rotation curve still rising. These new parameters and the improved TRGB distance measurement (Karachentsev et al. 2006) imply that the lower limit for the dynamical mass is 1.7 × 10⁹ M⊙ (M=v2rG−1). Using the Warren et al. (2006) total B-band luminosity of (2.39 ± 0.13) × 107 L⊙, we get a lower limit for the dynamical mass-to-light ratio of ∼70 M⊙/L⊙ suggesting that this galaxy is a dark-matter-dominated object. Other low luminosity dwarf galaxies are known to have mass-to-light ratios similar to this and higher (see e.g. ESO 215−G?009 which has a dynamical mass-to-light ratio of 200 ± 110 M⊙/L⊙; Warren et al. 2004).
The incorrect inclination obtained by Warren et al. (2006) highlights the need for visual inspection of the model rotation field compared to the observed rotation field. This is particularly important for upcoming surveys in the Square Kilometre Array (SKA) era, where due to the sheer volume of data automated pipelines will be employed to do rotation curve fitting.
7.5 ESO 137−G018
ESO 137−G018 is an isolated late-type galaxy of type Sm or Im located behind the Galactic plane (b=−7°.4). It has several bright superimposing foreground stars (Fig. 1) and hence the optical properties are poorly constrained. The current distance estimate (D= 6.4 Mpc) is based on the TRGB magnitude (Karachentsev et al. 2007).
The only previously available H i observations of ESO 137− G018 were obtained by HIPASS (Koribalski et al. 2004) which measured point source spectrum. Our H i synthesis observations show that the integrated density field is very symmetric about the major and minor axes of the galaxy. The velocity field resembles an undisturbed, regularly rotating system. The kinematic model obtained by rotation curve analysis is in good agreement with the observed velocity field. The typical velocity residuals are less than 5 km s−1. Our rotation curve shows that the H i is tracing the galaxy out to the radius at which the peak rotation velocity at 80 ± 2 km s−1 is reached.
We find that the position angle of ESO 137−G018 decreases from 33° to 28°, but the inclination is steady at 50°± 6°. The position angle on the approaching and receding sides is well constrained at 30°± 2° and 33°± 2°, respectively. The inclination on the approaching and receding sides is 50°± 7° and 48°± 4°, respectively. Thus the approaching and receding sides of ESO 137−G018 exhibit similar kinematic behaviour.
7.6 ESO 174−G?001
ESO 174−G?001 is a nearby (D= 6 Mpc) low surface brightness (LSB) galaxy located near the Galactic plane (b= 8°.6). The galaxy is a member of the Centaurus A group (Banks et al. 1999) and has poorly constrained optical properties. The optical image of ESO 174−G?001 shows a uniform and elongated distribution of stars.2
Previous H i studies of this galaxy (Banks et al. 1999; Huchtmeier, Karachentsev & Karachentseva 2001; Koribalski et al. 2004) have been from single dish telescopes and were only able to measure a point source spectrum. Here we present the first resolved H i imaging of ESO 174−G?001. We observe a disturbed H i velocity field (Fig. 6). The kinematic major axis of ESO 174−G?001 is not perpendicular to the kinematic minor axis indicating that the gas is moving in elliptical orbits in the plane of the galaxy (Bosma 1978; Simon et al. 2003). Thus it was to be expected that the tilted ring model will not accurately reproduce the observed velocity field. Due to this, ESO 174−G?001 has not been included in the Tully–Fisher analysis presented in Section 8. It should be noted that a tilted ring model was fitted to a galaxy showing non-circular motions, which means that the derived rotational velocity is likely to have been underestimated (Rhee et al. 2004; Oh et al. 2008). While a rotation curve could be derived, the residual between the observed velocity field and the model velocity field in some areas was up 11 km s−1, almost three times higher than the velocity resolution. The flat part of the rotation curve was reached.
The rotation curve was derived for the approaching and receding sides of the galaxy. It was found that the position angle decreased from 233° to 202° as a function of radius both for the individual sides and for the galaxy as a whole. The position angle of the H i is not aligned with the position angle of the stellar component (165°). The inclination was found to be 40°± 5° overall or 46°± 7° and 40°± 5° on the approaching and receding sides, respectively, which is lower than the inclination of the stellar component (60°).
7.7 ESO 215−G?009
ESO 215−G?009 is a LSB galaxy located near the Galactic plane. Warren et al. (2004) have studied the optical and H i properties of this galaxy extensively and we refer the reader to their study. They found that ESO 215−G?009 has a H i mass-to-light ratio of 22 ± 4 M⊙/L⊙, B, the highest known for any galaxy.3 We modelled the kinematics using a tilted ring analysis and our results are generally consistent with those of Warren et al. (2004).
It is interesting to note that although the velocity field of ESO 215−G?009 was reasonably well modelled, the ellipticity of the model does not agree well with the observed H i distribution. The highly circular gas distribution suggests that the galaxy must have an inclination of approximately 20° but this is inconsistent with the high line-of-sight rotation (w20= 79 ± 1 km s−1) and the derived inclination of the model (35°± 3°). This may well be evidence that the assumption of the gas being located in an infinitely thin disc is incorrect. Such extraplanar H i was first observed in NGC 891 (Swaters, Sancisi & van der Hulst 1997) and has since been observed in other nearby galaxies (Boomsma et al. 2005; Hess et al. 2009). Any extension of gas along the vertical component of the disc will naturally result in an increase of the observed semiminor axis and could explain the highly circular observed distribution of H i gas in ESO 215−G?009.
7.8 ESO 245−G005
ESO 245−G005 is a barred magellanic galaxy located 4.4 Mpc away from the Milky Way. It has a star formation rate of 0.02 M⊙ yr−1 (Oey et al. 2007). Côté et al. (2000) suggest that due to a strong abundance oxygen gradient along the bar (oxygen abundance changes by a factor of 3; Miller 1996), either an H i cloud of a different metallicity has been accreted or that the whole object is the product of a recent merger. Côté et al. (2000) have obtained H i synthesis imaging and observed a very peculiar velocity field. Despite the indications that ESO 245−G005 has had past interactions, no shock waves are detected through the study of its diffuse ionized gas (Hidalgo-Gámez 2006).
Our H i imaging shows that the integrated density field has several regions of peak flux density. The velocity field is disturbed. A kinematic model was derived by tilted ring analysis but the residual between the observed velocity field and the model velocity field in some areas was up 10 km s−1.
We find evidence that ESO 245−G005 has a warp in its outer regions. At a radius of r≈ 200 arcsec there is a rise in inclination and an associated change in the position angle. The detection of a warp gives further support to the Côté et al. (2000) hypothesis that ESO 245−G005 has undergone recent accretion (Ostriker & Binney 1989; Jiang & Binney 1999).
The H i position angle was found to rise from 70° in the inner portion of the galaxy (r < 200 arcsec) to 98° in the outer regions. This is not aligned with the position angle of the stellar disc (127°; Kirby et al. 2008). The H i inclination was modelled 36°± 6° which is also not aligned with the inclination of the stellar disc (52°; Kirby et al. 2008). The H i inclination increases and becomes highly variable in the outer parts (56°± 12° for r > 200 arcsec). Because of this variability, the entire galaxy was modelled using the inclination derived for the inner region. Kinematic modelling could not be achieved for the approaching and receding sides separately.
The H i kinematics of ESO 245−G005 has been studied previously by Côté et al. (2000) whose results differ somewhat from those presented here. Côté et al. (2000) observed a similar trend in position angle, however, chose to model the position angle as a constant value of 88°± 8°. They find a higher inclination of 54°± 10° which is similar to that which we obtain for the inclination at larger radii.
7.9 ESO 308−G022
ESO 308−G022 is a dwarf irregular galaxy located ∼7.6 Mpc away from the Milky Way. The deep near-IR image (see Fig. 1) shows an extended stellar distribution with no visible structures such as a bar or spiral features. The optical image of Parodi et al. (2002) shows an extended and diffuse galaxy with a few regions of brighter emission.
The new LVHIS H i synthesis imaging of ESO 308−G002 reveals the atomic hydrogen distribution for the first time. Previous H i observations (Matthews, Gallagher & Littleton 1995; Huchtmeier et al. 2000; Meyer et al. 2004) of this galaxy have been obtained by single dish telescopes and were only able to measure a point-source spectrum. Our H i imaging is able to resolve ESO 308−G002 despite its small angular diameter (∼4 arcmin).
The kinematic model obtained by rotation curve analysis is in good agreement with the observed velocity field. The typical differences between the observations and the model are less than 6 km s−1. A rotation curve could not be obtained separately for the approaching and receding sides of the galaxy. The rotation curve does not flatten at the last points measured suggesting that the H i is not tracing the galaxy out to the radius at which the maximum rotation velocity is reached.
Because of the small angular diameter of ESO 308−G022 our observations have low resolution and the inclination could not be determined using a tilted ring model. Thus it was chosen such that the model had the same semimajor and semiminor dimensions as the observed H i distribution (40°). The position angle was found to be constant at 82°± 2°. This is inconsistent with measurements of the position angle of the stellar disc (130° and 160° by Kirby et al. 2008 and Parodi et al. 2002, respectively). However, the alignment parameters for the stellar component have considerable uncertainty as the galaxy has very low surface brightness. Therefore, deeper near-IR or optical imaging is required before the alignment between the stellar and H i discs can be confirmed.
7.10 ESO 325−G?011
ESO 325−G?011 is a dwarf irregular galaxy and a member of the Centaurus A group. It has a TRGB distance of 3.4 Mpc which is consistent with its group membership (Karachentsev et al. 2002a). The optical image shows that the stellar distribution is asymmetric; the central area of highest surface brightness is offset from the centre defined by the outer isophotes.
The atomic hydrogen of this galaxy has been observed on numerous occasions with both single dish telescopes (Longmore et al. 1982; Huchtmeier & Richter 1986; Côté et al. 1997; Banks et al. 1999; Koribalski et al. 2004) and with H i synthesis imaging (Côté et al. 2000). While the Côté et al. (2000) imaging was able to resolve the atomic hydrogen distribution of ESO 325−G?011, their data had significantly lower sensitivity with an rms noise of 4.6 mJy beam−1 than the LVHIS value of 1.3 mJy beam−1.
Our H i imaging shows that the integrated density is asymmetric with the peak flux density offset from the centre of the H i emission. The position of the peak integrated density is located at the position of the optical core. ESO 325−G?011 has an extremely regular velocity field. The kinematic model obtained by the rotation curve analysis is in excellent agreement with the observed velocity field. The typical differences between the observations and the model are less than 2 km s−1, the lowest for all galaxies in our sample.
We find that the optical position angle is aligned with the H i position angle. The H i inclination (42°± 10°) is lower than that of the stellar component (60°), but the optical inclination was obtained from a DSS image and thus deeper imaging is required. Kinematic modelling has been done previously by Côté et al. (2000) who used a slightly higher inclination (52°± 5°) for their models. This value is consistent within the uncertainties with the value used here. We also note that Côté et al. (2000) fitted four tilted rings to their H i data and only the inner two agree with the value adopted in their model. The outer two tilted rings have inclinations similar to the value we measure.
7.11 ESO 381−G020
ESO 381−G020 is a dwarf irregular galaxy located at 5.4 Mpc (Karachentsev et al. 2007) and a member of the Centaurus A group. The optical image shows a very asymmetric stellar distribution, similar to that of ESO 325−G?011.
Previous H i studies of this galaxy have been carried out using single dish telescopes (Longmore et al. 1982; Huchtmeier & Richter 1986; Côté et al. 1997; Banks et al. 1999; Koribalski et al. 2004) as well as with synthesis imaging (Côté et al. 2000). The kinematics of this galaxy have previously been studied by Côté et al. (2000) using their synthesis imaging. Their observations have higher angular resolution (13 × 13 arcsec2 compared to 80 × 49 arcsec2) but slightly lower sensitivity (rms noise of 1.7 mJy beam−1 compared to 1.3 mJy beam−1). The Côté et al. (2000) study allows a useful comparison to ensure that our analysis provides consistent results with those of others.
The observed H i velocity field is somewhat disturbed with the contours of constant velocity appearing asymmetric about the major axis. While a kinematic model could be derived, the residual between the observed velocity field and the model velocity field in some areas was up 10 km s−1.
The H i position angle was found to increase steadily from 295° to 314° as a function of radius. The latter value is consistent with the position angle of 310° derived from the outer isophotes of the stellar light. The inclination obtained by tilted ring analysis (55°± 10°) is higher than the inclination of the stellar component (40°). The kinematic study of this galaxy by Côté et al. (2000) obtained similar results. They modelled ESO 381−G020 with a position angle of 311°± 1° and an inclination of 57°± 6°. Their position angle is an average of the values obtained by their tilted ring analysis (with actual values ranging from 305° to 313°).
7.12 IC 5152
IC 5152 is a nearby irregular galaxy that was originally considered a LG candidate (Yahil, Tammann & Sandage 1977). However current distance estimates place it at 2.1 Mpc (Karachentsev et al. 2004), beyond the edge of the LG. Because of its close proximity to the Milky Way, it is often included in studies of the LG dynamics and evolution (see e.g. Chernin et al. 2004; Sawa & Fujimoto 2005; Pasetto & Chiosi 2007), hence requires accurate mass modelling. The near-IR image (see Fig. 1) shows a well resolved galaxy with a fairly bright centre. The central region of IC 5152 is an active site of star formation (Zijlstra & Minniti 1999) and several H ii regions have been studied (Hidalgo-Gámez & Olofsson 2002; Lee, Grebel & Hodge 2003). IC 5152 has many blue stars and dusty patches (Karachentsev et al. 2002b). The north-west corner has a very bright superimposed star. Deep CO emission maps have been obtained but no emission was detected (4σ upper limit of 0.03 K km s−1) despite the presence of large amounts of neutral gas (Buyle et al. 2006).
The H i line profile of IC 5152 has been studied previously using single dish telescopes (Huchtmeier & Richter 1986; Becker et al. 1988; Koribalski et al. 2004). H i synthesis imaging has also been obtained but only the integrated intensity map has been published (Buyle et al. 2006).
The H i velocity field shows a twisting of the contours of constant velocity. The kinematic model obtained by rotation curve analysis is presented in Fig. 7. At first glance, the model velocity field and the observed velocity field appear inconsistent as the physical dimensions are different. This occurs because the inclination and position angle obtained by tilted ring analysis implies a model that extends past beyond the observed H i in the north-west and south-east regions of the galaxy. However, if the model velocity field is masked by region defined in the observed velocity field, the agreement appears to be excellent, particularly given the distortion in the observed field (see Fig. 13). The typical differences between the observations and the model are less than 5 km s−1 with maximum deviations less than 10 km s−1. The physical motivation which allows for masking of the model is that the masked H i gas is thought to be present but below the observed column density limit.
Left: the observed H i velocity field of the LG irregular galaxy IC 5152. Right: the model velocity field masked using the region defined by the observed velocity field.
The inclination of IC 5152 is found to be constant as a function of radius at 49°± 6° which is consistent with the inclination of the stellar disc (50°; Kirby et al. 2008). The H i position angle (increasing from 271° to 298°) is also consistent with the inclination of the stellar disc (275°; Kirby et al. 2008).
8 The Tully–Fisher Relation
The classical and baryonic Tully–Fisher relations are empirical relations between the luminous or baryonic mass of a spiral galaxy and its peak rotation velocity (for recent studies see Pfenniger & Revaz 2005; Begum et al. 2008a; Stark et al. 2009; Trachternach et al. 2009). These relations can be used to measure distances, constrain properties of dark matter and study galaxy evolution as a function of redshift (Combes 2009) indicating the importance of accurately determining the empirical relationship, particularly in the dwarf regime. In Fig. 14 we show the classical (left-hand panel) and baryonic (right-hand panel) Tully–Fisher plots for our sample galaxies in the black squares.
The classical (left) and baryonic (right) Tully–Fisher relations. Here we compare our sample to the bright galaxy sample of Sakai et al. (2000), the faint galaxy sample of Begum et al. (2008a) and the isolated disc galaxy sample of Gurovich et al. (2010). The weighted least-squares fit to the data is given as the solid lines (see equations 8 and 9).


 . Since we have no direct measurement of the mass-to-light ratio for our sample galaxies, we estimate the stellar mass from the B-band luminosity using the moderate ratio M*/LB= 1.2 M⊙/L⊙, B (Bell & de Jong 2001). The baryonic mass includes the total gas mass which we obtain using the conversion factor
  (following McGaugh et al. 2000; Geha et al. 2006; Warren, Jerjen & Koribalski 2007). This takes into account primordial helium and metals but does not include molecular hydrogen. Dwarf galaxies are thought not to contain large amounts of molecular hydrogen (Taylor, Kobulnicky & Skillman 1998; Leroy et al. 2005). While the bright galaxies of the Sakai et al. (2000) sample will have significant amounts, the baryonic mass of these systems is dominated by the stellar component and the uncertainty in the mass-to-light ratio is likely to contribute a larger error than ignoring the molecular hydrogen (Begum et al. 2008a). We note that Pfenniger & Revaz (2005) suggested that the conversion factor could be as high as 2.98. This result, however, is based on a slight reduction to the scatter of their baryonic Tully–Fisher relation rather than any observational or theoretical evidence. Begum et al. (2008a) confirmed that the conversion factor is poorly constrained by the baryonic Tully–Fisher relation and showed that any value between ∼2 and 29 leads to significant tightening of the relation.
The tight correlation between the H i line width and the true rotational velocity obtained by tilted ring analysis (see Fig. 11) provides a degree of confidence in studies which utilize the H i line widths as a measure of rotation for Tully–Fisher investigations (see Meyer et al. 2008 for a recent example). However, we note that obtaining accurate distance estimates rather than using the midpoint of the H i line profile is imperative as both the classical and baryonic Tully–Fisher relation depend on this measurement (through the derivation of the absolute magnitude and the stellar and H i mass). Also of note is the fact that five galaxies (AM 0605−341, ESO 174−G?001, ESO245-G?009, ESO 325−G?011 and ESO 381−G020) in our sample were found to have an inclination of their H i disc different to the measured optical inclination (by more than 5°). When deprojecting the observed rotational velocity obtained from an H i line width, it is the inclination of the H i disc which should be used.
9 Conclusion
We have presented a kinematic study of 12 galaxies in the LV (D < 10 Mpc). The data were obtained using the ATCA as part of the LVHIS. For six galaxies in our sample (AM 0605−341, Argo Dwarf, ESO 059−G001, ESO 137−G018, ESO 174−G?001 and ESO 308−G022) we have presented the only resolved H i imaging available to date, revealing the atomic hydrogen distribution for the first time.
The global H i line spectra are presented and compared to those obtained by HIPASS. The spectrum of ESO 245−G005 shows a strong H i absorption line at a redshift of 386 km s−1. The spectrum of ESO 381−G020 shows two weak absorption lines at 581 and 597 km s−1. The comparison to the single-dish spectra of HIPASS shows that the new H i synthesis observations of IC 5152 are missing flux due to missing short baselines in the interferometer. The H i line widths obtained by HIPASS and LVHIS are consistent within the experimental uncertainties.
Rotation curve analysis has been carried out for all sample galaxies by applying a tilted ring model to the observed velocity field. The best-fitting rotation curve parameters are provided.
We show that the H i line width can be used to derive the rotational velocity of galaxies in the velocity range 50 < v < 150 km s−1 using the newly updated Tully & Fouque (1985) model, however, resolved observations are essential if an accuracy greater than approximately 10 km s−1 is required.
We derive classical and baryonic Tully–Fisher relations. These relationships will be explored further in the near future using LVHIS data and new deep H-band imaging currently being obtained at the 3.9-m Anglo-Australian Telescope.
AM 0605−341 was found to have an extension of redshifted H i located to its west. We propose that this is due to a tidal interaction with its nearby neighbour NGC 2188, which has previously been found to have a similar tidal extension.
ESO 121−G020 was found to have a much lower inclination (40°) than the current value available in the literature (78°; Warren et al. 2006). We derive the new lower limit for its dynamical mass as 1.7 × 10⁹ M⊙.
It was observed that the observed ellipticity of ESO 215−G?009 is inconsistent with its kinematic inclination (35°± 3°). The observed H i distribution is highly circular implying that the galaxy is nearly face-on. This may be evidence that the assumption of the gas being located in an infinitely thin disc is incorrect.
We find evidence that ESO 245−G005 has a warp in its outer disc, located at an angular radius of 200 arcsec. This lends support to the Côté et al. (2000) hypothesis that ESO 245−G005 has undergone recent accretion.
The authors thank Nic Bonne, Janine van Eymeren, Erwin de Blok and Juergen Ott for their help and advice during the preparation of this manuscript. We also thank the referee for their useful comments and suggestions for improvements. We acknowledge financial support from the Australian Research Council Discovery Project Grant DP0451426. This research has made use of the NASA/IPAC Extragalactic Database (NED) which is operated by the Jet Propulsion Laboratory, California Institute of Technology, under contract with the National Aeronautics and Space Administration. This research has made use of NASA’s Astrophysics Data System.
Footnotes
Note that the optical image currently available in NASA/IPAC Extragalactic Database (NED) is incorrect. The optical image available is that of ESO 174−G001 (not ESO 174−G?001) which has the coordinates  , −53°21′17″.
In Table 2 we list a lower value for the H i mass-to light ratio as 16.8 ± 3.0 M⊙/L⊙, B. The difference is introduced by using the Lauberts & Valentijn (1989),B-band magnitude (16.03 mag) whereas Warren et al. (2004) used a value taken from LEDA (16.43 mag). Furthermore, their value is using ATCA data whereas Table 2 is quoting HIPASS properties. Our value using ATCA measurement is fully consistent with the Warren et al. (2004) value.
REFERENCES
