


Abstract
It is important to understand the interplay between nuclear star formation and nuclear activity when studying the evolution of gas-rich galaxy mergers. We present here new spatially resolved L-band integral field unit observations of the inner kpc of the luminous infrared galaxy NGC 1614. A broad ring of 3.3-μm polycyclic aromatic hydrocarbon (PAH) emission is found at a distance of approximately 200 pc from the core. This ring overlaps with a previously established star-forming ring detected with Paα and radio continuum observations, but peaks outside it, especially if determined using the PAH equivalent width. Using the characteristics of the PAH emission and the ionized gas emission, we argue that NGC 1614 features an outward propagating ring of star formation, where the equivalent width of the PAH emission localizes the regions where the current star formation is just expanding into the molecular gas outward of the nucleus. The core itself shows a highly luminous, slightly resolved (at ∼80 pc) L-band continuum source. We find no evidence of active galactic nucleus (AGN) activity and rule out the presence of an obscured AGN using L-band diagnostics. Furthermore, we detect the likely companion galaxy from archival Hubble Space Telescope/Advanced Camera for Surveys (ACS) imaging. The star formation and dynamical characteristics of the system are consistent with a relatively major merger just after its second passage. An outstanding question is how a gas-rich advanced merger such as this one, with strong luminous infrared galaxies level nuclear starburst and major-merger-like tidal features, has not yet developed an active nucleus.
1 INTRODUCTION
In the local Universe, luminous and ultraluminous infrared galaxies, (U)LIRGs,1 are strongly related to merging activity. In a traditional view (see e.g. Sanders et al. 1988; Barnes & Hernquist 1992; Hopkins et al. 2006; Lonsdale, Farrah & Smith 2006), a merger between two spiral galaxies initiates with a close approach, with a second close approach of the order of 108 yr later, lasting of the order of 107 yr, followed by rapid coalescence, where the time-scales are parameter-dependent. A starburst first occurs during the early stages. At later stages, gas and dust are efficiently channelled into the nuclear regions, leading to both starburst and strong active galactic nucleus (AGN) activity. Feedback from the massive energy production in the heavily obscured AGN will subsequently quench star formation (SF; e.g. Springel, Di Matteo & Hernquist 2005; Johansson, Naab & Burkert 2009a) and drive out the remaining interstellar matter, revealing an optical quasi-stellar object (QSO) and eventually an elliptical galaxy with a ‘dead’ supermassive black hole (SMBH). The starburst activity, and thus the (U)LIRG phenomenon, is likely to occur episodically during both early and later phases of a merger (Murphy et al. 2001; Hopkins et al. 2006). (U)LIRG-level SF appears to begin while the progenitors are still separately distinguishable (Murphy et al. 1996) and a large fraction of them shows evidence for ongoing merging (Surace, Sanders & Evans 2000; Farrah et al. 2001), often with compact emission knots suggesting the formation of super star clusters. An important question is what triggers the SF and how the (circum)nuclear SF interacts with the nuclear activity (e.g. Laine et al. 2006; Watabe, Kawakatu & Imanishi 2008).
Whatever the details, to understand and establish the transformations of spirals into QSOs via (U)LIRGs, it is crucial to investigate ‘composite’ stages where both starbursts and AGN potentially co-exist (e.g. Yuan, Kewley & Sanders 2010). It is important to localize the starburst activity as well as to locate the early, buried AGN activity in order to understand the triggering processes and any causal relations. During the coalescence, SF is expected in the nuclear region where the gas density is highest, though more spread out SF is possible as well (Alonso-Herrero et al. 2006). The required high-resolution observations are complicated for two reasons. First, optical extinction is always high and major parts of the system are detectable only in the infrared (IR). Even Hubble Space Telescope (HST) images can miss complete galaxies and major nuclei (Väisänen et al. 2008; Haan et al. 2011). Secondly, the important mid-IR (MIR) Spitzer images showing the location of heated dust have poor angular resolution. Clarifying the environment and separating the various AGN and starburst components requires high-resolution IR observations.
The little explored 3–4 μm L band in the MIR is promising for separation of AGN and starbursts. The L-band continuum would be dominated by an AGN even if its bolometric luminosity would be minor; a starburst would yield strong 3.3-μm polycyclic aromatic hydrocarbon (PAH) emission, and cool dense gas around an AGN can show a 3.4-μm absorption feature (see e.g. Risaliti et al. 2006; Sani et al. 2008). The pioneering L-band spectroscopic surveys of starburst galaxies reported in Imanishi & Dudley (2000), Imanishi, Dudley & Maloney (2006) and Risaliti et al. (2006) made use of long-slit spectra. Studying the spatial distribution of PAH within the nuclear regions of starbursts was not possible in those observations and has remained challenging due to the required angular resolution. Among the few studies to date, Tacconi-Garman et al. (2005) found from high-resolution imaging that the 3.3-μm PAH emission globally peaks on central starburst regions, but on smaller scales the correlation is not clear. Other ground-based studies have used PAH features at ∼8.8 or 11 μm to localize starbursts and nuclear activity (Díaz-Santos et al. 2008; Siebenmorgen et al. 2008). Resolving and localizing the 3.3-μm PAH emission from other SF indicators, such as radio and Paα, and peaks of MIR continuum, is important to be able to minimize uncertainties regarding whether PAHs are destroyed only by AGN or also by young SF regions (see e.g. Mason et al. 2007). The detailed relationship between circumnuclear SF and PAH emission is still unclear.
Integral field spectroscopy provides significant advantages especially for disturbed, compact systems, providing spatially resolved spectral coverage over a limited field of view. Long-slit observations, in contrast, will miss any emission outside of the narrow slit, while the use of narrow-band imaging is limited by the fact that there are often no suitable filters in existence for redshifted PAH features. The power of IR integral field unit (IFU) observations for ULIRGs has been demonstrated by, e.g., Reunanen, Tacconi-Garman & Ivanov (2007) and Arribas et al. (2008), but so far only at H and K bands. In this paper, we present new L-band IFU spectroscopy of the nucleus of the LIRG NGC 1614. NGC 1614 is considered a ‘laboratory’ (Alonso-Herrero et al. 2001) for studying nuclear starbursts with its extremely strong nuclear IR emission and signs of recent interactions and advanced merging activity, as well as possible nuclear activity. It is an ideal target to study the physical details of the gas-rich galaxies transforming into QSOs and ellipticals via (U)LIRGs and obscured AGN. Our data allow us to study the spatial distribution of the PAH emission, to investigate its relation to the SF regions, and to separate out potential contributions from an AGN nucleus at high spatial resolution.
2 NGC 1614
NGC 1614 is an LIRG with an IR luminosity of log L/L⊙= 11.6 at a distance of 64 Mpc (redshift z= 0.016). Optically it is classified as a borderline case between a low-ionization nuclear emission region (LINER) and H ii-dominated galaxy (Bushouse 1986; Veilleux et al. 1995), and Yuan et al. (2010) classify it as a composite starburst + AGN. Morphologically, the galaxy is barred and interacting (e.g. de Vaucouleurs, de Vaucouleurs & Corwin 1976; Neff et al. 1990); at large scales, it shows strong perturbations indicative of an earlier major interaction, though the appearance has been attributed to a lower mass galaxy too (Neff et al. 1990). While it is optically quite chaotic with long curved asymmetric tail(s) to the east and a 22 kpc linear structure towards south-west, it has two clear inner spiral arms (Fig. 1).
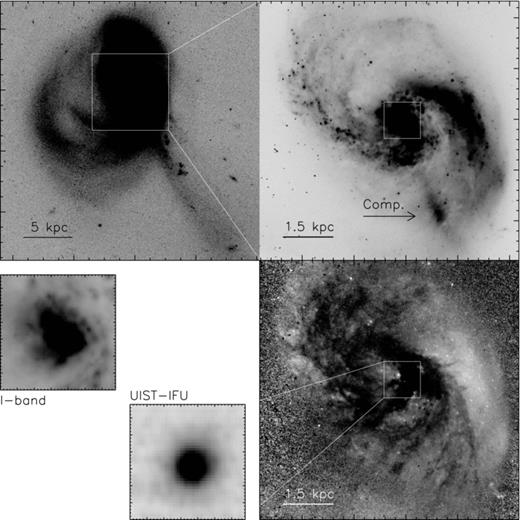
Archival ACS/HST images of NGC 1614. North is up and east is left in each image, the tick marks are 5 arcsec in the top-left image and 1 arcsec in the right-side panels. Top left: an I-band (FW814) image showing the outer structures of NGC 1614 at 20 kpc scales. The white rectangle shows the area of the same image zoomed and rescaled at top right, showing the more regular spiral pattern. The higher surface density structure 9 arcsec south-west of the nucleus is pointed out, which is the likely remnant of a companion galaxy (Section 5.3). The bottom-right panel shows the ACS/HST B−I colour map of the same region as the panel above it, where darker areas mean redder colours, i.e. higher extinction. The main nucleus is seen to lie behind a dust feature, while there is a very blue point source 1 arcsec north-east of the nucleus (see Section 5.2). The innermost 1 kpc area (3.4 × 3.4 arcsec2) is marked with the white rectangles in both right-hand panels and is shown zoomed-in at bottom left. The left one is the I-band image, and at right we show our UIST L-band continuum image of the nuclear region using the same spatial scale.
The central region of NGC 1614 was studied by Heisler et al. (1999) and Kotilainen et al. (2001) using Brγ and H2 observations at Anglo-Australian Telescope and United Kingdom Infrared Telescope (UKIRT), respectively, and by Alonso-Herrero et al. (2001) using Paα emission with the HST Near Infrared Camera and Multi-Object Spectrometer (NICMOS). All found a star-forming ring of ∼600 pc diameter around the nucleus. Recently, Olsson et al. (2010) studied the starburst with multiwavelength submm and radio data. None of these studies found clear evidence of AGN activity in NGC 1614 and the star formation rate (SFR) was estimated to be ∼50 M⊙ yr−1.
H- and K-band observations have been presented by Puxley & Brand (1999) and Spitzer spectroscopy is presented by Bernard-Salas et al. (2009). An Akari 2.5–5 μm spectrum was recently published by Imanishi et al. (2010). In addition, a low-resolution L-band spectrum of NGC 1614 was published by Mizutani, Suto & Maihara (1994). Fig. 4 shows the part of the Spitzer/infrared spectrograph spectrum covering the PAH bands: these data were retrieved from the Spitzer archive and pipeline reduced. The inset shows the Akari spectrum of Imanishi et al. (2010).
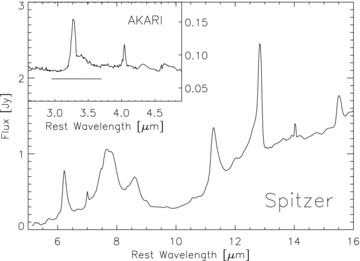
IR spectra of NGC 1614. The large panel shows the Spitzer IRS spectrum, dominated by PAH bands. The inset shows the Akari spectrum (from Imanishi et al. 2010), with a strong 3.3-μm PAH band and a 3.4-μm wing. The wavelengths are in the rest frame (redshift z= 0.016). The horizontal bar below the Akari spectrum shows the spectral range of the IFU observations in this paper (corrected for redshift).
3 OBSERVATIONS
We used the UKIRT 1–5 micron imager spectrometer (UIST) (Ramsay Howat et al. 2004), a 1–5 μm imager-spectrometer with a 1024 × 1024 InSb array, at UKIRT. IFU spectroscopy in the L band was an observing mode unique to UIST; it is not available anywhere else currently. IFU observations with UIST use an image slicing design. The image slicing mirror comprises 18 segments or ‘slices’ that are each 0.24 × 6.00 arcsec2 in size; 14 adjacent slices yield a spatial coverage on the sky of 3.3 × 6.0 arcsec2, with a scale of 0.12 × 0.24 arcsec2 pixel−1. Images (‘channels’) can be extracted for every resolution element of the grism.
The observations were carried out over two nights, 2009 January 6 and 26. We used the short-L grism, which provided a resolution of 700 and a wavelength coverage of 2.905–3.638 μm. Total observing time for the IFU observations was 160 min, half of which was spent on-source and half on-sky; the observations alternated between object and sky observation every 60 s. The second night was affected by some cloud, and an additional sky subtraction using the outer region of the IFU field was required. After this additional step, the two observations agreed very well.
Data reduction was done using orac-dr (Cavanagh et al. 2008), with a pipeline reduction developed at the Joint Astronomy Centre, resulting in wavelength- and flux-calibrated data cubes. Wavelength calibration was done using an arc as there are no suitable telluric emission lines in this wavelength range. A standard star, BS 1543, was observed and used for relative flux calibration. For an absolute flux calibration, the resulting data cubes were scaled to broadly agree with the Akari NGC 1614 spectrum. This constant scaling (reflected in the numerical scales of several figures in this paper) does not in any way affect our results which are all based on relative fluxes and their spatial distribution and equivalent widths (EWs) of spectral features. In addition, an automated script was implemented to perform robust identification and removal of some non-physical ‘artefact’ pixels that were present in the data cubes; the problematic fluxes were replaced with values interpolated from contiguous pixels. The separate data cubes from the two different observations were then aligned spatially, at subpixel resolution, and co-added to yield a single data cube on which all subsequent analyses were carried out.
We also obtained imaging in two filters, nbL (3.379–3.451 μm, overlapping with the grism coverage) and L′ (3.428–4.108 μm, longwards of the spectral coverage). Total exposure times were a few minutes per filter, yielding shallow images only. At the 0.12 arcsec plate scale, total field of view is about 1 arcmin. We do not use these data further, except to note that the nucleus is detected in both images, and clearly is the only significant source of L-band emission in NGC 1614. This is confirmed from archival Spitzer imaging as well, where we measure nearly half of the total NGC 1614 broad-band 3.6-μm flux as originating from inside a 2 arcsec aperture radius.
4 RESULTS
4.1 The nuclear source and continuum flux
High-resolution images of the central area were obtained from the IFU data, by summing over selected channels from the spectroscopic data cube. The continuum image in Fig. 2 was created by summing all 1024 channels, except for channels 600–700 and 750–850 corresponding to the redshifted 3.3- and 3.4-μm features: it confirms the dominance of a central source. The bright source has a full width at half-maximum (FWHM) of 0.42 arcsec. The seeing was determined from the IFU data of the standard star: an FWHM of 0.33 arcsec was obtained. This indicates the central source is marginally resolved, with a deconvolved FWHM of 0.26 arcsec, or 80 pc. The HST NICMOS J- and H-band images (Alonso-Herrero et al. 2001) show a more compact central source, slightly resolved at 0.10 arcsec deconvolved.
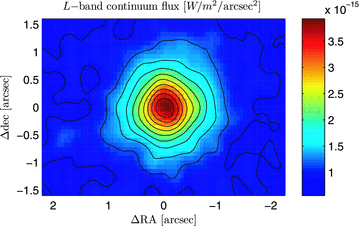
The L-band continuum map of NGC 1614: the integrated UIST image obtained by summing over all channels excluding those around the PAH emission features.
Our IFU data L-band continuum source is defined as the nucleus of the galaxy here, and all maps and radial plots henceforth are with respect to this point. Also, when comparing to other data, as for example the NICMOS data above, maps are aligned using the position of the continuum source.
4.2 The spectrum and maps of the central region
Spectra of different observed regions of NGC 1614 were obtained from the IFU data by integrating each channel within specified apertures or annuli. The spectrum of the central region, a circular aperture of 2.25 arcsec radius, is shown in the top panel of Fig. 3. A prominent 3.3-μm PAH feature (C–H stretching vibration), a weaker 3.4-μm PAH band and an otherwise flat continuum are evident. The middle panel of Fig. 3 shows the IFU spectrum summed up in the innermost nuclear region only, and the bottom panel in an annulus around the nucleus. The notable difference is in the relative strength of the PAH features, though it is significant that there still nevertheless is unmistakable PAH emission right in the core of NGC 1614, within the central 80 pc (middle panel), in the smallest independent spatial resolution element of our data.
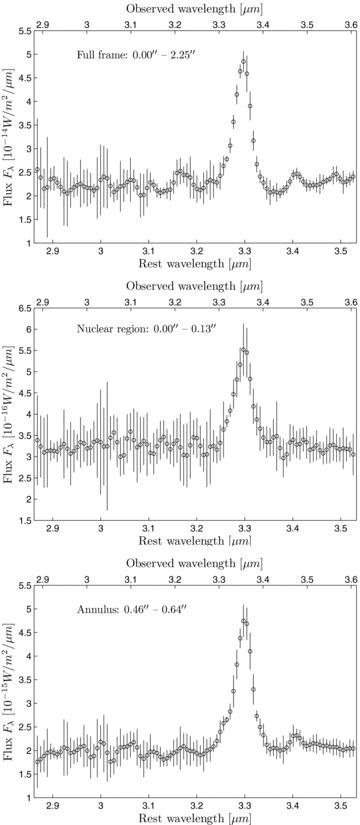
Top: the integrated spectrum over a circular region with radius 2.25 arcsec centred on the continuum source. Middle: the same, but corresponding only to the inner r= 0.13 arcsec region. Bottom: the same, but integrated over an annulus corresponding to the strongest PAH emission.
The Spitzer and Akari spectra are shown for comparison in Fig. 4. They show strong PAH bands, superposed on a dust continuum longwards of 10 μm, but a flat continuum shortwards of 6 μm. Hydrogen emission lines, especially Brγ at 4.08 μm, and [Ar ii] 6.99 μm are also visible. The space-based spectra were obtained in larger apertures than our IFU area; the slit width is 3.7 arcsec for the shortest wavelengths in the Spitzer data, while the Akari spectrum is taken with an unspecified aperture from slitless spectroscopy in a 1 × 1 arcmin2 field of view (see Imanishi et al. 2010).
The IFU spectrum has considerably higher spectral resolution than the Akari data. Comparing the two spectra shows general agreement in shape, but for one notable difference. In the Akari spectrum (Fig. 4, inset), there is a broad plateau redwards of the PAH feature, stretching from 3.35 to 3.45 μm. In the IFU spectrum (Fig. 3, top panel), the plateau is absent and instead there is a narrower band between 3.37 and 3.42 μm, well separated from the PAH feature. The difference is most likely due to the difference in spectral resolution, the gap between the bands being lost at the resolution of Akari. The line-to-continuum ratio at 3.3 μm is similar, ∼2.2, in both spectra in spite of the lower resolution of the Akari spectrum. This might indicate that the latter may include some additional PAH emission within its much larger aperture.
The IFU data were used to create separate image maps for the 3.3 and 3.4-μm PAH bands. The continuum was subtracted from these to produce band-only images, and finally the band-only images were divided by the continuum in order to also obtain EW maps. The 3.3-μm PAH flux map in Fig. 5, top panel, shows the uneven spatial distribution of the PAH emission. The lower panels show the resulting EW maps for both bands; in the case of the 3.4-μm feature, the PAH emission is adequately detectable only in EW. These maps clearly trace the strongest PAH emission in a ring-like structure around the nucleus, which itself is strongly continuum dominated (Fig. 2).
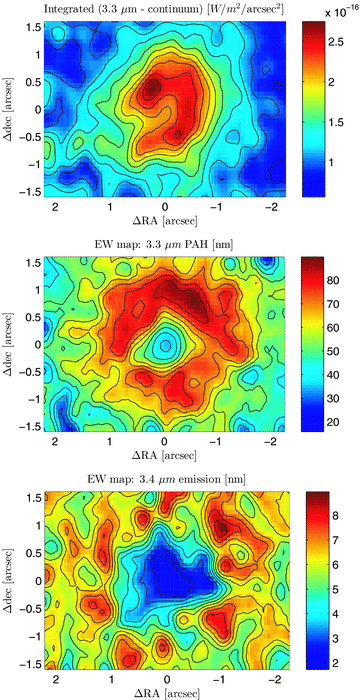
Top: map of the 3.3-μm PAH emission flux obtained by summing over the feature and subtracting the continuum. Middle and bottom: EW maps of the 3.3 and 3.4-μm PAH emission features, respectively, obtained by summing over the feature, subtracting the continuum, and dividing by the continuum.
Defining, arbitrarily, the PAH ring by the points where the 3.3-μm EW is within 20 per cent the maximum, the inner radius is at about 0.6 arcsec radial distance from the nucleus, and has an angular thickness of 1.1 arcsec. These translate to inner and outer radii of 200 and 550 pc, with the peak of the EW at approximately 250 pc radius.
4.3 Radial dependencies and comparison with a star formation ring
Fig. 6 shows the 3.3-μm PAH EW overplotted with archival NICMOS Paα emission (Alonso-Herrero et al. 2001) and with radio continuum of the NGC 1614 nuclear regions from Olsson et al. (2010). The radio continuum and the Paα trace each other remarkably well, while the PAH EW appears to peak slightly further out. If the contours are overplotted on the PAH flux, the peaks of the distributions are closer (Fig. 7). The maps also suggest that the weakest PAH flux at the opening of the horseshoe shape south-east of the centre might correlate with the strongest Paα and to a lesser extent with the radio emission.
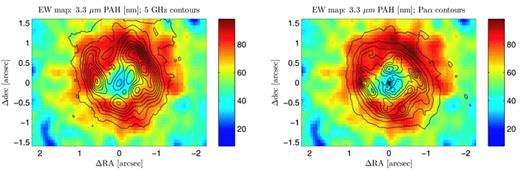
The radio and Paα emission is shown with linearly spaced contours overlaid on the 3.3-μm PAH EW map.

The radio and Paα emission is shown with linearly spaced contours overlaid on the 3.3-μm PAH map.
To quantify the appearance of the different radial distributions of the ‘rings’, Fig. 8 shows the azimuthally averaged 3.3-μm PAH EW as well as the 3.3 PAH flux as a function of radial distance from the core. We also plot the radial dependence of the Paα flux measured from the archival NICMOS image showing an identical distribution with that presented in Alonso-Herrero et al. (2001). The PAH flux and the Paα peak at 0.5 arcsec (150 pc), while the PAH EW peaks at ∼0.8 arcsec (250 pc) from the core. Note also that there is significant PAH flux in the core regions, while it weakens there in terms of EW, and the Paα shows a definite hole in the middle. The spatial resolution of the data are slightly different, but even convolving the Paα distribution with the UIST 0.3 arcsec point spread function does not change the result.
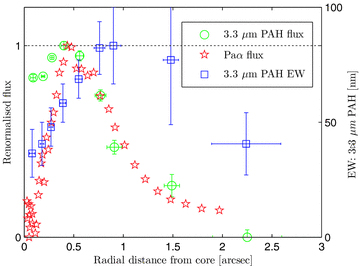
The EW of the 3.3 PAH, the PAH feature flux and Paα flux shown as a function of radius. Each profile is normalized to unity. However, the actual values of the 3.3 PAH EW can be read from the right-side axis.
4.4 The PAH features
PAH molecules show features over a range of wavelengths from 3.3 to 19 μm. The longer wavelength bands are covered by Spitzer (Fig. 4) extracted using a larger aperture. The UKIRT observations indicate that only the core region contributed significantly, and we will therefore assume that the UKIRT and Spitzer PAH bands arise in the same location.
A detailed discussion of PAH emission can be found in Tielens (2008). PAH emission sources are classified into three classes, based on wavelengths especially of the C–C bands. Class A corresponds to PAH bands seen in the interstellar medium (ISM), in gas illuminated by nearby stars or ionized regions, while class B is seen in circumstellar material, with class A possibly occurring at hotter temperatures (Keller et al. 2008). The short wavelength peak at 6.2 μm in NGC 1614 indicates class A PAH. However, the 8-μm band in NGC 1614 shows two equal peaks at the class A and B wavelengths. The PAH emission in NGC 1614 thus traces ISM gas in a relatively hot radiation field but there may also be a component in a more subdued radiation field. Notable is the strong 12.7-μm band which exceeds the 11.2-μm band strength. This is a characteristic of ISM PAHs which are more irregular/ragged, and indicative of regions of massive SF. The 6.2/11.2 band strength ratio indicates that the PAHs are mostly neutral (Galliano et al. 2008), and this is also indicated by the strength of the 12.7-μm band. In fact, neutral PAHs are much stronger at 3.3 μm than are ionized PAH, and the UKIRT observations would be insensitive to ionized PAHs. The 3.4-μm band is attributed to an aliphatic C–H stretch, which may be related to partial PAH destruction.
5 DISCUSSION
5.1 The nucleus
The NGC 1614 nucleus has a very high luminosity of MH and MK∼−23 to −23.5 mag within the central 0.7 arcsec (Alonso-Herrero et al. 2001). Consistently, we measure approximately ML∼−24 from the infrared array camera (IRAC) 3.6-μm image for the central source. The V−H (Vega) colour is approximately 4.5 mag in the same aperture, using the optical HST images. The extinction at the core region is estimated at roughly AK∼ 0.3–0.4 (see e.g. Alonso-Herrero et al. 2001, and Section 5.4 below). We ran SB99 models (Leitherer et al. 1999) with normal Salpeter initial mass function between 1 and 120 M⊙ and solar metallicity, and found that with the assumed extinction, the core is consistent with a 100–200 Myr age single stellar population and a mass of ∼1 × 10⁹ M⊙, though of course multiple populations are likely in reality, including younger ones. Nevertheless, the lack of recent strong SF indicators (radio, Brγ, Paα) in the core consistently suggests it no longer contains ionizing O/B stars, and therefore has not participated in a starburst over the last 50–100 Myr. The dynamical mass of the nucleus in the central 1–2 arcsec area has been estimated to be in the range 1–2 × 10⁹ M⊙ (Puxley & Brand 1999; Alonso-Herrero et al. 2001; Olsson et al. 2010). Mass determined from and related to recent SF is more model-dependent, but is also close to 1 × 10⁹ M⊙ (Kotilainen et al. 2001). All these values are in good agreement with our crude estimate above. The deconvolved size obtained from the HST NICMOS images is less than 0.1 arcsec, indicating a radius less than 15 pc. Our L-band continuum data suggest that there is an additional, slightly more extended component to the nucleus, possibly a result of a radially differentiated stellar population and/or dust distribution – it is not possible to investigate this further with the present data, however.
The mass of the core component places it well above that of typical nuclear star clusters (NC) in spiral galaxies, which range from 106 to 108 M⊙, while the size appears to be a factor of ∼2 larger than a typical NC (Böker et al. 2002; Rossa et al. 2006). However, the subtraction of an underlying bulge light is very difficult, and hence we would not definitively rule out a ‘nuclear cluster’ classification, and prefer to talk more loosely about a ‘core’ here. Within a larger aperture of 100–200 pc, the magnitude and colour of the NGC 1614 core are in fact well within the range measured in the same aperture for nearby merger remnants from NICMOS imaging (Rossa et al. 2007). The large mass and blue colour of the NGC 1614 nucleus would be indicative of a well-advanced interaction/merger.
5.2 Second nucleus?
There have been several reports of a double nucleus in this galaxy, dating back to Keto et al. (1992), which was based on a deconvolved 12-μm image. Alonso-Herrero et al. (2001) found a secondary point source (different from the Keto source) 0.9 arcsec north-east of the nucleus, and suggest it is a secondary nucleus, potentially the remnant of a companion galaxy.
The secondary source of Alonso-Herrero et al. (2001) is visible in all available HST images just a little outside of the star-forming ring in the area of the PAH emission found in this work. It is unresolved, and much bluer than the IR nucleus itself. At 1.6 μm, it has become faint. Its V−H colour is ∼0.6, some 4 mag bluer than that of the main nucleus, while still being an intrinsically bright source of MH∼−18. The newer archival ACS data show B−I∼ 0.5. This secondary source is within the UIST field of view but is not visible in the data, confirming its blue colour and indicating low extinction. Using the same SB99 single stellar population model as in the previous section, we constrain the age of the blue point source to be less than 10 Myr in the absence of any extinction. With even small dust extinction its age would only be several million years. Given the large number of star clusters in this system elsewhere, the most likely explanation for this source is a young star cluster, in fact the brightest one in NGC 1614, and probably lying in the foreground in relation to most of the nuclear dust and gas. The MIR image from Keto et al. (1992) showed two components 0.6 arcsec apart. Given the spatial resolution and the used 12-μm filter which combines PAH and continuum emission, this image may show the central (continuum) core with an emission peak in the PAH ring (see Fig. 5). Our UIST data and new archival HST/ACS data therefore do not provide evidence for a double nucleus in the central region of this galaxy.
5.3 Companion galaxy
Instead of the double nucleus scenario, we propose rather that the companion galaxy (remnant) involved in the NGC 1614 system interaction lies within the conspicuous linear tail extending more than 20 kpc south from the central regions (Fig. 1, upper right panel). In this picture, the whole linear tidal tail would be the edge-on remains of a precursor disc galaxy.
The archival HST images show a smooth elongated region resembling a dwarf galaxy, or a stretched-out bulge, with a bright stellar cluster at its centre some 10 arcsec (3 kpc) from the galactic nucleus along the linear tail. This structure clearly stands out from its surroundings and is perpendicular to the underlying major spiral arms, and Neff et al. (1990) note the discrepancy between its kinematic structure and the rest of the system. The feature is outside the field-of-view (FOV) of the near-IR (NIR) images, but we determined from the archival ACS images that the cluster has a magnitude of MI∼−14 mag, and a B−I colour of approximately 1.8. An elliptical aperture of 2 × 4 arcsec (0.6 × 1.2 kpc) extracted around the feature, against the backdrop of the tidal tail, gives MI∼−17 mag, while the colour of the feature is similar to that of the cluster. The colours of both the cluster and the extended feature as a whole suggest evolved stellar populations. The cluster is of typical spiral NC size and luminosity, strengthening the idea that this knot would in reality be the remnant of a spiral galaxy responsible for the tidal features of NGC 1614. It is impossible to estimate the original mass of the secondary galaxy from the available data, but its extracted ‘bulge’ flux is only a few per cent of the primary nucleus. Because of the presence of a young starburst in the primary nucleus, the I-band light cannot be trusted to give any reliable indication of the stellar mass ratio, however.
A plausible scenario according to dynamical simulations including stellar, gas and dark matter dynamics and SF and various feedback processes (Johansson, Burket & Naab 2009b; Johansson, private communication) would be that of a merger with a mass ratio in the range ∼5:1–3:1, where the smaller galaxy, seen edge on, has initially passed the primary component producing the largest scale tidal tails. This interpretation is supported by the fact that we see strong tidal features, and the companion galaxy appears to have a significantly lower mass: the observed phase would be ∼50 Myr after the second passage, which has triggered the strongest nuclear starburst, and the minor component has lost most of its stellar mass, and its rotationally supported former disc stars have formed the linear tail. The bulge region of the companion with its deeper potential well is more intact and is falling towards the primary nucleus for the third time to merge in another 100 Myr or so. Exact time-scales are dependent on geometry and gas fractions. A detailed specific simulation is beyond the scope of this paper, and in addition observational velocity data would be required to constrain the details in the numerical simulation. An interesting detail would be to find out what size and what kind of a companion could simultaneously trigger LIRG activity and tidal tails at this level and leave so little evidence of itself. Simulations do not predict significant SFR elevation in mergers beyond ∼5:1 mass ratios (e.g. Cox et al. 2008; Johansson et al. 2009a). And intriguing would be an investigation of the SMBH which would be expected to be growing already in the centre with more material falling there as the interaction progresses.
5.4 The missing AGN
AGNs give rise to a strong, inverted continuum in the L band. The L-band continuum emission from an AGN is a factor of 100 stronger than that of a starburst (Risaliti et al. 2006): an AGN dominates the L-band continuum, even when its contribution to the bolometric luminosity is relatively minor (Imanishi & Dudley 2000; Sani et al. 2008). Starbursts in turn yield strong 3.3-μm PAH emission (C–H stretching vibration), related to UV radiation and shocks, while AGNs destroy PAH molecules through their X-ray emission (Voit 1992) unless shielded by significant dust and molecular clouds. Thus, the PAH EW distinguishes starburst regions from AGN-dominated regions (e.g. Imanishi et al. 2006) even with a strong AGN dominance in the continuum. The cool dense gas around an AGN can show a 3.4-μm absorption feature, due to aliphatic hydrocarbons, and if shielded molecular clouds are present, also a 3.1-μm ice band. No other single spectral region combines such diverse tracers, and the L-band IFU data used here are therefore ideal for SF versus AGN studies.
The debate about the existence of an AGN in NGC 1614 has remained inconclusive in the literature. Risaliti et al. (2000) detect an X-ray source in the centre of NGC 1614, the spectrum of which they interpret as being obscured by Compton-thick gas. Olsson et al. (2010) point out that this detection could also be explained by low-mass X-ray binaries; their own radio data meanwhile show a weak central radio source which could in principle be due to AGN activity.
The lack of any significant AGN detection can in principle be either because of very low luminosity or because of extreme obscuration. Risaliti et al. (2006), however, argue that even a 1 per cent bolometric contribution from an unobscured AGN would be clear in the L-band continuum. L-band spectra can contain three diagnostics of AGN activity: weak 3.3-μm emission, 3.4-μm absorption and/or a rising continuum. None of these is found in our data of NGC 1614. The PAH band is strong, albeit weaker towards the central IR core. The continuum is flat, and the 3.4-μm band is in emission in the star-forming ring, and absent elsewhere (see Section 4.2).
More quantitatively, when the L-band continuum is parametrized with its spectral index fλ∼λΓ (see Risaliti et al. 2006), obscured AGN lie at Γ > 1.5, i.e. the continuum is significantly reddened. Starbursts and unobscured AGN both have lower Γ, typically in between −1 and 1. Furthermore, starbursts and unobscured AGN can be differentiated by high versus low EW3.3 values, respectively, where the dividing line is close to EW3.3∼ 75 nm. The EW of the 3.3 PAH feature in our data over the whole FOV is EW3.3∼ 60 ± 12 nm, and the shape of the continuum Γ= 0.31 ± 0.19. The Γ value places NGC 1614 far away from the obscured AGN, but the 3.3-μm EW is close to the dividing line of starbursts and unobscured AGN. Risaliti, Imanishi & Sani (2010) note that many LINERs are found in this region of the diagnostic. Akari spectroscopy (Imanishi et al. 2010) gives a somewhat larger EW3.3∼ 120 in a much larger aperture, while the continuum slope is the same as in our widest aperture. The PAH EW as a function of radial distance from the core is shown in Fig. 8, and the continuum parameter in Fig. 9: it is the nucleus which gives AGN-like EW values, counteracting the more starburst-like values from the PAH ring. In fact, regarding only the <0.3 arcsec aperture in the centre, these conventional L-band parameters would place the NGC 1614 in the unobscured AGN regime.
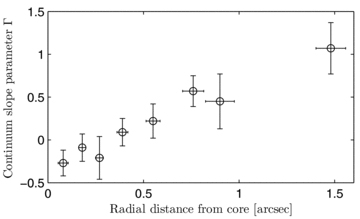
The L-band continuum shape parameter Γ as a function of radius.
Extreme obscuration does not appear to be the cause of lack of an AGN signature in our L-band data, consistent also with the non-detection of any 3.4-μm absorption. Additionally, this is consistent with extinction estimates for NGC 1614 in the literature, where derivations using NIR lines (Puxley & Brand 1999; Alonso-Herrero et al. 2001; Kotilainen et al. 2001) estimate AK < 1 for the whole central region, and in fact closer to AK∼ 0.4 right at the centre. The Spitzer IRS spectrum potentially probes deeper into the NGC 1614 core, albeit with a much lower spatial resolution. First, the strength of the silicate absorption feature can be parametrized as SSil= ln (F9.7, cont/F9.7, abs) and we find a value of ∼−0.4, which together with the continuum levels at 14 and 30 μm translates to a likely nuclear extinction of AV∼ 15–20 (Levenson et al. 2007), i.e. AK∼ 2 or AL∼ 1, which is quite modest compared to most ULIRG nuclei. Secondly, starburst versus AGN diagnostics such as [Ne v]/[Ne ii] (∼0.04), [Ne iii]/[Ne ii] (∼0.2) and EW6.2 (∼ 0.5 μm) relative to the strength of the silicate feature SSil∼−0.4 all indicate pure starburst values, similar to e.g. M82 (e.g. Farrah et al. 2007; Spoon et al. 2007).
If indeed there was Compton-thick gas of column density log NH > 24 obscuring an AGN, it would indicate, using standard gas-to-dust conversions, nuclear extinctions of AK > 40. PAHs in the NGC 1614 nuclear regions can co-exist there with an AGN, if e.g. simultaneously mixed and shielded with a thick dusty (unresolved) torus (Watabe et al. 2008). However, in this case we should see the Γ parameter rise, or at least flatten, towards the centre since we can isolate a ∼30 pc region in the centre. There is not even a hint of this (Fig. 9), nor any signs of extreme dust extinction within the resolvable area, and we thus conclude that an obscured AGN is definitely ruled out in NGC 1614.
The final option, in principle, would then be that there is an unobscured AGN in the centre. It would have to be very weak, however, given the non-detection of such in the X-rays. Furthermore, while the EW of the PAH emission is weaker in the centre, some PAH flux is nevertheless detected throughout the nuclear region (Fig. 5). An unobscured AGN would be expected to destroy the PAH carriers at least within the central kpc. Instead, it is much more plausible that the weakened EW3.3 is due to the central starburst (see Section 5.5.2).
From the point of view of the typical ULIRG to QSO to elliptical evolutionary sequence, it is somewhat surprising that a strong LIRG at an advanced merger stage does not show any signs of an AGN. Gas-rich mergers such as NGC 1614 are expected to produce both high SFRs and the most rapidly growing SMBHs (Johansson et al. 2009 a,b). As discussed in the previous section, we appear to be dealing with a case of a well-advanced major merger in the 3:1 to 5:1 mass ratio range. Another interesting question for a future simulation would thus be an investigation into why an SMBH does not activate, while simultaneously producing a nuclear starburst and tidal features typical of major mergers.
5.5 The starburst ring in NGC 1614
5.5.1 Ring stratification
Circumnuclear star-forming rings (or tightly wound spiral arms) are a common feature of barred spiral galaxies (e.g. Böker et al. 2008). They are found in similar proportions in both starbursts and Seyfert galaxies with an SF contribution (Kotilainen et al. 2000). The rings appear to be related to the presence of dynamical resonances with the bars, with gas accumulating at the inner Lindblad resonance, typically at about 1-kpc radius from the centre, and experiencing a starburst through collision of molecular clouds or through gravitational collapse. Examples of recent studies of such rings are found in e.g. Beck, Lacy & Turner (2010), Reunanen, Prieto & Siebenmorgen (2010) and Hsieh et al. (2011). On the other hand, SF rings might be a result of a ‘classic’ nuclear starburst propagating outward, where the nuclear regions have been left devoid of most gas. These strong nuclear starbursts are expected to result in interactions and mergers, even minor mergers (e.g. Mihos & Hernquist 1994).
Though there are many long-slit spectroscopic studies of galactic nuclei in the 3.3-μm PAH band (recently e.g. Imanishi, Dudley & Maloney 2006; Risaliti et al. 2006; Oi, Imanishi & Imase 2010), studies with full spatial information of the 3.3 μm PAH emission in the central regions of galaxies are not common. Cutri et al. (1984) and Mazzarella et al. (1994) find a hint of a ring-like structure around the Seyfert 1 nucleus of NGC 7469 in narrow-band 3.3-μm imaging, while Tacconi-Garman et al. (2005) study two nearby starbursts NGC 253 and 1808 and note the PAH feature to peak around the strongest SF regions. The nuclear 3.3-μm PAH ring found and characterized in this work with IFU data in NGC 1614 is by far the highest signal-to-noise ratio detection of a ring feature at this wavelength around a major galaxy nucleus. Below we discuss this PAH ring in NGC 1614 to further characterize the ring structure and SF in the galaxy’s nuclear region.
The circumnuclear star-forming ring in NGC 1614 was discovered by Heisler et al. (1999), Alonso-Herrero et al. (2001) and Kotilainen et al. (2001), in Brγ, Paα and NIR extinction, respectively. Olsson et al. (2010) found it in radio continuum. The presence of radio continuum and hydrogen line emission shows that the gas is ionized, and forms one, or a clustering of, H ii regions, confirming ongoing or recent SF. The ring in NGC 1614 is smaller than usual, however, at 150 pc radius. There is also no clear evidence for a bar (though see Olsson et al. 2010). Instead, the ring seems more similar to those found in ULIRGs (Downes & Solomon 1998) which range in radius from 300 to 900 pc, and exist in apparently chaotic surroundings.
The Brγ emission in the nuclear regions of NGC 1614 comes from the inner edge of the extinction ring (Kotilainen et al. 2001), and Alonso-Herrero et al. (2001) show that the Paα emission peaks slightly inside of the long-slit detected H2 warm gas distribution. A similar case where SF is happening on the inside of a dense molecular ring of gas is found by Combes et al. (2004) in NGC 7217.
In Section 4.3 and Fig. 8, we showed that the radio and Paα emission peak just inwards of the PAH emission found in this work, leading to the picture of a stratified structure of gas. All this strongly suggests that the SF in the nuclear regions of NGC 1614 occurs at the inner edge of the gas distribution, i.e. the majority of the dense gas trapping the photodissociation region is located outward.
5.5.2 Propagation of star formation in the ring
Olsson et al. (2010) present a model where the SF ring is a dynamical resonance region – the SF is tracing the leading edge of a bar, and gas piles up at the ring location. Another inner bar, suggested by the radio data, would further funnel gas into the centre as well. This scenario might be expected in a traditional bar-driven spiral nucleus, though minor mergers may also trigger inner rings (Eliche-Moral et al. 2011). In contrast, Alonso-Herrero et al. (2001) suggested a nuclear starburst scenario, which is often associated with major mergers and interactions. In this case, the SF would propagate from the centre outwards into the molecular gas seen as the J−H extinction shadow and H2 distribution (also Kotilainen et al. 2001). The derived ages from NIR spectroscopy of the starburst support this; they find a best fit with a double-peak starburst with the older (>10 Myr) starburst in the centre and the younger (5–8 Myr) starburst possibly in the ring. Olsson et al. (2010) agree with these values based on radio spectral indices; however, they propose, based on their CO data, that the extinction shadow is not a ring at all, but is due to an off-centre foreground dust lane, north-west of the nucleus. Based on the velocity structure of their CO data, they further speculate on the existence of a nuclear (decoupled) north–south bar in the nucleus, which would be responsible for funnelling gas to the central starburst. The PAH ring discovered in this work, however, is very consistent with the positioning of the previous NIR-detected SF ring and its stratified structure. The differences between the CO and NIR structures could rather indicate the different distributions of the warm molecular gas and the cool gas. Also, neither our UIST data nor the ACS B- and I-band images hint at an inner bar, though the complicated dust structures in the nucleus (see Fig. 1) would in any event make interpretations difficult.
Tacconi-Garman et al. (2005) show evidence that the 3.3-μm PAH feature-to-continuum ratio (essentially EW) is high around strong SF such as super star clusters and nuclei, but is low specifically at those strong SF locations. This is totally consistent with what we see here: strong EW of PAH in a ring just outside of the SF ring. The PAH EW could be weak either because of destruction of the carriers or because of dilution of the feature by a strong continuum. The actual weakening of the PAH signal, in contrast to dilution by continuum light, could be through either photoionization or photodissociation of the PAH molecules in a sufficiently intense radiation field, or through mechanical energy input via stellar winds and supernovae (see e.g. Tacconi-Garman et al. 2005; Mason et al. 2007; Lebouteiller et al. 2011, and references therein)
Meanwhile, Díaz-Santos et al. (2008) find that the youngest H ii regions in their sample of several LIRGs show the lowest 8- and 11.3-μm PAH contributions; specifically, they find that the PAH-to-Pα ratios grow with the age of the PAH-emitting region. In fact, their sample includes NGC 1614, and the Pα ring is seen to correspond to an annular ‘hole’ in an 8μm/Paα map. Their data do not go far enough in radial distance to detect the PAH ring we see in our data. Fig. 8 shows that the PAH flux to Paα ratio (ratio of green circles to red stars in the plot) has a wide minimum at the SF ring radius from about 0.4 to 0.8 arcsec. Interestingly, the ratio rises very rapidly at the inner edge of the SF ring towards the core, consistent with older SF. The PAH EW drops there as well, while on the outward side of the ring the EW keeps rising, reaching its peak only at the outer edge of the SF ring. How to reconcile these observations? First, Díaz-Santos et al. (2010) suggest a correlation with the mass of the starburst region in a sense that lower participating masses (i.e. the outer, plausibly less dense regions of the molecular gas ring) at a given age increase the measured strength of the PAH. More significantly, Beirão et al. (2009) find that H2 emission in Arp 143 traces a shock wave region outside of the nucleus, with the very youngest (2–4 Myr) SF knots corresponding to significant 8-μm PAH emission, while the older (7–8 Myr) SF knots are more devoid of PAH. Could these very young regions correspond to our PAH EW ring just outward of the SF ring? It is plausible, and could in fact be checked with an age and mass modelling study of the numerous super star clusters (SSCs) found in the nuclear regions in the archival HST data; such a study is, however, beyond the scope of this work. Nevertheless, the location of the PAH ring found in our UKIRT IFU data appears to fit very well the scenario of an outward propagating starburst.
Returning to the MIR emission in the very core of NGC 1614, all indicators show that the starburst population there is older (Section 5.1). The nucleus appears to be surrounded by a hole, or at least a depression, in the ISM, as shown by the decreasing extinction towards the inner regions (Kotilainen et al. 2001) and the weakening of the PAH emission inside of the SF ring. A recent starburst in the nucleus could have evacuated the inner regions through mechanical energy due to stellar winds and supernova eruptions. This event has likely happened 20–100 Myr ago, given the lack of current SF in the core, as well as the best-fitting ages of the modelled colours and emission lines in the core. There is, nevertheless, PAH emission even over the core region, which could indicate that the PAHs there trace at least partially an older (∼100 Myr time-scale) SF of B-type stars (Peeters, Spoon & Tielens 2004). We note also that the 12.5- and 18-μm warm dust emission in the NGC 1614 core region is spatially extended in an ∼2 arcsec diameter region (Soifer et al. 2001; Imanishi et al. 2011), i.e. similar in extent than the 3.3-μm PAH flux seen in Figs 7 and 8.
A consistent picture thus emerges: viz., one where the nucleus has experienced a starburst more than 10 Myr ago, perhaps several such episodes, resulting in a mixed stellar population, and a depletion of PAHs and ISM in the central 100-pc radius. The timing of the second passage of the secondary companion ∼50 Myr ago discussed in Section 5.3 is consistent with this time-scale. The starburst is propagating outwards, and the strongest current SF is happening in the Brγ, Paα and radio continuum detected star-forming ring between 120 and 240 pc, where the PAH carriers are also being destroyed. The detection of a high-EW PAH region just outside of this SF ring at 200–550 pc radius, overlapping with a distribution of H2 gas, is consistent with the starburst being currently expanding into this ring of the densest molecular gas. We speculate that the PAH ring thus traces the region in the system with the most recent SF, possibly a shock front. Major galactic scale winds would be expected in a case like this. Indeed, the detection of significant outflowing cool gas, seen as a 150 km s−1 blueshifted NaD component from the nucleus of NGC 1614 (Schwartz & Martin 2004), supports the scenario – in fact, a redshifted infalling component is detected as well, and the decoupling of cool and warm gas flows, highlighting the fact that NGC 1614 is a complex interaction/merger case.
Finally, we note that in NGC 1614, PAH emission in the 3.3-μm band is detected in a ‘wide’ area in and around the nucleus. PAH emission is found at the very core, in the strongest SF ring, as well as outside it. The PAH emission does not trace only the most massive SF, but rather a variety of levels of SF, the EW of the PAH outside of the SF ring possibly detecting SF levels not reached by other SF indicators. The spread out nature of the PAH emission within different kinds of nuclear components indicates that the PAH carriers are quite mixed within the obscuring material, rather than tracing for example only the densest obscured SF regions – this result was recently found by Zakamska (2010) to apply for ULIRGs in general.
5.6 Future of MIR IFU
IFU studies in the MIR have great relevance for starburst and AGN studies, where various emission and absorption features can be used effectively to differentiate between different excitation and heating mechanisms and physical sources of energy. Lack of spatial information, however, means that one is often forced to analyse and attempt to decompose integrated signals. This work shows the importance of simultaneously obtaining spectral and spatial information to disentangle physical processes in the cores of galaxies from those happening in the close vicinity. Sadly, there currently exists no instrument to perform spectral and spatial L-band studies; UIST was the only available MIR IFU for the astronomical community. However, with the advent of extremely large telescopes (ELTs) and the James Webb Space Telescope (JWST) and associated instruments (e.g. Closs et al. 2008; Kendrew et al. 2010), these observations will once again become possible. And while the current ground-based telescopes can achieve resolutions of ∼0.2 arcsec in the MIR, or ∼20 pc with a few of the closest AGN and starbursts, the ELTs will extend the spatial resolution to well below 10 pc for hundreds of starbursts and AGN. Thus, in the future, one can use these same MIR IFU methods to examine and characterize SF in the putative molecular tori around the central black holes. For example, Oi et al. (2010) and Watabe et al. (2008) advocate that there should be SF in the outer parts of these tori, which themselves shield the dust and PAH carriers from the central engines. Observations to test these suggestions directly are still unreachable with current resolutions.
6 CONCLUSIONS
We have presented new UKIRT/UIST L-band IFU imaging spectroscopy of the central kpc region of the luminous IR galaxy NGC 1614. In particular, we studied the spectral and spatial distribution of the 3.3-μm PAH feature and the related continuum.
The main observational result shows that the EW map of the 3.3-μm PAH feature forms a ring around the central continuum source. This ring peaks at 250 pc radial distance from the core, and extends from around 200 to 500 pc. The 3.3-μm PAH flux, on the other hand, is somewhat more centrally distributed, though it also has a depression at the core.
The strongest PAH emission, as traced by the EW, peaks outside the previously detected SF (radio, Brγ, Paα) ring, while the actual PAH flux is more or less coincident with the SF ring, or slightly inward of it. Unlike the other SF indicators, PAH flux is also detected all the way to the centre in our ∼0.3 arcsec resolution data. The PAH emission appears to trace a variety of levels of SF in the nuclear regions of NGC 1614.
The second main observational result is that we rule out the existence of an obscured AGN in NGC 1614 using spatially resolved L-band SF versus AGN diagnostics. We also find it extremely unlikely that an unobscured AGN would be present, leaving NGC 1614 a pure starburst galaxy.
Using archival HST/ACS data, we argue that the likely remnant of a companion galaxy in the NGC 1614 interaction is not found in the primary nuclear region as previously suggested, but rather approximately 3 kpc from the primary core along the south-west linear tidal tail. Comparing with numerical simulations, we find that the observed system is consistent with a relatively major unequal-mass merger with a mass ratio in the range ∼5:1–3:1. In this scenario, NGC 1614 is observed ∼50 Myr after the second passage and the edge-on secondary is responsible for the long linear tail of the system and has lost most of its mass.
The characteristics of the starburst in the centre (no current SF in the core, strong SF in a ring) and the location and EW characteristics of the PAH we detect, as well as the timing of the likeliest interaction scenario, all fit well a picture of an outward propagating starburst, triggered most probably by the passage of the companion galaxy. The outstanding question is why there are not yet any signs of an AGN in this advanced merger, as might be expected in typical gas-rich spiral to (U)LIRG to QSO/elliptical evolutionary scenario.
Footnotes
ULIRGs are defined as log L/L⊙ > 12.00, and LIRGs as log L/L⊙= 11.00–11.99.
We gratefully acknowledge support and hospitality from the Astronomy Division at the University of Helsinki and the Finnish Centre of Astronomy with ESO at Tuorla Observatory. We thank Peter H. Johansson for helpful comments and discussion regarding dynamical galaxy simulations, and the referee for useful comments. PV acknowledges financial support from the National Research Foundation. JK acknowledges financial support from the Academy of Finland, projects 8107775 and 2600021611. The data reported here were obtained as part of the UKIRT Service Programme; Chris Davis who carried out the observations and provided subsequent support is especially thanked. The United Kingdom Infrared Telescope is operated by the Joint Astronomy Centre on behalf of the Science and Technology Facilities Council of the UK.
REFERENCES
