


Abstract
We use multiwavelength data from the Galaxy And Mass Assembly (GAMA) and Herschel-ATLAS (H-ATLAS) surveys to compare the relationship between various dust obscuration measures in galaxies. We explore the connections between the ultraviolet (UV) spectral slope, β, the Balmer decrement and the far-infrared (FIR) to 150 nm far-ultraviolet (FUV) luminosity ratio. We explore trends with galaxy mass, star formation rate (SFR) and redshift in order to identify possible systematics in these various measures. We reiterate the finding of other authors that there is a large scatter between the Balmer decrement and the β parameter, and that β may be poorly constrained when derived from only two broad passbands in the UV. We also emphasize that FUV-derived SFRs, corrected for dust obscuration using β, will be overestimated unless a modified relation between β and the attenuation factor is used. Even in the optimum case, the resulting SFRs have a significant scatter, well over an order of magnitude. While there is a stronger correlation between the IR-to-FUV luminosity ratio and β parameter than with the Balmer decrement, neither of these correlations are particularly tight, and dust corrections based on β for high-redshift galaxy SFRs must be treated with caution. We conclude with a description of the extent to which the different obscuration measures are consistent with each other as well as the effects of including other galactic properties on these correlations.
1 INTRODUCTION
Dust obscuration in galaxies is a well-recognized and long-studied phenomenon. From the perspective of large galaxy surveys, the primary concern is often how to make suitable corrections for the dust obscuration within the galaxies of interest, in order to establish their intrinsic properties such as star formation rate (SFR) and stellar mass. This has traditionally been accomplished through the use of the Balmer decrement (Osterbrock 1989), a dust-sensitive emission-line ratio that is straightforward to measure in optical spectra. With the advent of ultraviolet (UV) and infrared (IR) satellite telescopes, new approaches to measuring or constraining global galaxy dust properties have been established, with common metrics being the UV spectral slope, β (Meurer, Heckman & Calzetti 1999), and the far-infrared (FIR) to UV luminosity ratio, LFIR/LUV (Bell 2003).
The UV spectral slope, β, has been proposed as a suitable tool for deriving obscuration corrections, in particular for galaxies at high redshift where the Balmer decrement is not easily measurable (e.g. Bouwens et al. 2009), having been shifted to IR wavelengths. The effectiveness of β as an obscuration metric depends on how well the UV slope can be measured (Calzetti, Kinney & Storchi-Bergmann 1994; Kong et al. 2004). This is influenced by factors such as the instrumentation used and associated sampling of the observed UV spectrum, together with the source redshift impacting on the rest-frame UV wavelengths being probed. From recent comparisons of β with other obscuration measures, using samples selected at optical (Wijesinghe et al. 2011) or FIR (Buat et al. 2010) wavelengths, it is apparent that there are significant limitations in the use of the β parameter for making obscuration corrections.
The β parameter was formalized by Meurer et al. (1999) by exploiting the relationship between the ratio of the FIR to the UV fluxes and the UV spectral slope for a sample of 57 starburst galaxies. Meurer et al. (1999) argue that since the FIR flux in starburst galaxies is produced from the UV radiation that is absorbed and reradiated by dust, the FIR-to-UV flux ratio can be used as a measurement of dust absorption. Subsequent work has emphasized that this relationship, originally calibrated for starburst galaxies, does not work so well for the general population of star-forming galaxies (e.g. Bell 2002; Kong et al. 2004; Buat et al. 2005), with typical galaxies deviating from the relationship between β and LFIR/LUV established by Meurer et al. (1999).
This is to be expected, as in quiescent spiral (non-starburst) galaxies both the assumption that the dust emission is solely powered by UV photons and the foreground screen assumption break down. Thus as much as 30 per cent of the dust emission in spiral galaxies is predicted to come from the old stellar populations (Popescu et al. 2011). Furthermore, as shown in Popescu et al. (2011), at least 10 per cent of the dust heating could come from the old stellar population in the bulge, for a typical spiral with a bulge-to-disc ratio of around 0.3. Radiative transfer modelling of the distribution of stars and dust has also shown that the finite exponential disc distribution of stars and dust, as opposed to the foreground screen distribution, could lead to significant differences in the determination of the attenuation of stellar light (Popescu & Tuffs 2004; Tuffs et al. 2004). Not least, spiral galaxies have both a large-scale distribution of stars and dust as well as a clumpy component associated with the star-forming complexes in the spiral arms (Sauvage, Tuffs & Popescu 2005; Popescu & Tuffs 2010). This renders a proper calibration of the β relation to the radiative transfer models challenging. Nevertheless, more empirical approaches have been taken, in the hope to find further parameters for calibrating this relation.
Kong et al. (2004), therefore, point out that the relationship between the IR-to-UV ratio and the UV slope is dependent on the star formation history as well as the dust content, implying that a straightforward application of this relation might not be accurate. They present a modified relation which accounts for the star formation history as well as the dust content. Wijesinghe et al. (2011) and Buat et al. (2010) both find that SFRs derived from the far-UV (FUV) corrected for obscuration using β and the attenuation relation of Meurer et al. (1999) are significantly overestimated. Wijesinghe et al. (2011) propose a revised attenuation relation for β which eliminates this overestimation. Significant scatter, more than an order of magnitude, however, remains between the SFRs inferred using dust corrections based on β compared to those based on the Balmer decrement.
While the use of β is attractive as a measure of dust absorption at high redshift, in practice there are several considerations that need to be taken into account. The main assumption made by Meurer et al. (1999) was that high-redshift galaxies will have similar multiwavelength properties to local starbursts. It is unclear how the intrinsic spectral slope will be affected with increasing redshift, and indeed recent evidence for very blue UV spectral slopes at the highest redshifts (Bouwens et al. 2009, 2010; Bunker et al. 2010) is now being interpreted as evidence potentially for either extremely low metallicity or variations in stellar initial mass function. This opens the question of how much intrinsic variation there is in the underlying UV spectral slope amongst galaxies at progressively lower redshift, in particular if recent suggestions for variation of the stellar initial mass function (Davé 2008; Wilkins, Trentham & Hopkins 2008a; Wilkins et al. 2008b; Meurer et al. 2009; Gunawardhana et al. 2011) are borne out. If there is indeed broad variation in the UV spectral slope, then there needs to be a redshift, or potentially a SFR or other dependence included in the use of β when making obscuration corrections.
To address these issues, we explore the relationships between the FIR luminosity, the UV luminosity, the Balmer decrement and β, all as a function of galaxy mass, SFR and redshift. In Section 2, we describe the data used in this analysis. Section 3 presents an analysis of the β and Balmer decrement relationships, and Section 4 explores different approaches to parametrizing the UV attenuation. Section 5 investigates the relationships between the FIR and FUV luminosities. These measures are discussed and analysed in Section 7, and in Section 8 we summarize our results and conclusions. Throughout, all magnitudes are given in the AB system, and we assume a cosmology with H0 = 70 km s−1 Mpc−1, ΩM = 0.3 and ΩΛ = 0.7.
2 DATA
The Galaxy And Mass Assembly (GAMA)1 survey is a multiwavelength imaging and spectroscopic survey covering ≈144 deg2 of the sky in three 12°× 4° regions (Driver et al. 2009, 2011; Baldry et al. 2010; Robotham et al. 2010; Hill et al. 2011). GAMA provides the redshifts, emission-line measurements and UV/optical/near-IR (NIR) photometry used in this analysis, with spectroscopy from 2dF/AAOmega on the Anglo-Australian Telescope and imaging from GALEX, Sloan Digital Sky Survey (SDSS) and UKIRT Infrared Deep Sky Survey (UKIDSS). The FUV band in the GALEX filter has an effective wavelength of 1528 Å and the near-UV (NUV) band has an effective wavelength of 2271 Å. K-corrections were applied to the observed GALEX UV magnitudes using kcorrect.v4.1.4 (Blanton et al. 2003) to infer the rest-frame magnitude at 1528 Å. The galaxies in this analysis have a GALEX FUV magnitude range of 17.2 < mFUV < 26.8 and a redshift limit of z < 0.35 due to the requirement for Hα to be in the observable spectral range. Stellar masses are calculated for the GAMA galaxies using spectral energy distribution (SED) models based on the ugriz photometry bands (Taylor et al. 2010).
The Herschel2-ATLAS2 (H-ATLAS)3 survey will ultimately observe 550 deg2 of the sky in five bands (100, 160, 250, 350 and  m) detecting ∼200 000 galaxies spanning 0 < z < 4 (Eales et al. 2010). The H-ATLAS Science Demonstration Phase (SDP) field covers an area of ∼4°× 4° centred at α = 09h05m, δ = 00°30′ in the GAMA 9-h field. It was mapped in parallel mode using the PACS (Photodetector Array Camera and Spectrometer; Poglitsch et al. 2010) and SPIRE (Spectral and Photometric Imaging Receiver; Griffin et al. 2010) instruments onboard the Herschel Space Observatory (Pilbratt et al. 2010). The five-band Herschel maps and catalogues for this SDP field are described in Ibar et al. (2010), Pascale et al. (2010) and Rigby et al. (2010). Sources in the >5σ
 m catalogue were matched to the SDSS Data Release 7 (DR7; Abazajian et al. 2009) and thence to GAMA using a likelihood ratio method (Smith et al. 2010), resulting in 2423 250-
 m sources with optical identifications from SDSS to r < 22.4 at >80 per cent reliability. Of these sources, 1050 were found to be in common with the GAMA survey in the ∼12.7 deg2 of overlap. From the reliability values calculated for these objects, we expect to have a 1.9 per cent false identification rate in this sample.
The IR and FUV luminosities that appear independently have also followed the same treatment. The energy balance method of da Cunha, Charlot & Elbaz (2008) is used to derive the IR (dust) luminosity from 3 to 1000  m by fitting to the UV-submillimetre SEDs of the galaxies. A large, stochastic library of stellar and dust emission models was used that includes a wide range of star formation histories, metallicities, dust attenuation, dust temperatures and different contributions by various dust emission components to the total IR emission [polycyclic aromatic hydrocarbons (PAHs), hot mid-IR continuum and dust in thermal equilibrium; full details are given in da Cunha, Charlot & Elbaz 2008]. Throughout, we use the notation LIR to represent the IR luminosity described above. Fig. 1 shows the UV and 250-
 m fluxes, colour coded by the sum of the FUV and IR luminosities, along with lines of constant flux ratio, to illustrate the range of values that this sample probes. The sum of the FUV and IR luminosities are derived from frequency-independent luminosities of these two quantities (units of solar luminosities).
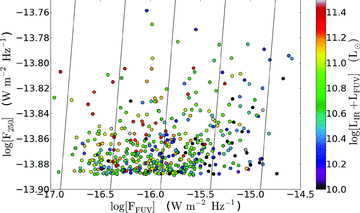
250- m flux compared against the FUV flux, illustrating the flux limits of the GALEX and H-ATLAS measurements in the current analysis. Both quantities are in units of W m−2, and the lines are constant values of log(F250/FFUV). The colour indicates the total of the IR and FUV luminosity.
The data used in the SED fitting include UV photometry from GALEX (Seibert et al., in preparation), optical ugriz from SDSS DR7 (Abazajian et al. 2009), IR YJHK from UKIDSS Large Area Survey (Lawrence et al. 2007), all of which is remeasured from the images in matched apertures defined in the r band by GAMA (Driver et al. 2011; Hill et al. 2011). The optical/NIR fluxes have been point spread function (PSF) matched (Hill et al. 2011), and the UV fluxes were derived using the technique of Robotham & Driver (2011). See Smith et al. (in preparation) for a full description of the implementation of this method to H-ATLAS data.
Of the 1050 GAMA sources detected within the H-ATLAS SDP region, 899 have Hα emission, and 875 have FUV measurements from the GALEX-Medium Imaging Survey (MIS) survey. Of these galaxies, 221 have measurements from both the PACS (σ > 5) and SPIRE instruments on the Herschel telescope, while the rest have only measurements from the SPIRE instrument. Within the GAMA survey, there are 96 231 galaxies with Hα measurements and 104 681 with FUV measurements. Where we show measurements that do not rely on having IR data, we use the full GAMA sample for which Hα emission and UV photometry have been measured, after excluding active galactic nuclei based on spectral emission-line ratio diagnostics (Baldwin et al. 1981; Kewley et al. 2001). Where the IR luminosities are required, we are limited to showing only those within the H-ATLAS SDP region.
3 BALMER DECREMENT AND UV SPECTRAL SLOPE

All Balmer decrements below the Case B value of 2.86 (Osterbrock 1989) were set equal to 2.86 as suggested by Kewley et al. (2006). The application of the Balmer decrement in correcting the Hα luminosities for dust obscuration is described in Wijesinghe et al. (2011), and we use the same method here. In particular, we adopt the obscuration curve of Fischera & Dopita (2005), shown by Wijesinghe et al. (2011) to be the most effective at producing self-consistent SFR estimates simultaneously from FUV, NUV, [O ii] and Hα luminosities.

 and
and  are the mean flux densities per unit wavelength through these filters.
Fig. 2 shows a very weak trend between the Balmer decrement and β, but this is dominated by the remarkably large scatter in the distribution. The least-squares fit shown, with an unremarkable correlation coefficient of r = 0.18, is BD = 0.64β+ 7.64. While we do not claim any formal correlation between these two measures, we use this result below in an exploration of different parametrizations of the FUV attenuation, AFUV. In order to minimize any bias in the least-squares fit, any Balmer decrements with values ≤2.86 were excluded from the fit. This removes ≈21 per cent of the sample for the purposes of this fit.

(a) Comparison of Balmer decrement and the β parameter. There is a very weak trend, although for any given value of β the Balmer decrement can vary by factors of typically 2–3, but ranging up to 10. The blue line shows the mean values for the Balmer decrement in bins of β, while the green line shows the line of best fit. The error bars show the median errors. (b) These histograms show how the Balmer decrements are distributed across three β ranges. As we move to higher β values, it is clear that the typical Balmer decrement also increases. The three bins contain 2510, 9788 and 1115 galaxies in the order of the lowest to the highest β ranges. Two bins (−1.5 < β < −0.5 and 0.5 < β < 1.5) are omitted for clarity, although they follow the same trend.
While there is a large scatter, it can be seen from Fig. 2 that at the highest β values there is a concentration of systems with higher Balmer decrements. In other words, systems with low Balmer decrements tend to have flatter UV spectral slopes. It is also interesting to note that the lowest values of β (the bluest UV spectral slopes) are not associated with the lowest Balmer decrements. Galaxies with the highest measured Balmer decrements tend to have a broad range of UV spectral slopes. Systems with flat UV slopes (β∼ 0), however, have the broadest range of Balmer decrement.
The Balmer decrement and the β parameter both measure the strength of obscuration in different ways, so naively a correlation between the two parameters might be expected. The dust geometry in galaxies is not a simple foreground screen, though, instead having complex filamentary and patchy structure (Calzetti 1997, 2001). A consequence of this is that Balmer decrement and β are likely to be sensitive to the average obscuration at different optical depths within a galaxy. Indeed, even Hα and Hβ can be seen to probe different optical depths (Serjeant, Gruppioni & Oliver 2002). It is also the case that the UV spectral slope includes emission from older stellar populations than the OB stars responsible for ionizing the hydrogen (e.g. Charlot & Fall 2000; Bell 2003), and that these older stellar populations are likely to be distributed differently throughout a galaxy than the OB stars, and hence being affected by different levels of dust obscuration (e.g. Calzetti 1997). In the absence of sophisticated modelling of the radiative transfer within galaxies (e.g. Witt, Thronson & Capuano 1992; Xilouris et al. 1997; Silva et al. 1998; Popescu et al. 2000; Tuffs et al. 2004; Popescu et al. 2011), it is challenging to overcome this limitation.
In the following sections, we analyse the distribution of galaxy SFR, mass and redshift on the relationship between the Balmer decrement, the β parameter and the IR and FUV luminosities.
4 UV ATTENUATION
We use LIR/LFUV as a measure of the UV attenuation under the assumption that the energy absorbed from the UV luminosity is re-emitted in the IR. We would naively expect to see higher BDs and steeper UV slopes with increasing LIR/LFUV.
Fig. 3 shows the variation of both Balmer decrement and β as a function of LIR/LFUV. These relationships show weak trends, emphasized by the best-fitting lines, although it is clear that there is a large scatter. The correlation coefficients demonstrate that these trends are weak at best, with r = 0.44 for Balmer decrement, and r = 0.48 for β, against LIR/LFUV. It is encouraging to see that for low LIR/LFUV, the values of both Balmer decrement and β are small, although at high LIR/LFUV the range of possible obscuration values becomes quite large (although with a clearly increasing mean value as LIR/LFUV increases). Fig. 3(b) also shows the relationships found for local starbursts (Meurer et al. 1999; Kong et al. 2004) and optically selected star-forming galaxies (Boissier et al. 2007). Our sample, as also found for higher IR luminosity systems by Buat et al. (2010), spans the regime between these models. This is obviously the origin of the discrepancies seen (Buat et al. 2010; Wijesinghe et al. 2011) when applying the standard relations between β and attenuation in deriving SFRs.
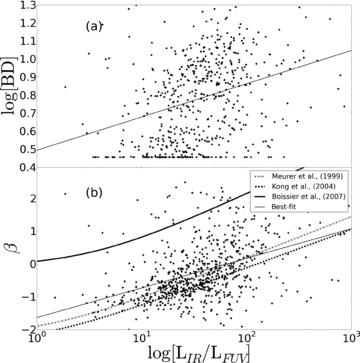
(a) Balmer decrement and (b) β, as a function of the IR-to-dust uncorrected FUV luminosity ratio. The thin solid lines in each panel show the least-squares linear best fit. Other relationships between β and LIR/LFUV are shown as follows. Dashed line: Kong et al. (2004) for local starbursts; dot–dashed line: Meurer et al. (1999) also for local starbursts; thick solid line: Boissier et al. (2007) for optically selected star-forming galaxies.
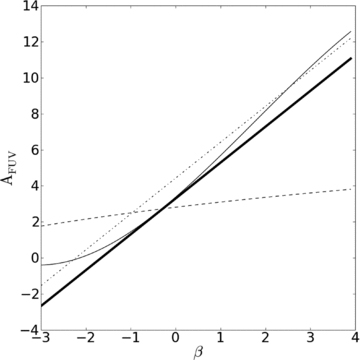
Different observational correlations between β and the attenuation at FUV wavelength, AFUV. Thin solid line: equation (2) from Buat et al. (2005) combined with equation (5); dot–dashed line: Meurer et al. (1999); thick solid line: Wijesinghe et al. (2011); dashed line: this paper, equation (6) derived using the relationship between BD and β.
It is encouraging to see the consistency between the relationships of Buat et al. (2005) and Wijesinghe et al. (2011), and the offset of the relationship of Meurer et al. (1999) has been discussed above. It is particularly intriguing, however, to see the very different relationship presented when Balmer decrement is used as a proxy in the process of estimating attenuation. The significantly different slope derived here (dashed line in Fig. 4), a consequence of the logarithmic dependence on the Balmer decrement, may start to give some hints as to why such dramatically different results are obtained when using these different approaches to obscuration corrections in deriving SFRs. We return to this in Section 6.
5 IR AND FUV LUMINOSITIES
Fig. 5 shows a clear trend between the FUV and IR luminosities. The scatter within the trend varies at different FUV luminosities. At high FUV luminosities, the distribution of IR luminosities is relatively constrained (≈1 dex), while at low FUV luminosities the distribution is much broader (≈2.5 dex).
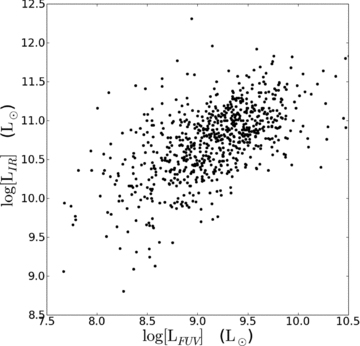
FUV luminosity compared with IR luminosity. While there is a clear relationship overall between the two luminosities, at low FUV luminosities there is a much broader range of IR luminosities compared to high FUV luminosities.
Fig. 6 shows relationships between LIR/LFUV, Hα SFR, mass and the specific SFR (SSFR) as a function of redshift, where SSFR is the SFR divided by the stellar mass of the galaxy. The range of observable values for these properties becomes more limited with redshift, a consequence of the flux limited selection of the GAMA survey. This effect is strongest for SFR and mass, but less limiting for LIR/LFUV. The mild increase seen in average LIR/LFUV with redshift is consistent with the evolution in dust mass found by Dunne et al. (2010).
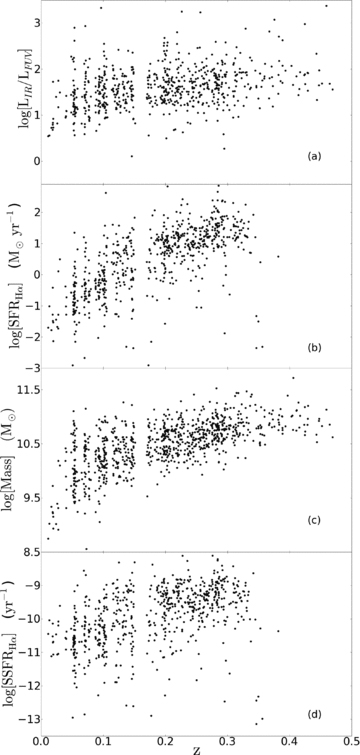
Variation with redshift of (a) LIR/LFUV ratio, (b) Hα SFR, (c) mass, (d) specific Hα-derived SFR. The gap centred on z = 0.16 shows where the wavelength of the atmospheric O2 band (Fraunhofer A-line) overlaps with redshifted wavelength of the Hα emission line. For this reason, we cannot use Hα emission-line measurements that fall into this redshift range, leading us to omit these data from our analysis.
In Fig. 7, we compare the IR-to-FUV luminosity ratio, which indicates dust attenuation, against the IR luminosity, the dust uncorrected FUV luminosity and the sum of these two quantities, in order to explore these relations as a function of SFR, mass and redshift. Each set of three panels in Fig. 7 shows the same data, but colour coded by different parameters in each row to highlight the impact of these properties. Presenting the combination of LFUV and LIR data in this way allows ease of comparison to the wealth of existing similar analyses (e.g. Buat et al. 2005, 2009, 2010).
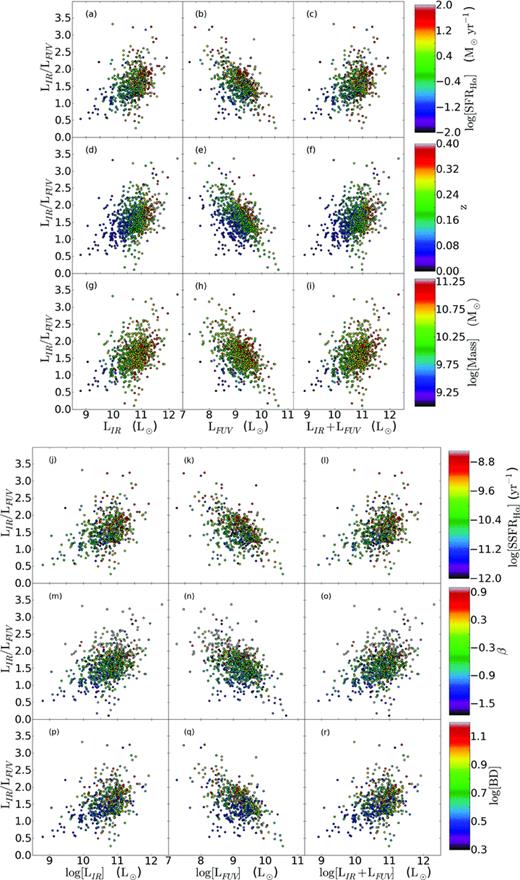
The IR-to-FUV luminosity ratio is shown against (from left to right) the IR luminosity, dust-uncorrected FUV luminosity and the sum of the IR and dust-uncorrected FUV luminosity. The plots are colour coded as a function of (from top to bottom) the dust-corrected Hα-derived SFR, redshift, galaxy stellar mass, dust-corrected Hα-derived SSFR, β and Balmer decrement.
It has become common now to infer SFRs by combining the IR and UV luminosities, as an alternative to explicit obscuration corrections (e.g. Buat & Xu 1996; Buat et al. 1999; Flores et al. 1999; Hopkins & Beacom 2006). The ranges of the values in Fig. 5 also agree with those observed in Buat et al. (2009). Buat et al. (2010) measure the IR-to-FUV luminosity ratio for a sample of galaxies in the Lockman field surveyed by Herschel as part of the Herschel Multi-tiered Extragalactic Survey (HerMES)4. Our sample probes lower IR luminosities than that of Buat et al. (2010), and also shows a slightly lower range in the ratio of IR to FUV luminosities, a consequence of the low-redshift range of our sample.
The basic structure seen here is that systems of low LIR have lower LIR/LFUV ratios, while for high LIR a broad range of LIR/LFUV ratios is visible, with medians increasing with increasing LIR (a trend which continues to higher LIR, as in fig. 1 of Buat et al. 2010). It is clear that despite the broad range of ratios at high LIR, the majority of galaxies display high LIR/LFUV ratios. Strikingly, the highest LFUV systems (prior to dust correction) are those with the smallest values of LIR/LFUV, a result that has been emphasized by Buat et al. (2009), and which highlights the limitations of UV selection when performing a star formation census. Systems with low observed LFUV tend to have the highest LIR/LFUV ratios, an indication of significant obscuration in these systems. As a function of the combined IR and FUV luminosity, the general trend is similar to that with the LIR alone. The contribution of the FUV luminosity to the total is significant only for the lower LIR systems, and essentially negligible for the more luminous IR systems.
Buat et al. (2009) shows that the IR-to-UV luminosity ratio does not change significantly with increasing redshift for the majority of UV-selected galaxies. Interestingly, Lyman break galaxies at z < 1, which are photometrically colour selected, were found by Buat et al. (2009) to show systematically lower LIR/LFUV at the same UV luminosity compared to the UV-selected systems. The implication here is that Lyman break galaxies may be more biased against obscured systems than those identified by simple UV selection. For IR-selected (250- m selections with the SPIRE instrument onboard the Herschel telescope) galaxies, however, Dunne et al. (2010) find that the dust mass function evolves strongly with redshift, so that the dustiest galaxies at higher redshifts have higher characteristic dust masses than those at lower redshifts. They also find that sub-millimetre-selected galaxies are more dusty per unit stellar mass and more obscured at earlier times; however, this second finding is simply based on the trend of averaged quantities over redshift and thus can be influenced by the IR selection which favours more obscured galaxies as the limiting detectable dust mass increases with redshift.
Before discussing the trends with SFR, mass and redshift, we emphasize that this sample is not volume or luminosity limited, and there are consequently strong correlations between these three parameters (with both mass and SFR being higher at higher redshift), simply as a consequence of the flux-limited sample being explored. While this selection bias should be borne in mind, none of the following investigation is reliant on using a volume-limited or luminosity-limited sample, and the conclusions are not affected by the flux-limited sample selection.
The SFR dependence is shown in Figs 7(a)–(c). The SFRs used here are those derived from the Hα luminosity, obscuration corrected using the Balmer decrement and the obscuration curve of Fischera & Dopita (2005), as in Wijesinghe et al. (2011). It is clear that LIR correlates with the Hα-derived SFRs, and it is worth emphasizing that systems with the highest SFRs and the highest LIR/LFUV ratios are pushed to the lowest FUV luminosities. In other words, a UV-selected sample will always be prone to missing even very high-SFR systems with sufficient obscuration.
The redshift dependence (Figs 7d–f) and the mass dependence (Figs 7g–i) are both very similar to the SFR dependence. This is a consequence of both the flux limit (meaning that high-SFR systems tend to be found at higher redshift) and the relatively tight relationship between stellar mass and SFR. We can account for this to some degree by looking at the dependence on specific star formation rates (SSFRs), which are sampled more uniformly with redshift (Figs 7j–l). This shows a very similar trend as for SFR and mass, with higher luminosity systems having higher SSFRs in general (a consequence of massive star-forming galaxies being able to support proportionally higher levels of star formation than low-mass systems). There is no strong dependence, though, between LIR/LFUV and SSFR, with a broad range of SSFRs being sampled at any given value of LIR/LFUV.
Fig. 7(d) echoes fig. 1 of Buat et al. (2010), but continued to lower luminosity and redshift, sampling the 0 < z < 0.35 range. This demonstrates a clear trend that continues to lower LIR/LFUV ratios at lower LIR and lower redshift. The apparent strong correlation between LIR and redshift is a consequence of the flux-limited sample as well as the strong evolution in the LIR over this redshift range. Dye et al. (2010) showed that the 250- m luminosity density increases as (1 +z)7.1 in 0 < z < 0.2. Similar evolution has also been observed from IRAS and Spitzer/ISO. Dunne et al. (2010) showed that the dust content of galaxies also increases over this redshift range.
It is clear, though, that lower luminosity systems, which in general show lower LIR/LFUV ratios, tend to have lower SFRs and masses and are more easily visible at lower redshift. The tendency for higher luminosity systems (those with higher SFRs) to have a broader range of obscurations, and on average to be more heavily obscured, is now well established (e.g. Hopkins et al. 2001, 2003; Afonso et al. 2003; Pérez-González et al. 2003), and this tendency is illustrated throughout Fig. 7.
The distribution of the obscuration measures β and Balmer decrement can be seen in Figs 7(m)–(o) and Figs 7(p)–(r), respectively. The striking feature here is the lack of any strong relationship. Reflecting the weak trends seen in Fig. 3, there is a definite tendency to see systems with higher values of β at higher LIR/LFUV ratios, and these systems are also those with high LIR and the lowest LFUV. The Balmer decrement on the other hand shows even less of a systematic variation, with only a very weak tendency towards higher values for high LIR/LFUV and LIR. This again is likely to be a consequence of the sensitivities of Balmer decrement and β to different optical depths within these galaxies.
The overall conclusions from this exploration are the following.
We see an obvious relationship between obscuration as measured by LIR/LFUV and SFR measured using dust-corrected Hα luminosities. This is consistent with existing results (e.g. Afonso et al. 2003; Hopkins et al. 2003; Pérez-González et al. 2003), showing lower obscuration for low-SFR systems, but a large range of obscuration in high-SFR systems.
We see a similar result with galaxy stellar mass, reflecting the mass–SFR relationship in galaxies (high-SFR systems tend also to be of high stellar mass), again with low-mass systems displaying lower obscuration, but high-mass galaxies having a broad range. This is consistent again with the result found by Buat et al. (2009) as a function of K-band luminosity.
The redshift variation is a consequence of the sample selection, with high-mass, high-SFR systems only being able to be detected at higher redshift, due to the volume being sampled. As Dunne et al. (2010) shows, there is also likely to be a contribution from evolution in the dust masses in galaxies over this redshift range.
The correlation between the β parameter and the BD was found to be very weak.
6 STAR FORMATION RATES
The primary reason for a detailed investigation of the UV spectral slope is in assessing its utility for making obscuration corrections to UV luminosities, and in many cases to subsequently calculate SFRs. Here we look at SFRs calculated using FUV and Hα luminosities, corrected for obscuration using various combinations of β and Balmer decrement. These SFRs were calculated using the prescription outlined in Wijesinghe et al. (2011) where the SFR conversion factor was derived using a Baldry & Glazebrook (2003) IMF with a mass range of 0.1–120 M⊙ and the population synthesis model by Fioc & Rocca-Volmerange (1997).
Wijesinghe et al. (2011) calculated SFRs from FUV luminosities corrected for obscuration using both Balmer decrement and β, showing that even when accounting for the offset in the attenuation from the Meurer et al. (1999) prescription, there remains significant scatter in the relation. This is highlighted again in Fig. 8. This figure compares SFRs derived using dust corrections made using Balmer decrement for both measures, using β for both measures and using β for the FUV and Balmer decrement for the Hα SFRs. The first point to emphasize is that using inconsistent obscuration measures for different SFR estimates is the primary source of the huge scatter seen. The scatter in Fig. 8(d) is a direct reflection of the scatter between β and Balmer decrement (Fig. 2).
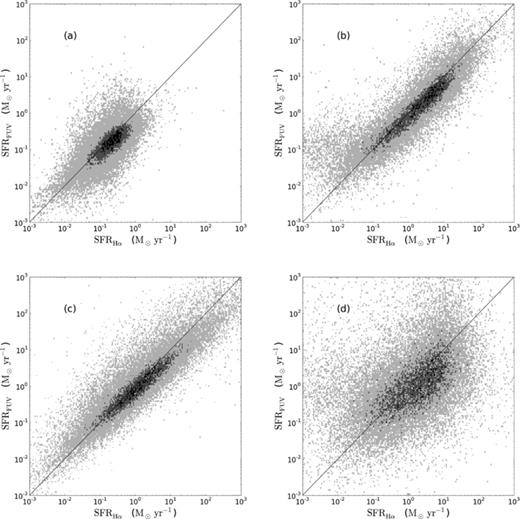
FUV SFR plotted as a function of Hα SFRs using various obscuration corrections. (a) No obscuration corrections applied. (b) FUV SFR against Hα-derived SFR, both obscuration corrected using the Balmer decrement. (c) FUV SFR against Hα-derived SFR, both obscuration corrected using β. (d) FUV SFR corrected for dust using β compared against that measured using Hα, corrected using the Balmer decrement. The solid line in each panel shows equality between both axes. The figures show the density of points in a given region in the plot where the darker the shading, the denser the points in that region.
It is also clear that SFRs calculated using dust obscuration corrections based on the Balmer decrement give the most self-consistent results (Fig. 7b). When β is used to correct both FUV and Hα luminosities, a correlation is seen in Fig. 7(c). This is expected as both the FUV and the Hα luminosities share identical β factor leading to the same obscuration factor being applied to both. Since the uncorrected luminosities show some agreement (Fig. 8a), multiplying by the same factor merely stretches out the distribution to what is observed in Fig. 8(c). The deviation seen at high SFRs, with FUV SFRs tending to be slightly, but systematically, underestimated compared to Hα SFRs, is also visible in the uncorrected luminosities, and reflects the greater effect of obscuration at UV wavelengths. This contrasts to the Balmer decrement approach which finds agreement between the two SFR indicators by using dust corrections appropriate for each wavelength.
Given that LIR/LFUV is (marginally) more tightly correlated with β than it is with Balmer decrement (Fig. 3), it is straightforward to infer that using an IR excess to account for obscuration at UV wavelengths will result in similar effects as seen above with β. We do not attempt to calculate SFRs directly from LIR in the current investigation, as we are focusing on the self-consistency of obscuration corrections between the UV- and Hα-derived SFRs. A detailed analysis of SFR calibrations from Herschel fluxes in multiple passbands is currently underway (da Cunha et al., in preparation).
Consider the implications of the scatter between β and Balmer decrement. If the origins of the scatter are largely physical, associated with probing different optical depths, stellar populations and dust geometries, it is perhaps reasonable to argue that β is a more appropriate metric to use in making dust obscuration corrections to UV luminosities, as the obscuration being probed by β is the same as that affecting the luminosity to be corrected. Similarly, the argument would be made that Balmer decrement would be the most appropriate obscuration metric to use in correcting Hα luminosities. Why, then does this combination give rise to a poorer comparison between the two estimates of SFR (Fig. 8d) than using Balmer decrement for both (Fig. 8b)? We explore this further in Section 7.
7 DISCUSSION
Given the above limitations, what can we say about the utility of β as a proxy for obscuration in galaxies? First, we emphasize that we are limiting ourselves here to values of β estimated from the two broad UV bands of GALEX. More robust constraints on the UV spectral slope (Calzetti et al. 1994) would clearly improve the situation by removing that contribution to the scatter in the measurement of β. Kong et al. (2004) also show that the inclusion of SFR histories also helps to reduce the scatter when using β as an obscuration metric. The SFRs of the current sample were investigated in the context of LIR/LFUV, and also against β, and showed no straightforward correlation. Regression analysis, using Balmer decrement as the independent variable, and multiple combinations of β, SFR, redshift and stellar mass, as the dependent variables, shows little improvement in the weak correlation already found between Balmer decrement and β.
It is also undoubtedly the case that the UV spectral slope is sampling a measure of obscuration that is physically different from that measured by the Balmer decrement (e.g. Calzetti 1997; Charlot & Fall 2000). The use of the Balmer decrement in applying obscuration corrections to both FUV- and Hα-derived SFRs, however, produces highly consistent estimates. This suggests that the effect of the potentially different obscurations on the UV luminosity and the Hα luminosity is not a major or systematic effect, and that the uncertainties associated with the β approach are much larger than these underlying physical differences can explain.
The conclusion we are left with, then, is that, the above limitations associated with measurement aside, the UV spectral slope is sensitive to many factors, of which obscuration is only one. These additional factors, including the age of the most recently formed stellar population, and contributions from older stellar populations, along with metallicity and IMF slope, are not insignificant, and are challenging to account for in a simple way. Further investigation of the utility of β as an obscuration metric will need to explore all these effects in a thorough and systematic fashion, ideally with data that sample the UV spectrum finely.
Finally, we reiterate that the correlation of LIR/LFUV is stronger with the UV spectral slope than it is with the Balmer decrement, although the correlation coefficients in both cases are low.
8 CONCLUSION
We have used a sample of galaxies from the H-ATLAS SDP region, with multiwavelength photometry and spectroscopy from GAMA to explore the relationships between the UV spectral slope β and the Balmer decrement. We find that there is a very poor correlation at best between the Balmer decrement and β, and that the use of β as an obscuration metric suffers from significant limitations.
We see, as found by other authors, a clear but weak dependence between IR excess, here estimated using LIR/LFUV, and β. We find at most a weak trend between LIR/LFUV and Balmer decrement. We also reiterate the results of Buat et al. (2009) that UV-selected samples will be strongly biased against heavily obscured systems, even of similarly high luminosity to those that enter such samples. We find consistent results with Buat et al. (2010) regarding the trend of LIR/LFUV with LIR and redshift, probing in this analysis to lower redshifts and luminosities. We also see trends with SFR and galaxy mass that reinforce existing correlations and trends between these properties with luminosity and obscuration.
In summary, we urge caution in the use of β as an obscuration metric when it is able to be inferred only from a few broad-band photometric measurements, in particular for systems at high redshift, given the limitations apparent in doing so even for large samples of well-studied galaxies at low redshift.
Herschel is a European Space Agency (ESA) space observatory with science instruments provided by European-led Principal Investigator consortia and with important participation from NASA.
DBW acknowledges the support provided by the Denison Scholarship from the School of Physics. GAMA is a joint European–Australasian project based around a spectroscopic campaign using the Anglo-Australian Telescope. The GAMA input catalogue is based on data taken from the SDSS and the UKIDSS. Complementary imaging of the GAMA regions is being obtained by a number of independent survey programs including GALEX MIS, VST KIDS, VISTA VIKING, WISE, H-ATLAS, GMRT and ASKAP providing UV to radio coverage. GAMA is funded by the STFC (UK), the ARC (Australia), the AAO and the participating institutions. The GAMA web site is http://www.gama-survey.org/. The H-ATLAS is a project with Herschel, which is an ESA space observatory with science instruments provided by European-led Principal Investigator consortia and with important participation from NASA. The H-ATLAS web site is http://www.h-atlas.org/
REFERENCES
