


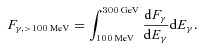
Abstract
The population of γ-ray emitting millisecond pulsars (MSPs) was studied by using Monte Carlo techniques. We simulated the Galactic distributions of the MSPs, and applied the outer gap model for the γ-ray emission from each simulated MSP. We took into account the dependence of the observed γ-ray flux on the viewing angle and on the inclination angle, which is the angle between the rotation axis and the magnetic axis, respectively. Using the sensitivity of the 6-month long observation of the Fermi telescope and radio sensitivities of existing pulsar surveys, 9–13 radio-selected and 22–35 γ-ray-selected pulsars are detected within our simulation. The statistical properties of the simulated population are consistent with the Fermi observations. Scaling the observed sensitivity  , where T is the length of observation time, the present model predicts that over the 5-year mission Fermi would detect 15–22 radio-selected γ-ray MSPs, and 95–152 γ-ray-selected MSPs. Our simulation also predicts that about 100 (or 200–300) γ-ray MSPs with a flux larger than F≥ 10−11 erg cm−2 s−1 (or 5 × 10⁻¹² erg cm−2 s−1) irradiate the Earth. With the present sensitivities of radio surveys, most of them are categorized as γ-ray-selected pulsars, indicating that most of the γ-ray MSPs have been missed by the present Fermi observations. We argue that the Galactic Fermi unidentified sources located at high latitudes should be dominated by MSPs, whereas the sources in the Galactic plane are dominated by radio-quiet canonical pulsars. We want to emphasize that the predicted number of radio-loud γ-ray MSPs depends on the sensitivities of radio surveys and that it can be increased, for example, from 15–22 to 26–37 if the radio sensitivity is improved by a factor of 2.
1 INTRODUCTION
The millisecond pulsars (MSPs), which have a rotation period P∼ 0.002–0.1 s and a stellar magnetic field Bs∼ 108 − 9 G, are classified as a different generation from the canonical pulsars, which have P∼ 0.03–10 s and Bs∼ 1012 − 13 G. The Fermi LAT has detected γ-ray emissions from about 60 pulsars in just 2 years of observation, including nine MSPs (Abdo et al. 2010a,b,c, 2009a,b; Saz Parkinson et al. 2010). Furthermore, the detection of radio MSPs from about 20 unidentified Fermi point sources (e.g. Caraveo 2010; Ray 2010; Ransom et al. 2011) has been reported. The MSPs are now recognized as one of the major populations of the Galactic γ-ray sources.
The particle acceleration and high-energy γ-ray radiation processes in the pulsar magnetosphere have been studied with the polar cap model (Ruderman & Sutherland 1975; Daugherty & Harding 1982,1996), the slot gap model (Arons 1983; Muslimov & Harding 2003; Harding et al. 2008) and the outer gap model (Cheng, Ho & Ruderman 1986a,b; Hirotani 2008; Takata, Wang & Cheng 2010a), respectively. All models have assumed that the charged particles are accelerated by the electric field along the magnetic field lines, and that the accelerating electric field arises in the charge deficit region, where the local charge density deviates from the Goldreich–Julian charge density (Goldreich & Julian 1969). The polar cap model assumes that the acceleration region is near the stellar surface. On the other hand, the outer gap model and the slot gap model assume a strong acceleration region extending to the outer magnetosphere. For the canonical γ-ray pulsars, several access of observational evidence have been proposed for the outer magnetospheric origin of the γ-ray emissions (Aliu et al. 2008; Abdo et al. 2009c). Because the strength of the magnetic field at the outer magnetosphere of the MSPs is similar to that of canonical pulsars, B∼ 105 − 6 G, it is expected that if the γ-ray emissions of the MSPs originates from the outer magnetosphere, the emission characteristics (e.g. pulse profile and spectrum) will be similar to those of the canonical pulsars.
Romani & Watters (2010) and Watters & Romani (2011) studied the pulse profiles of the canonical pulsars observed by Fermi. They computed the pulse profiles predicted by the outer gap model and slot gap model, and argued statistically that the outer gap geometry is more consistent with the observations than the slot gap geometry. Venter, Harding & Guillemot (2009) fit the pulse profiles of the Fermi detected MSPs with the geometries predicted by the different high-energy emission models. They found that the pulse profiles of two out of eight MSPs cannot be fitted by the geometry of either the outer gap model or the slot gap model. They proposed a pair-starved polar cap model, in which the multiplicity of the pairs is not high enough to completely screen the electric field above the polar cap, and the particles are continuously accelerated up to a high altitude over the entire open field line region. Thus we see that the γ-ray emission mechanism and the emission site in the MSP’s magnetosphere have not been satisfactorily explained up to now.
The increase in population of detected γ-ray emitting pulsars allows us to perform a more detailed population study of the high-energy emissions from the pulsars. A comparison between the simulated and observed distributions of the various pulsar characteristics (e.g. rotation period and γ-ray flux) will be useful to test the high-energy emission model. With the canonical γ-ray pulsars, Takata, Wang & Cheng (2011) have studied the population predicted by the outer gap model. They predicted that with the sensitivity of the 6-month long Fermi observation, about 100 γ-ray emitting canonical pulsars can be detected, suggesting that the present observations have missed many γ-ray emitting pulsars. For the MSPs, Story, Gonthier & Harding (2007) have studied the population of γ-ray MSPs with the slot gap accelerator models and predicted the Fermi observations. They predicted that Fermi will detect 12 radio-loud and 33–40 radio-quiet γ-ray MSPs.
The Galactic population of the γ-ray pulsars has been studied for an understanding of the origin of the unidentified γ-ray point sources and diffuse background radiation (e.g. Bailes & Kniffen 1992; Faucher-Giguère & Loeb 2010). For example, Kaaret & Cottam (1995) argued that the EGRET unidentified sources near the Galactic plane are likely dominated by canonical pulsars. Faucher-Giguère & Loeb (2010) pointed out that the MSPs could provide a large contribution to the γ-ray background radiation at higher Galactic latitude. In the Fermi first source catalogue, there are several hundred unidentified steady point sources (Abdo et al. 2010b). Takata et al. (2011) have demonstrated that the Fermi unidentified sources located in the high Galactic latitudes cannot be explained by the Galactic distribution of the canonical pulsars. The MSPs are possible candidates for the high Galactic Fermi unidentified sources.
In this paper, we develop a Monte Carlo study of the population of the γ-ray emitting MSPs predicted by the outer gap model. In particular, we only study the population of MSPs in the Galactic field (not in the globular clusters). Following the previous studies (e.g. Cheng & Zhang 1998; Story et al. 2007; Takata et al. 2011), we will perform a Monte Carlo simulation for the Galactic population of the MSPs (Section 2). In Section 2.4, we will discuss our γ-ray emission model, including dependence of the γ-ray flux on the viewing geometry. In Section 3, we present the results of our simulation. In particular, we will compare the simulated population with the Fermi 6-month long observation (Section 3.2). In Section 3.4, we discuss the possibility of MSPs as the origin of the Galactic Fermi unidentified sources. We will discuss the results of our simulation in Section 4.
2 MONTE CARLO SIMULATION
2.1 Galactic population
 with Rmax = 20 kpc and zexp = 200 pc (Story et al. 2007).

2.2 Pulsar characteristics
It is widely accepted that the MSPs are so-called recycled pulsars, which were spun up by accretion of the matter from the low-mass companion star. The rotation period of the newly born MSP is related to the history of the accretion on to the neutron star. In particular, its rotation period in the accretion stage may be related to the equilibrium spin period,  , where B8 is the neutron star magnetic field in units of 108 G,
  is the accretion rate in units of 1015 g s−1, R6 is the neutron star radius in units of 106 cm and M1.4 is the neutron star mass in units of 1.4 solar mass (Frank, King & Raine 2002). However, the description of the transition from an accretion-powered to a rotation-powered phase is not well understood due to the complexities in the description of the interaction between the magnetosphere of a neutron star and its accretion disc. Furthermore, the transition, for which a rapidly decreasing accretion rate is required (e.g. Jeffrey 1986), may be facilitated by different processes between the long and short orbital period systems. For the long orbital period systems, a red giant companion can detach from its Roche lobe as its envelope is exhausted. On the other hand, for the short orbital period systems, a possible mechanism leading to the sudden decrease in the accretion flow is the operation of the so-called ‘propeller effect’ (Campana et al. 1998), or dissolution of the disc by γ-ray irradiation in the quiescent stage (Takata, Cheng & Taam 2010b). The initial period of the MSPs will depend on the characteristics of the orbital motion and/or the termination mechanism of the accretion flow.
In the present study, we assume that all MSPs are not directly produced by supernova explosions, but that they are born by the recycled process in a low-mass binary system. On this assumption, the true age of the MSPs, defined by the time since the neutron star was born in the supernova explosion, is different from the spin-down age (i.e.  ), and from the age defined by activating the rotation-powered activity. Because the time-scale of the recycled process, including the decay of the neutron star’s magnetic field and the accretion process, is not understood well, it is very difficult to calculate the present period and the magnetic field strength of MSPs from their initial distributions and the true age of MSPs.
 ) and the stellar magnetic field (Bs) for each simulated MSP following the observed
  distribution, where we use the intrinsic value after removing the Shklovskii effect (see below). In this paper, we denote as Bs the strength of the magnetic field at the magnetic equator, namely,
  . The current rotation period and the spin-down age of simulated MSPs are calculated from
 are the rotation period in units of 0.001 s and the period time derivative in units of 10−20, respectively. The distributions, which are used in the present simulation, are represented for the various characteristics of the simulated MSPs in Fig. 1 by dashed lines. Fig. 1 also presents the observed distributions (shaded histograms; Manchester et al. 2005).
The observed distributions (shaded histograms) of the various characteristics for radio MSPs. The dashed lines show the distributions applied for the present simulation. The observed distributions are for the intrinsic values (i.e. without Shklovskii effect) of the pulsar parameters.

 , which is much greater than that caused by the Shklovskii effect.
We note that the present procedure can be applied if the Galactic distribution of the MSPs does not depend on the age of the rotation-powered MSPs (and spin-down age); that is, the Galactic MSP’s populations of 1- and 10-Gyr MSPs, for example, are described by the same distribution. With the present assumption that all MSPs are born through the recycled process, which has a characteristic time-scale completely independent of the spin-down age, the Galactic distribution is independent of the distribution of the spin-down age. With a typical velocity of the observed MSPs, v∼ 70 km s−1, it is expected that the typical displacement of MSPs with an age, τ≥ 100 Myr, becomes larger than the size of the Galaxy. However, with the slow velocity, the MSPs remain bound to the Galaxy and hence their Galactic distribution does not depend on the age of the rotation-powered MSPs. On the other hand, for canonical pulsars (in particular for the γ-ray pulsars), the Galactic distribution depends on the true age, which is almost equal to the spin-down age. This allows us to calculate the present-period distribution from the initial distribution.
2.3 Radio emissions
 , and L400 is the luminosity in units of mJy kpc2. Here η is a scaling factor to adjust the observed distribution, and η = 1 for the canonical pulsars. In the present simulation for the MSPs, we find that η∼ 0.05 can explain the distribution of the observed radio luminosity of the MSPs. The radio flux on Earth is given by S400=L400/d2, where d is the distance to the MSP. We scale the simulated 400 MHz luminosity to the observational frequency using a typical photon index ∼1.8 (Kramer et al. 1997).
We use the 10 radio surveys (Molongo 2, Green Band 2 and 3, Arecibo 2 and 3, Parks 1, 2 and MB, Jordell Bank 2 and Swinburne IL), whose system characteristics are listed in Table 1 of Takata et al. (2011) and the references therein. To calculate the dispersion measure, we use the Galactic distribution of electrons obtained by Cordes & Lazio (2002).
Population of the simulated radio-selected and γ-ray-selected γ-ray MSPs. The subscript r and g represent the radio-selected and γ-ray-selected pulsars, respectively.  (i=r, g) are population of ‘bright’ MSPs with a γ-ray flux larger than 10−10 erg cm−2 s−1, and Ni are results with the Fermi 6-month long observation. In addition, Ni, 5 and Ni, 10 are population with the sensitivity projected to 5- and 10-yr observations, respectively.
 |  | Nr | Ng | Nr,5 | Ng,5 | Nr,10 | Ng,10 | |
| fmax=fcrit | 2 | 2 | 9 | 22 | 15 | 101 | 17 | 157 |
| fmax = 1 | 3 | 3 | 13 | 35 | 22 | 161 | 25 | 248 |
| | Nr | Ng | Nr,5 | Ng,5 | Nr,10 | Ng,10 | |
| fmax=fcrit | 2 | 2 | 9 | 22 | 15 | 101 | 17 | 157 |
| fmax = 1 | 3 | 3 | 13 | 35 | 22 | 161 | 25 | 248 |
Population of the simulated radio-selected and γ-ray-selected γ-ray MSPs. The subscript r and g represent the radio-selected and γ-ray-selected pulsars, respectively. (i=r, g) are population of ‘bright’ MSPs with a γ-ray flux larger than 10−10 erg cm−2 s−1, and Ni are results with the Fermi 6-month long observation. In addition, Ni, 5 and Ni, 10 are population with the sensitivity projected to 5- and 10-yr observations, respectively.
| | Nr | Ng | Nr,5 | Ng,5 | Nr,10 | Ng,10 | |
| fmax=fcrit | 2 | 2 | 9 | 22 | 15 | 101 | 17 | 157 |
| fmax = 1 | 3 | 3 | 13 | 35 | 22 | 161 | 25 | 248 |
| | Nr | Ng | Nr,5 | Ng,5 | Nr,10 | Ng,10 | |
| fmax=fcrit | 2 | 2 | 9 | 22 | 15 | 101 | 17 | 157 |
| fmax = 1 | 3 | 3 | 13 | 35 | 22 | 161 | 25 | 248 |
2.4 γ-ray emission model
2.4.1 Observed γ-ray flux
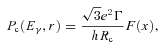
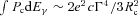 . Furthermore, if we estimate the total number of charged particles in the gap in terms of values near the light cylinder as
 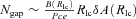 , we obtain
We also assume as a zeroth-order approximation that the gap current is of the order of the Goldreich–Julian value over the full width. A detailed calculation of the outer gap model (e.g. Takata, Chang & Shibata 2008) gives the current distributions in the direction perpendicular to the magnetic field lines. On the other hand, by fitting the observed γ-ray spectra of all mature pulsars detected by Fermi, Wang, Takata & Cheng (2010) find that the total current in the gap is of the order of the Goldreich–Julian value. We expect that as long as the total power of the γ-ray radiation from the outer gap accelerator is concerned, the uniform current distribution with the Goldreich–Julian value would not be a bad approximation.
2.4.2 Thickness of the outer gap

 by curvature radiation near the stellar surface, where mec2 and αf are the electron rest mass energy and the fine structure constant, respectively. The 100 MeV photons form pairs by the magnetic pair creation process. The photon multiplicity is easily over 104 for each incoming particle. For a simple dipole field structure, all pairs should move inwards and cannot affect the outer gap accelerator. However, Takata et al. (2010a) have argued that if the magnetic field lines near the surface, instead of being nearly perpendicular to the surface, are bending sideways due to the strong local field, the pairs created on these local magnetic field lines can have an angle bigger than 90°, which would result in an outgoing flow of pairs. With this model, the estimated fractional gap thickness is given by
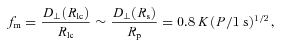

2.4.3 Dependence on the inclination and viewing angles
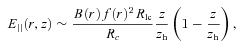
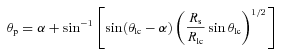
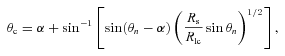
The observed characteristics of the γ-ray emissions depend on the viewing angle and the inclination angle between the rotation axis and the magnetic axis. With the geometry of the outer gap model, stronger emissions are emitted towards a viewing angle ξ∼ 90°, and the observed flux tends to decrease as the viewing angle closes to the rotation axis, where ξ = 0° or ξ = 180°. To take into account this effect, we calculate the γ-ray flux, described in Section 2.4.1, as a function of the viewing angle and of the inclination angle. In the calculation, we apply the vacuum dipole field geometry and assume that the outer gap extends from the null charge point of the Goldreich–Julian charge density to r = 1.5Rlc or ρ=Rlc, where ρ is the axial distance from the rotation axis. We also assume for simplicity no azimuthal dependence of the gap structure.
Fig. 2 shows the dependence of the γ-ray flux as a function of the viewing angle (ξ) and of the inclination angle (α). The vertical axis represents the fractional γ-ray flux, which is defined as the γ-ray flux divided by f3Lsd/d2. The different lines correspond to the different inclination angles. The results are obtained for a rotation period P = 3 ms and the stellar magnetic field Bs = 3 × 10⁸ G. We can see in Fig. 2 that the calculated flux tends to decrease as both the viewing angle and the inclination angle decrease from 90°.
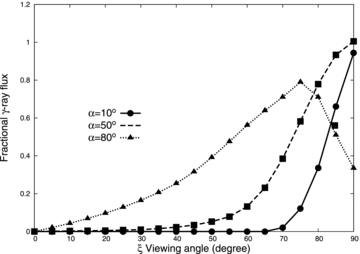
The fractional γ-ray flux as a function of the viewing angle and of the inclination angle. The fractional flux is defined by the ratio of the calculated flux measured on the Earth to f3Lsd/d2. The results are for P = 3 ms, Bs = 3 × 10⁸ G and f(Rlc) = 0.4.
We can see that the general trend of the relation between the fractional γ-ray flux and the viewing angle and inclination angle, shown in Fig. 2, is maintained for different sets of the rotation periods and magnetic fields. In this study, for simplicity, we use the relations in Fig. 2 for all sets of the rotation period and magnetic field. We assume that the inclination angle and viewing angle are randomly distributed.
However, we do not take into account the dependence of the spin-down power on the inclination angle. The pulsar spin-down can result from both the current braking torque and the magnetic dipole radiation. The former can spin-down the pulsar even if the inclination angle is zero. According to the analysis of the force-free magnetosphere done by Spitkovsky (2006), the spin-down power depends on the inclination angles as Lsd∝ 1 + sin2α; in other words, Lsd changes only by a factor of 2 with the inclination angle. With this small variation, we may expect that the general properties of the simulated distributions for the MSP’s characteristics (such as the period and the magnetic field) are not affected much by dependence on the inclination angle.
3 RESULTS AND DISCUSSION
In the Monte Carlo simulations, we generated 3 × 10⁶ MSPs with a constant birth rate over 10 Gyr. About 2100 radio MSPs were detected by the simulated radio surveys. Scaling the simulated population to the number of radio MSPs in the ATNF catalogue, ∼80, we obtain ∼10−5 yr−1 as the predicted average birth rate, which is consistent, within the uncertainties, with the other population studies (e.g. Ferrario & Wickramasinghe 2007).
3.1 Galactic distribution of MSPs
In this section, we discuss the consistency of the observed and simulated distributions of the radio MSPs. First, Figs 3(a) and (b) compare the observed (shaded histograms) and simulated (dashed lines) distributions of the radio luminosity at 400 MHz and of distance, respectively. We can see that the simulated distribution (dashed lines) qualitatively explains the observed features; for example, the peak positions of the distributions. On the other hand, we find that it is difficult to explain the sharp peak at 1–2 kpc in the observed distribution of the distance. We argue that this excess in the observed distribution is caused by several MSPs, and that the excess may be produced by enhancements of the local medium (e.g. the Gould Belt) and of the local birth rate. For example, the age of the Gould Belt is believed to be ∼107 − 8 yr (Grenier 2004). Because the birth rate of the canonical pulsars in the Gould Belt is expected to be one per 105 yr, and because the birth rates of the MSPs in the Galactic field are 2–3 orders smaller than that of the canonical pulsars, one may expect 1 per 107 − 8 yr as the birth rate of the MSPs in the Gould Belt. This indicates that several MSPs can be born within the age of the Gould Belt. If one assumes that the typical radial velocity of MSPs is  km s−1, then the displacement from the Gould Belt is d∼ 5 × 107 yr × 40 km s−1∼ 2 kpc, which is consistent with the enhancement of the peak in the distribution of the distance.
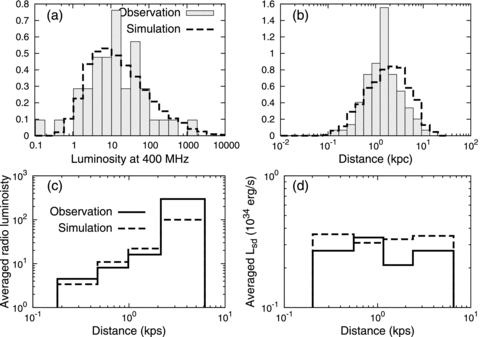
Distributions of (a) luminosity and (b) distance of the observed (shaded histograms) and simulated (dashed lines) radio MSPs. The panels (c) and (d) represent the average radio luminosity and the spin-down power for the observed (solid lines) and the simulated (dashed lines) MSPs as a function of the distance, respectively. Each bin of the solid lines contains the same number of the observed MSPs.
Figs 3(c) and (d) show the average luminosity and spin-down power, respectively, as a function of the distance. The solid and dashed lines are the results from observations and simulations, respectively, and each bin of the histograms has the same number of observed MSPs. We find in Figs 3(c) and (d) that the present simulation describes characteristics of the observations very well, that is, the average radio luminosity increases with the distance and the average spin-down power is almost constant with the distance. Finally, we can see that the simulated MSPs can reproduce the Galactic longitude and latitude distributions of the radio MSPs. On these grounds, we conclude that our simulation reproduces the Galactic distribution of the radio MSPs.
3.2 Comparison with Fermi observations
In this section, we compare the results of our simulation with the Fermi 6-month long observations. Fermi has found nine ‘radio-selected’γ-ray emitting MSPs with a flux Fγ≥ 10−11 erg cm−2 s−1 (Abdo et al 2009b; Abdo et al. 2010a,c), and that all of them are located at high Galactic latitudes, that is, |b| ≥ 5°. Abdo et al. (2010a) show that the sensitivity of the low Galactic latitudes is about a factor of 3 worse as compared to that of high Galactic latitudes. In the present simulation, therefore, we use F = 10−11 erg cm−2 s−1 for the Galactic latitudes |b| ≥ 5° and 3 × 10⁻¹¹ erg cm−2 s−1 for |b| ≤ 5° as the sensitivity requirement of the radio-selected MSPs for the 6-month long observations. Because no γ-ray-selected MSPs have been detected so far, we cannot simulate the Fermi sensitivity of the blind search for the MSPs. In this section, we show the results of our simulations by setting the sensitivity to that of the canonical pulsars, that is F = 2 × 10⁻¹¹ erg cm−2 s−1 for Galactic latitudes |b| ≥ 5° and 6 × 10⁻¹¹ erg cm−2 s−1 for |b| ≤ 5°.
Table 1 summarizes the population of the radio-selected and the γ-ray-selected MSPs detected within the simulations. Nr and Ng represent the population of the radio-selected and γ-ray-selected MSPs, respectively, detected with the Fermi 6-month sensitivity and  (i = r, g) are the populations of ‘bright’ MSPs with a γ-ray flux larger than 10−10 erg cm−2 s−1. In addition, Ni, 5 and Ni, 10 are the populations with sensitivity projected to 5- and 10-yr observations, respectively, for which the sensitivity is scaled
  , where T is the length of the observation time.
As Table 1 shows, our model predicts that only 2–3 radio-selected and 1–3 γ-ray-selected MSPs can be detected with a flux larger 10−10 erg cm−2 s−1. Although the results of the Fermi with the 6-month long observations (Abdo et al. 2009a) did not include the bright sources, it is possible that with the small population of the bright MSPs, Fermi may have missed the detection of the pulsation. The Fermi unidentified catalogue includes about 50 sources with a flux larger than 10−10 erg cm−2 s−1. We can see that the spectral behaviors of most of them are consistent with those of the known γ-ray pulsars: (1) they are steady sources in the sense that the variability index defined in Abdo et al. (2010b) is smaller than 23, and (2) the spectra above 100 MeV cannot be fitted well by single power law, that is, the curvature index, C (defined in Abdo et al. 2010b), is ≥10. Although most of them may be canonical γ-ray pulsars (cf. Takata et al. 2011) or active galactic nuclei (Abdo et al. 2010d), it is very likely that a small fraction, in particular, high Galactic sources, are γ-ray emitting MSPs (see Section 3.4). Recently, Ransom et al. (2011) reported the discovery of three radio MSPs associated with the Fermi unidentified bright sources, suggesting that our results are quite consistent with the observations.
Applying the sensitivity of Fermi 6-month long observation, our model predicts 9–13 radio-selected γ-ray MSPs, which is consistent with the nine MSPs with Fermi observations. We also predict 22–35 γ-ray-selected MSPs, whereas Fermi has had no such detections so far. For the canonical pulsars, the sensitivity of the blind search is about a factor of 2 worse as compared to that of the radio-selected pulsars (Abdo et al. 2010a). The population of the γ-ray-selected pulsars is roughly comparable with that of the radio-selected γ-ray pulsars. On the other hand, it is expected that the detection of the rotation period from the MSPs (in particular in binary systems) by the blind search is even harder and the sensitivity is much worse than that of the canonical pulsars.
Fig. 4 compares the cumulative distributions of the various characteristics of the observed nine (solid lines) γ-ray MSPs detected by Fermi (Abdo etal. 2009b; Abdo et al. 2010a,b,c) and the simulated (dashed lines) radio-selected γ-ray MSPs. The results are for fmax=fcrit. We performed a Kolmogorov–Smirnov (KS) test to compare the two cumulative distributions. In Fig. 4, we present the maximum deviation (Dmax) between the two distributions and the p-value (PKS) of the KS test for each pulsar characteristics. Since the simulated sample has more than 400 pulsars, we used the one-sample KS statistic. For example, the p-value for the rotation period is PKS∼ 0.75, suggesting that the hypothesis that the two distributions are drawn from the same distribution cannot be rejected at better than 25 per cent confidence level. We find in Fig. 4 that for all distributions except that for the flux distribution, the hypothesis cannot be rejected at better than 60 per cent, indicating that the model distributions are consistent with the observations.
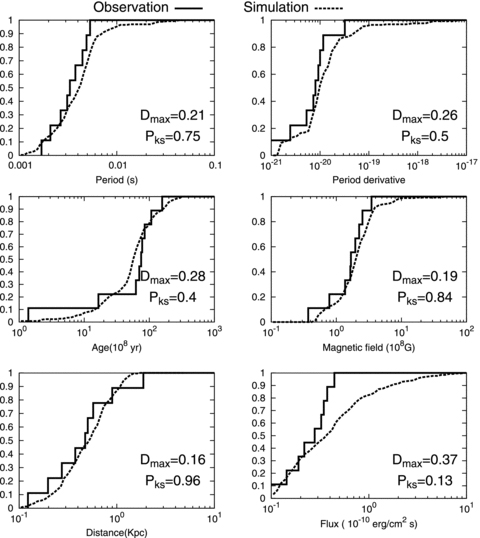
Cumulative distributions for the various characteristics of the observed (solid lines) and simulated (dashed lined) radio-selected γ-ray MSPs with the sensitivity of the Fermi 6-month long observation. The maximum difference (Dmax) and the p-value of KS test (PKS) are also displayed. The intrinsic values, that is, the values without the Shklovskii effect, are also represented.
For the γ-ray flux (right-bottom panel in Fig. 4), the result of the KS statistic provides a relatively low p-value, as compared to other characteristics. This is because all the nine MSPs detected by Fermi have a γ-ray flux smaller than 10−10 erg cm−2 s−1, while the model predicts that about 20 per cent of γ-ray MSPs have a flux larger than 10−10 erg cm−2 s−1. However, we note that the difference between the observed and simulated distributions is caused by only one or two MSPs. Hence, if several MSPs with a bright γ-ray emissions of Fγ≥ 10−10 erg cm−2 s−1 have been missed by the Fermi observations, the model distribution is not in conflict with the observations. It is important to note that our simulation results are based on the existing radio sensitivities of pulsar surveys. Any deep radio search implies increasing the radio sensitivities and consequently some γ-ray-selected MSPs can become radio-loud. In fact, several radio MSPs have been detected by deep search for the radio emissions from bright Fermi unidentified sources (Ransom et al. 2011). These radio-loud γ-ray MSPs are defined as γ-ray-selected MSPs in our simulations.
As Table 1 shows, the model predicts that the population of radio-selected γ-ray MSPs increases by only about 10 over the 5 yr (or 10 yr) of Fermi observations. This implies that most of the presently known radio MSPs (∼80) might not be discovered by Fermi. However, the predicted radio-loud γ-ray MSPs depend on the sensitivity of radio surveys, as we can see in Table 2. For the γ-ray-selected MSPs, the simulation predicts that Fermi can detect at least 100 sources. As we will discuss in Section 3.4, we expect that these simulated γ-ray-selected MSPs correspond to the Fermi unidentified sources. As we have emphasized before, we predict that more and more radio MSPs will be confirmed among the Fermi unidentified sources by a deep search of the radio emissions.
Population of the simulated radio-selected and γ-ray-selected MSPs for the different radio surveys and projected mission lengths of Fermi (6 months, 5 yr and 10 yr). A2 and P2 represent the Arecibo 2 and Parks 2 surveys. ‘All’ represents all radio surveys listed in Table 1 of Takata et al. (2010b) and ‘All× 2’ shows the results from all the radio surveys but we increase the sensitivity of each survey by a factor of 2. In addition, the intrinsic populations, that is, the populations associated with only beaming effects of the radio emission, are shown in the bottom line. In this extreme limit, most Fermiγ-ray pulsars become radio-selected γ-ray pulsars.
| 6 month | 5 yr | 10 yr | ||||||||||
| fmax=fcrit | fmax = 1 | fmax=fcrit | fmax = 1 | fmax=fcrit | fmax = 1 | |||||||
| Nr | Ng | Nr | Ng | Nr,5 | Ng,5 | Nr,5 | Ng,5 | Nr,10 | Ng,10 | Nr,10 | Ng,10 | |
| A2, P2 | 5 | 25 | 7 | 40 | 9 | 105 | 12 | 168 | 10 | 162 | 14 | 255 |
| All | 9 | 22 | 13 | 35 | 15 | 101 | 22 | 161 | 17 | 157 | 25 | 248 |
| All (×2) | 16 | 18 | 23 | 30 | 26 | 93 | 37 | 150 | 29 | 148 | 42 | 234 |
| Intrinsic | 61 | 3 | 88 | 6 | 226 | 10 | 329 | 27 | 331 | 16 | 484 | 41 |
Story et al. (2007) studied the population of γ-ray MSPs by using the slot gap accelerator model and predicted that Fermi would detect about 12 radio-loud and 33–40 radio-quiet γ-ray MSPs. On the other hand, our outer gap model tends to predict more γ-ray (in particular radio-quiet) MSPs than the slot gap model. Also, the present simulation predicts a larger ratio between the radio-quiet and radio-loud MSPs (∼6–7) than that predicted by the slot gap model (∼3), although the ratio depends on the simulated sensitivities of the Fermi and radio observations (Sections 3.3 and 3.4).
3.3 Population of γ-ray MSPs
In Fig. 5, we summarize the population of the γ-ray emitting MSPs detected within the simulation as a function of the threshold energy flux of the γ-rays. The solid lines and dashed lines represent the population of the radio-selected and γ-ray-selected γ-ray MSPs, respectively. The thick and thin lines represent results for the maximum fractional gap thickness of fmax=fcrit and fmax = 1, respectively. For example, the present simulation predicts that ∼2–3 and ∼10–14 radio-selected γ-ray MSPs irradiate the Earth with a γ-ray flux Fγ≥ 10−10 and Fγ≥ 10−11 erg cm−2 s−1, respectively. For the radio-quiet γ-ray MSPs, about 100 sources with a flux larger than 10−11 erg cm−2 s−1 irradiate the Earth.
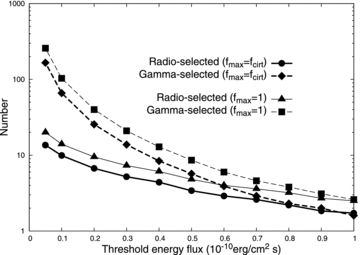
The simulated numbers of the radio-selected (solid line) and γ-ray-selected (dashed line) γ-ray MSPs as a function of the threshold energy flux.
We can see in Fig. 5 that the number of γ-ray-selected MSPs increases more rapidly than that of the radio-selected γ-ray MSPs and that the ratio of the γ-ray-selected to radio-selected γ-ray MSPs increases with decreasing threshold energy flux. As the threshold of γ-ray energy flux decreases, the γ-ray emissions from more distant MSPs can be detected in the simulations. On the other hand, because we fix the sensitivity of the radio surveys in Fig. 5, the radio emissions from those distant MSPs may not be detected by the radio surveys. As a result, more γ-ray-selected MSPs are detected in the simulations as the threshold flux decreases. In fact, if we count all the γ-ray MSPs irradiating the Earth with radio emissions as the radio-selected pulsars, the ratio would not depend on the threshold energy flux of the γ-ray emissions.
Fig. 6 shows contours of the two-dimensional distribution in the rotation period and the period-time derivative of the simulated MSPs with a γ-ray flux Fγ≥ 10−11 erg cm−2 s−1. We present the distributions of all the simulated MSPs including the radio-selected and γ-ray-selected pulsars, because the two distributions do not differ much from each other. The left-hand panel shows the distributions using the period time derivative for the intrinsic value, and the right-hand panel represents the period time derivative for the ‘observed’ value, that is, the value after adding the Shklovskii effect described by equation (12). The solid, dashed and dotted lines represent 10, 50 and 100 per cent of the total MSP population. We can see that the Shklovskii effect slightly shifts the peak of the distributions towards longer rotation periods and larger period time derivatives. For the observational distributions (right-hand panel), about 50 per cent of the γ-ray emitting MSPs can be detected with a rotation period of P∼ 0.003–0.008 s and a period time derivative  . This information can be used to narrow down the parameter range for a blind search to detect the rotation period from Fermi unidentified sources.

Contours of the two-dimensional (rotation period and period time derivative) distributions of the simulated MSPs with the sensitivity of the Fermi 6-month long observation; (a) intrinsic period time derivative and (b) ‘observed’ period time derivative adding Shklovskii effect. More MSPs are located within the solid lines. Within solid, dashed and dotted lines, 10, 50 and 100 per cent of the total MSPs are populated.
3.4 Origin of the Galactic Fermi unidentified steady sources
As Fig. 5 shows, our simulation predicts that about ∼200 γ-ray MSPs irradiate the Earth with a flux Fγ≥ 5 × 10⁻¹² erg cm−2 s−1 and with the present sensitivity of radio surveys most of them are categorized as γ-ray-selected MSPs. Therefore, it is likely that although millisecond pulsed emission has not been confirmed yet, the γ-ray MSPs contribute to the Galactic unidentified Fermi sources, such as the newly discovered 20 radio MSPs associated with the Fermi unidentified sources (Caraveo 2010; Ray 2010; Ransom et al. 2011).
Fig. 7 plots the curvature index (C) and the variability index (V) of the Fermi sources; a curvature index larger than 11.34 indicates a less than 1 per cent chance that the power-law spectrum is a good fit above 100 MeV, and a variability index larger than 23.21 indicates less than a 1 per cent chance of being a steady source [see Abdo et al. (2010b) for the exact definition of C and V indexes]. The filled circles, boxes and triangles correspond to the pulsars, active galactic nuclei (AGN) and Fermi unidentified sources. In Fig. 7, we can easily see that the pulsars and the AGN belong to different groups in the C–V plane, that is, the pulsars belong to C≥ 5 and V≤ 20, whereas AGN belong to wide range of variability index, which may indicate a correlation between the C index and V index (that is, C∝V). Most of the Fermi unidentified sources have the V index smaller than ∼30, with the C-index larger than 0.1. Fig. 7 indicates that the Fermi unidentified sources can be either pulsars or AGN.
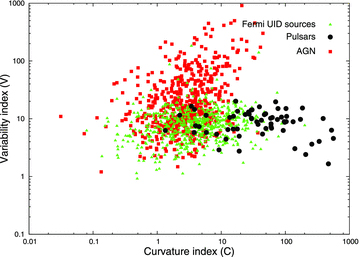
Plots for the curvature index and the variability index of the Fermi sources (Abdo et al. 2010b). The filled circles, and boxes and triangles are the pulsars, AGNs, and the Fermi unidentified sources, respectively.
In Fig. 8, we plot the Galactic distributions of the Fermi unidentified steady sources for C < 5 (solid line) and C≥ 5 (dashed line). It is clear from Fig. 8 that the two lines represent different distributions with respect to each other. The solid lines show relatively constant distributions for the Galactic longitudes and latitudes, indicating that most of the Fermi unidentified sources with C < 5 (dashed lines) distribute isotropically in the sky, and may be related to extragalactic (or Galactic halo) sources. For the dashed lines, on the other hand, the distributions for the Galactic longitudes and latitudes coordinate show peaks at the Galactic Centre and at the Galactic disc, respectively, suggesting that the Fermi unidentified steady sources with C≥ 5 are associated with Galactic objects.
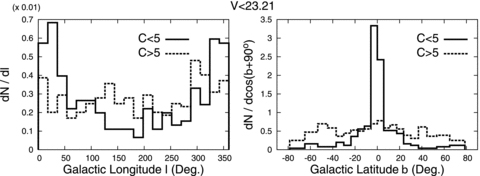
The distributions in Galactic coordinate longitudes (left) and latitudes (right) of the Fermi unidentified steady sources. The solid and dashed lines are the results for C < 5 and C≥ 5, respectively.
In Fig. 9, we compare the distributions of the Galactic longitudes (left-hand panel) and latitudes (right-hand panel) for the unidentified Fermi sources with V≤ 23.21 and C≥ 5 (solid line) and the simulated γ-ray MSPs (dashed line), with a flux Fγ≥ 10−11 erg cm−2 s−1. The latitude distribution of the γ-ray emitting canonical pulsars (dotted line) simulated in Takata et al. (2011) and the Galactic distributions for known radio MSPs (dotted lines) are also plotted in the figure.
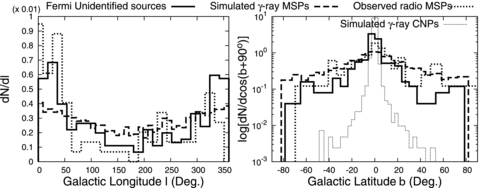
The distributions of Galactic longitudes (left) and latitudes (right) of the Fermi unidentified point sources with V≤ 23.21 and C≥ 5 (solid lines), the simulated γ-ray MSPs (dashed lines) and observed radio MSPs (dotted lines). The distribution of Galactic latitudes of the simulated γ-ray emitting canonical pulsars (CNP) in Takata et al. (2010b) are also plotted in the right-hand panel (thin dotted line).
In Figs 9 we can see that the distributions of the simulated γ-ray MSPs and of the observed radio MSPs are consistent with that of the Fermi unidentified sources, that is, (1) three longitude distributions have a peak around the direction of the Galactic Centre l = 0° and become minimum around l∼ 180°, and (2) the latitude distributions have a peak at the Galactic plane (b = 0) and then they decrease with the increase of the Galactic latitudes. In particular, the MSPs can explain the distributions of the Fermi unidentified sources located above the Galactic plane |b| ≥ 10, which cannot be explained by the canonical γ-ray pulsars, as the right-hand panel in Fig. 9 shows; the γ-ray emitting canonical pulsars can mainly explain the unidentified sources located in the Galactic plane. Since the MSPs are in general older than the canonical pulsars, a higher fraction of the γ-ray MSPs, as compared to the canonical pulsars, is located at higher Galactic latitudes. On these grounds, we conclude that γ-ray emitting MSPs are more plausible as candidates for the origin of the majority of the Galactic Fermi unidentified steady sources located in high Galactic latitudes.
We note that new radio MSPs have been discovered in the direction of about 20 unidentified Fermi sources by the radio searches for individual sources (e.g. Caraveo 2010; Ray 2010; Ransom et al. 2011). These γ-ray-selected radio-loud MSPs can be classified as the γ-ray-selected radio-quiet sources in the present simulation, because we do not take into account the radio search for the specific sources. In Table 2, on the other hand, we present how the population of γ-ray emitting MSPs depends on the sensitivity of radio surveys. We used the Arecibo 2 (A2) and Parks 2 (P2) surveys (the first row), all the radio surveys (the second row) listed in Table 1 of Takata et al. (2011) and all radio surveys but we increase by a factor of 2 the sensitivity of each survey (third row). The intrinsic populations, that is, the populations associated with only beaming effects of the radio emission, are shown in the bottom row.
We can see in Table 2 that the number of radio-selected pulsars increases with increasing sensitivity of the radio surveys, whereas the number of γ-ray-selected pulsars decreases. This is because if we increase the sensitivity of the radio surveys, some of the γ-ray-selected MSPs irradiating the Earth with the radio emissions may be reclassified as radio-selected γ-ray pulsars. As the bottom row in Table 2 shows, the intrinsic ratio of the radio-loud and radio-quiet γ-ray MSPs is 10 ∼ 20, indicating that most of the γ-ray emitting MSPs irradiate the Earth with a corresponding radio emission. Therefore, our prediction is that as the sensitivity of the radio observations will improve in the future, more and more radio MSPs will be discovered among the Fermi unidentified sources.
In Fig. 10, we present the distributions of the various characteristics of the observed γ-ray MSPs (shaded histograms), including the 20 new radio MSPs associated with Fermi unidentified sources, and the simulated γ-ray MSPs (dashed lines) with the simulated sensitivity of the Fermi 6-month long observation. For the simulated distribution, both the radio-selected and γ-ray-selected MSPs are taken into account. For the observations, we were able to obtain information of the rotation period for seven out of the 20 radio MSPs and the distances for three MSPs (Ray 2010; Ransom et al. 2011). Therefore, the distributions of the rotation period and of the distance in Fig. 10 are obtained from 16 (nine known Fermi MSPs plus seven radio MSPs) and 12 samples, respectively. The distributions of the period time derivative, the magnetic field and the spin-down age include only nine known Fermi MSPs, because we could not find any references for the intrinsic period time derivative of the 20 radio MSPs. The γ-ray fluxes of the 20 radio MSPs are taken from the Fermi first catalogue (Abdo et al. 2010b,1) and Ransom et al. (2011). In Fig. 10, we also indicate the p-values (Pks) of the KS test. As Fig. 10 shows, the simulated distributions are qualitatively consistent with the observations (e.g. the position of the peak of the distributions). For the γ-ray flux, however, the p-value of the KS test is much lower than those of the other characteristics, indicating that the two distributions cannot be drawn from the same distribution. Because it is expected that the γ-ray emissions from the 20 radio MSPs associated with Fermi unidentified sources will be composed of a pulsed and an unpulsed component, the extraction of the pulsed component, that is, the detection of the pulsed period with Fermi, is required to constrain our model.
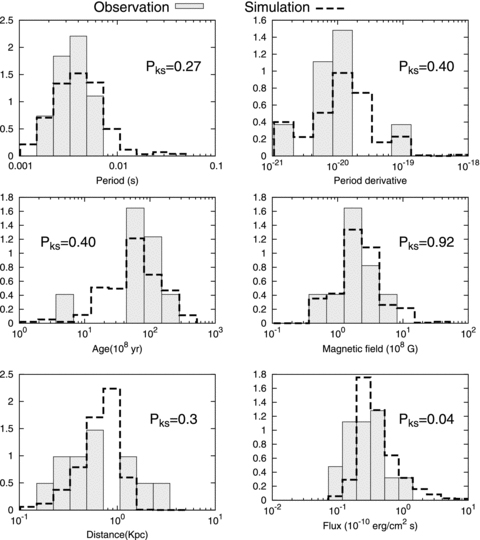
Distributions of the various properties of the observed (shaded histograms) and of the simulated (dashed lines) MSPs. In addition to the nine known γ-ray MSPs, the observed distributions of the rotation period and of the distance includes seven and three radio MSPs, respectively, associated with the Fermi unidentified sources. For the γ-ray flux, the observed distributions include 20 radio MSPs associated with the Fermi unidentified sources. For the simulation, both radio-selected and γ-ray-selected MSPs are included in the distributions.
We have assumed that MSPs are activated as the rotation-powered pulsar as a result of the accretion process from the companion star. Recently Takata et al. (2010b) argued that the outer gap activities of MSPs can be turned on in the quiescent state of low-mass binary systems, for example PSR J1023+0038 (Archibald et al. 2009). The geometry of the outer gap can direct the γ-rays emitted from the gap towards the companion star and the accretion disc. Consequently, the accretion disc can be evaporated, and the companion star becomes brighter due to the irradiation of γ-rays. If the high-latitude unidentified sources of Fermi are indeed MSPs, some of them may be low-mass binaries in a quiescent state. We expect them to be associated with abnormally bright stars with short orbital period. By searching the orbital periods of the optical companion stars, we may be able to obtain the spin periods of the radio-quiet MSPs from the γ-ray data.
4 CONCLUSION
We have studied the population of the γ-ray emitting MSPs using Monte Carlo techniques. We have applied the outer gap model with a switching of the gap closure process from the photon–photon pair-creation model to the magnetic pair-creation model, as suggested by Takata et al. (2010a). Using the sensitivity of the Fermi 6-month long observations, 9–13 radio-selected γ-ray MSPs are detected within the simulation, which is consistent with the present nine Fermi MSPs. The simulated distributions for the various characteristic of the radio-selected γ-ray pulsars are consistent with the present Fermi observations (Fig. 4). Scaling the observed sensitivity  , the present model predicts that Fermi should detect 15–22 radio-selected γ-ray MSPs and 95–152 γ-ray-selected MSPs over its 5-yr mission (Table 1).
Our simulation predicts that about 100 (or 200–300) γ-ray MSPs irradiate the Earth with a flux F≥ 10−11 erg cm−2 s−1 (or 5 × 10⁻¹² erg cm−2 s−1), and most of them are categorized as γ-ray-selected pulsars with the present sensitivity of radio surveys (Fig. 5). Our simulation also predicts that about 50 per cent of the γ-ray emitting MSPs will be detected with a rotation period in the range of P∼ 3–8 ms and a period time derivative in the range of  . We further argue that γ-ray emitting MSPs are plausible as candidates for the Galactic Fermi unidentified steady sources, located in high Galactic latitudes. Our simulation implies that some of the radio-quiet γ-ray MSPs can be changed to radio-loud γ-ray MSPs as the simulated sensitivity of radio surveys increases. Therefore, we predict that more and more radio MSPs will be discovered in the Fermi unidentified sources as the radio sensitivity is improved.
We thank A. H. Kong, C. Y. Hui, B. Rudak, M. Ruderman, R. E. Taam and S. Shibata for the useful discussions, and T. Harko and K. MacKeown for a critical reading of our manuscript. We express our appreciation to an anonymous referee for insightful comments. We also thank the Theoretical Institute for Advanced Research in Astrophysics (TIARA) operated under the Academia Sinica Institute of Astronomy and Astrophysics, Taiwan, which enabled JT to use the PC cluster at TIARA. KSC is supported by a 2011 GRF grant of the Hong Kong SAR Government entitled ‘Gamma-ray Pulsars’.
REFERENCES
