


Abstract
Focal ratio degradation (FRD) is a major contributor to light loss in astronomical instruments employing multimode optical fibres. We present a powerful diagnostic model that uniquely quantifies the various sources of FRD in multimode fibres. There are three main phenomena that can contribute to FRD: scattering, diffraction and modal diffusion. We propose a Voigt FRD model where the diffraction and modal diffusion are modelled by the Gaussian component and the end-face scattering is modelled by the Lorentzian component. The Voigt FRD model can be deconvolved into its Gaussian and Lorentzian components and used to analyse the contribution of each of the three major components. We used the Voigt FRD model to analyse the FRD of modern astronomical grade fibre for variations in (i) end-face surface roughness, (ii) wavelength, (iii) fibre length and (iv) external fibre stress. The elevated FRD we observed was mostly due to external factors, i.e. fibre end effects such as surface roughness, subsurface damage and environmentally induced microbending caused by the epoxy, ferrules and fibre cable design. The Voigt FRD model has numerous applications such as a diagnostic tool for current fibre instrumentation that show elevated FRD, as a quality control method for fibre manufacture and fibre cable assembly and as a research and development tool for the characterization of new fibre technologies.
1 INTRODUCTION
Multimode optical fibres have been used as light pipes in astronomical instrumentation for the past 30 yr because of their unique ability to take light from the telescope focal plane and spatially reformat it at a distant image plane. This has revolutionized spectroscopy by enabling a remotely mounted highly stable single object, multi-object and integral-field unit spectrographs. Future applications of fibres in astronomy require a better understanding of how light propagates and evolves in a multimode fibre.
One major manifestation of light loss in systems employing multimode optical fibres is focal ratio degradation (FRD; Nelson 1988; Ramsey 1988).
In a perfect fibre, the light would emerge at the same f-ratio as it entered (for a straight length of fibre, i.e. no bends); however, due to minor imperfections in the fibres the emergent light is more divergent (faster f-ratio) than the input beam. This beam spreading can result in a loss either in throughput or in resolution in astronomical spectroscopic applications (Parry 1998, 2006). In order to reduce the possible light losses in multimode fibre-based systems, instrument designers need to quantify FRD and minimize its impact prior to designing the instrument components such as the spectrograph collimator. If the FRD is such that the beam spreads out beyond the collimator, then there will be a loss in throughput and potential scattered light contamination in the spectrograph if the baffling is insufficient.
Researchers have been performing FRD measurements on fibres ever since the first multifibre systems were used in astronomy over 30 yr ago (Angel, Adams & Boroson 1977; Barden 1998; Ramsey 1988). However, there have been some inconsistencies in the results reported by different researchers, even for fibres from the same manufacturer and the same type. Much of this has been attributed to varying measurement techniques and fibre end preparation techniques (Avila 1998) indicating a need to standardize measurement techniques.
There are three main phenomena that can contribute to FRD: scattering, diffraction and modal diffusion. These effects are influenced by various factors, including material irregularities (impurities and variations in the density of the glass), fibre geometry irregularities (changes in concentricity, variations in circularity and diameter of the fibre), macrobending, microbending, end-face surface roughness, subsurface damage caused by the lapping/polishing process (Hed & Edwards 1987; Collier & Schuster 2005) and fibre geometry. Some of these contributions to FRD can be very sensitive to the external environment and are likely responsible for the diverse results reported by researchers (Craig & Hailey 1988; Avila 1998).
Two FRD measurement techniques commonly used are the cone (Lee, Haynes & Skeen 2001; Murphy et al. 2008) and the parallel laser beam methods (Ferwana et al. 2004; Haynes et al. 2004, 2008). In the cone technique a cone of light, set to a particular f-ratio, is injected into the fibre and the FRD is measured from the encircled energy (EE) within a given f-ratio at the output. This technique gives a good estimate of the total light loss that might be expected in a fibre-based system, but it is sensitive to alignment errors and does not provide information about the possible causes of the FRD. The parallel laser beam technique uses a collimated laser beam to inject light into the fibre at selected angles (f-ratios) and the FRD is determined from the radial profile width on output (Haynes et al. 2004). This technique is highly sensitive to small changes in FRD and is commonly used as a rapid diagnostic technique. In the past, this method has been used to quantify FRD by assuming the radial profile to be Gaussian and measuring the full width at half-maximum (FWHM). However, this method can underestimate the FRD if the output distribution deviates away from a Gaussian profile due to effects such as scattering (Haynes 2008).
In this paper, we use the parallel laser beam technique and methodology and present a Voigt FRD model that simulates an FRD distribution in the presence of scattering, diffraction and modal diffusion. We show, in a step-wise fashion, how this model can be used as a diagnostic tool to identify, quantify and potentially minimize sources of FRD and improve the fibre system performance. We first concentrate on the scattering contribution caused by the fibre end-face surface roughness in order to model its contribution to FRD. This then permits deconvolution of the other contributions due to modal diffusion and diffraction.
2 BACKGROUND
2.1 Scalar scattering theory
Scalar scattering theory, otherwise known as surface roughness scattering theory, is often used to determine the ratio of specular transmittance/reflectance to diffuse (scattering) transmittance/reflectance for a given surface roughness (Bennett & Mattsson 1999; Lindstrom & Ronnow 2000). It does not provide any information on the angular distribution of the diffuse (scattered) light. Scalar scattering theory also has other limitations and is only valid if the surface structure has a Gaussian autocovariance function (ACF) and a Gaussian scattering function, and if the surface roughness is much smaller than the wavelength of light.
Equation (1) can be used to calculate the scattering on transmission for each end of an optical fibre if the surface roughness is known. This equation is no longer valid if the scattering profile deviates away from a Gaussian shape, and it typically underestimates the amount of scattering. This highlights the need to determine the scattering profile from a polished fibre end face.
2.2 Surface roughness characterization
Qualitative analysis of surface roughness can be done in a number of ways but the optical profiler is perhaps the most versatile. Optical profilometers use a non-contact method based on white light interferometry to measure the surface height variations from a mean surface level and express it as an rms roughness value δ. Some optical profilers can also calculate the ACF and the power spectral density (PSD). The ACF is a measure of the correlation properties of the surface roughness and gives information about the average lateral dimensions of bumps (e.g. average intervals between scratches on a polished surface) and/or pits (e.g. digs, scratches, grooves in a ground surface) (Bennett & Mattsson 1999). The Fourier transform of the ACF gives the scattering factor or PSD. The PSD represents the spatial frequency spectrum of the surface roughness measured in inverse length units and can be used to calculate the angular properties of the scattered light (Bennett 1976; Elson & Bennett 1979).
It is well documented that two different ACFs can describe the surface roughness of polished fused silica, a Gaussian ACF or an exponential ACF (Bennett 1976; Elson & Bennett 1979; Rasigni et al. 1983a,b; Marx et al. 1993). If the ACF of a surface is represented by a Gaussian, then the scattering function is also a Gaussian. Further, if the ACF of a surface is represented by an exponential, then the scattering function is a Lorentzian (Fourier transform of an exponential is a Lorentzian) (Bennett 1976; Elson & Bennett 1979; Rasigni et al. 1983a,b; Marx et al. 1993). In the following sections, we determine which of the two scattering functions fits the scattering profile from a polished fibre end face.
2.3 FRD components and modelling
There are three major components of FRD: diffraction, modal diffusion and fibre end-face scattering. In order to model FRD, all three components need to be accurately represented by a mathematical function that can describe the resultant far-field intensity distribution.
Circular aperture diffraction is modelled by a Bessel function of the first kind (Hecht 1987); however, a Gaussian approximation is often used (Zhang et al. 2007). For ease of calculations, this body of work also assumes a Gaussian approximation.
Modal diffusion in highly multimode fibres has been successfully modelled as a Gaussian process, i.e. the probability of power exchange between neighbouring modes follows Gaussian statistics. Random irregularities of fibre configuration and straightness are associated with the diffusion process, and it has been demonstrated that the angular power distribution of the FFP eventually evolves to a Gaussian-like shape if sufficient modal diffusion occurs (Gloge 1972; Snyder & Love 1983). There are many processes that contribute to modal diffusion, such as Rayleigh scattering, Mie scattering, microbending and macrobending (Gloge 1972; Craig et al. 1988; Nelson 1988; Ramsey 1988; Bunge, Kruglov & Poisel 2006).
Fibre end-face surface roughness can be modelled as a Gaussian or Lorentzian process depending on the surface structure; this is the main topic of investigation in the following sections.
We propose to model the far-field radial intensity profile with a Voigt function which is a convolution of a Gaussian function and a Lorentzian function. The Gaussian function represents the diffraction and the modal diffusion components of FRD, and the Lorentzian function represents the non-Gaussian end-face scattering component of FRD.
 and ΓL = 2γ.
To model the radial profile with a Voigt profile, we need to find the contribution from each point on the circle to each point on the radial line OP (see Fig. 1).
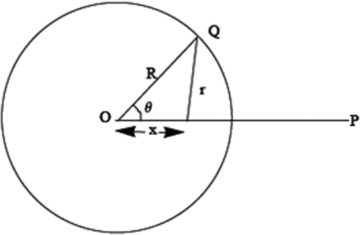
Diagram of the radial profile model.
3 EXPERIMENTAL METHOD
3.1 Fibre end preparation
For ease of handling and polishing, the optical fibres are typically mounted individually in rigid ferrules with polyimide strain relief tubes or multiple fibre v-groove assemblies. To fix the fibre in the mount, appropriate epoxy, tubing and ferrule/v-groove material must be selected to minimize mechanical stress (Lee et al. 2001). To avoid differential expansion, ceramic or silica ferrules, and quartz and silicon v-grooves that have similar coefficients of thermal expansion are typically used. It is well known that despite the best precautions, this process of mounting the fibre end can lead to mechanical deformation of the fibre and increases FRD via the formation of microbends (Nelson 1988; Lee, Haynes & Skeen 2001; Oliverira, Oliverira & das Santos 2005).
Because our principal investigation was the effect of surface roughness it was less critical for the coefficients of thermal expansion to match the fibre and ferrules, as all tests were done at a constant room temperature. For ease of preparation, we used stainless steel ferrules and Araldite Super strength epoxy. Araldite epoxy can cause elevated fibre stress (microbending). The stress is constant and our measurements are relative; therefore, it does not bias our FRD model.
Often, fibres are not cleaved prior to polishing but rather cut with a scalpel or ceramic blade. This can cause subsurface damage in the form of cracks running down the length of the fibre. To remove such subsurface damage in the lapping process requires a large amount of material to be removed which is very time consuming. We minimized this form of subsurface damage by cleaving the fibres prior to mounting and then polishing.
The fibre type used in the tests is typical of that used in astronomy (i.e. Polymicro FBP140168198 with a core diameter of 140 μm and polyimide buffer). The polyimide buffer was first stripped via a hot flame. The fibres were then cleaved using an Ericsson EFC11 ultrasonic cleaver with a constant fibre tension. Care must be taken when using a hot flame as fibres with core diameters of <100 μm can be easily overheated. This can cause variations in the refractive index which are a source of FRD.
Three test fibres of 1.2 m in length had the input end mounted into a stainless steel ferrule with a polyimide strain relief tube in preparation for polishing. The output end remained cleaved so that the output surface roughness was constant and no extra external stress was introduced via epoxy and ferrule. After an initial grinding with coarse 27-μm grit emery paper, wet lapping/polishing was done by hand consecutively with 12-, 3-, 1- and 0.3-μm lapping films.
Two additional test fibres were prepared with both input and output ends cleaved, using the same buffer stripping and cleaving process. One fibre was 1.2 m in length and the other was 70 m in length.
3.2 Fibre end-face surface structure measurements
At each lapping/polishing step, the test fibres were inspected and imaged with an Olympus DIC microscope and the surface roughness and PSD measured using a non-contact optical profiler (WYKO NT3300) in vertical scanning interferometry (VSI) mode. Fig. 2 shows images of two test fibre end faces examined by the DIC microscope and the optical profiler. Table 1 shows the measured rms surface roughness after each lapping step.
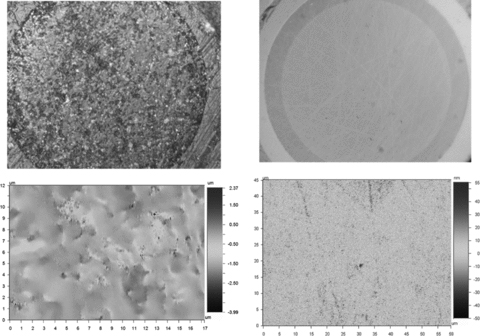
DIC microscope image 100× objective (top) and profilometer surface contour plot resolution 0.08 μm (bottom). Left-hand column: 12-μm lapping step (δ = 245-nm rms). Right-hand column: 0.3-μm lapping step (δ = 8-nm rms).
Fibre end-face surface roughness after each lapping step, measured with the WYKO optical profilometer.
| Lapping paper grade (μm) | Fibre end-face surface roughness (nm rms) (error ±0.2 per cent) |
| 12 | 245 ± 0.49 |
| 3 | 164 ± 0.33 |
| 1 | 12 ± 0.02 |
| 0.3 | 8 ± 0.02 |
| Lapping paper grade (μm) | Fibre end-face surface roughness (nm rms) (error ±0.2 per cent) |
| 12 | 245 ± 0.49 |
| 3 | 164 ± 0.33 |
| 1 | 12 ± 0.02 |
| 0.3 | 8 ± 0.02 |
The optical profilometer was calibrated for VSI measurements using the appropriate calibration step, prior to the measurement of the test fibres. The step height was 9.92 ± 0.08 μm. Successful calibration of the system required the error to be less than ±0.5 per cent of the nominal step height. The error for each calibration run was consistently ±0.2 per cent. The cleaved ends of the fibres were measured to have a surface roughness of approximately 25-nm rms.
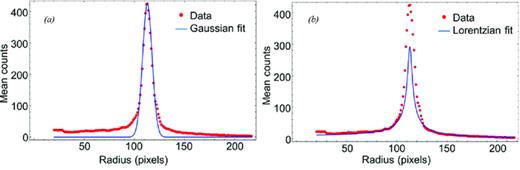
Figs 3 and 4 show the calculated scattering profiles for  for the smoothest fibre end face and the roughest fibre end face listed. Both Lorentzian and Gaussian functions were fitted to the data to demonstrate the most likely scattering profile.
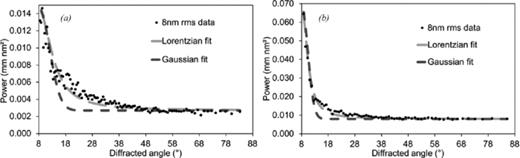
Gaussian and Lorentzian fits to the scattering profiles calculated from the PSD profilometer measurements. For a surface roughness of 8-nm rms: (a) x average data and (b) y average data.
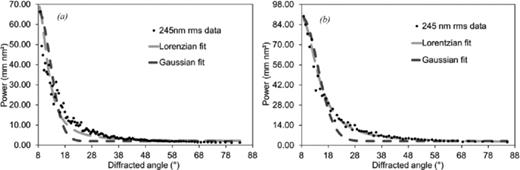
Gaussian and Lorentzian fits to the scattering profiles calculated from the PSD profilometer measurements. For a surface roughness of 245-nm rms: (a) x average data and (b) y average data.
The plots in Figs 3 and 4 indicate that a Lorentzian profile is a better fit to the scattering data for both the smoothest and roughest fibre end face in the test sample. In the following sections, the scattering function is further investigated using the parallel laser beam method to examine the far-field intensity distribution (FRD distribution) of the fibre.
3.3 Parallel beam method
The far-field pattern (FFP) of a fibre is a direct representation of the modal power distribution, diffraction and scattering and is sometimes referred to as the FRD distribution or the FRD ring. We examine the fibre FFP using the parallel laser beam set-up shown in Fig. 5. An expanded collimated laser beam (HeNe at 632.8 nm or Nd:YAG at 1064/532 nm) was injected into the fibre mounted on an x–y–z–θ translation stage set to various launch angles. The fibre output was projected on to a semitransparent screen to display the FFP. The FFP was re-imaged with an f/2 lens on to the CCD camera (a Peltier cooled SBIG ST-7, 765 × 510 pixels), giving 15 pixels per radial degree. The CCD images of the FFPs were saved as fits files.
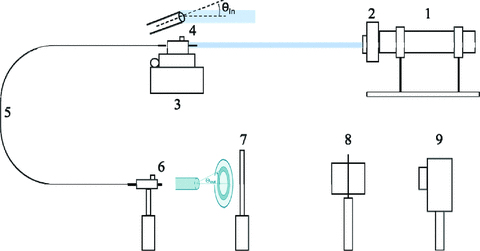
Diagram of the parallel laser beam experimental apparatus: 1: HeNe laser or Nd:YAG laser; 2: spatial filter and collimator; 3: x–y–z–θ stage; 4: fibre input; 5: fibre; 6: fibre output; 7: screen; 8: re-imaging lens, and 9: CCD camera.
Fig. 6 shows the FFPs of a fibre prepared with varying end-face surface roughnesses at the input and a constant end-face surface roughness of ∼25-nm rms (cleave) at the output. The images are a result of 632.8-nm light injected at an angle of 8° which is equivalent to an f-ratio of f/3.6.
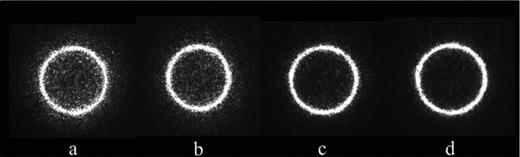
fits images of the FFP for a test fibre with various end-face surface roughnesses: (a) 245-nm rms, (b) 164-nm rms, (c) 12-nm rms and (d) 8-nm rms. θin = 8°=f/3.6, λ = 632.8 nm.
The radial profile was extracted for each such far-field measurement. An integration was also necessary in order to smooth out the interference patterns (laser speckle) observed in the far-field light distribution due to the extremely coherent laser source. As a comparison and demonstration of the relative change in the performance of the fibres, we also used the parallel laser beam technique to calculate the EE on output for a given f-ratio. The method is not absolute as we integrate only for rays at f/3.6, potentially underestimating the EE. It does, however, provide a quick and easy way of quantifying FRD for relative fibre-to-fibre comparisons.
4 RESULTS AND DISCUSSION
4.1 Fibre end-face scattering function
In this section, we apply the Voigt FRD model outlined in Section 2.3. A Voigt least-squares fit (using equation 8) was applied to the radial profile data for each fibre end-face surface roughness (taken at a wavelength of 632.8 nm and f/3.6 cone angle). Fig. 7 shows the radial profiles and Voigt least-squares fits for the four different fibre end-face surface roughnesses.
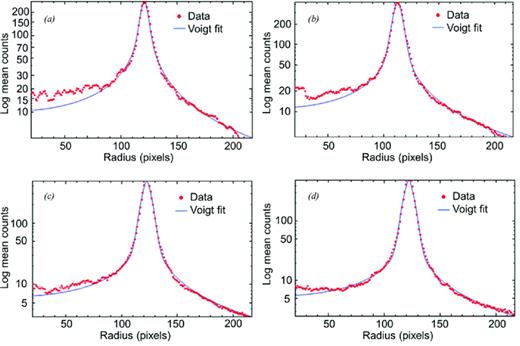
Voigt fits to the radial profiles of the fibre, with an end-face surface roughness: (a) 245-nm rms, (b) 164-nm rms, (c) 12-nm rms and (d) 8-nm rms. Θin = 8°=f/3.6, δout = 25-nm rms, λ = 632.8 nm.
The fits demonstrate that a Voigt function can map on to the radial profile of an FFP of a fibre for various amounts of scatter induced by changing the fibre end-face surface roughness. It is possible that the elevated scattering on the left-hand side of the profile is caused by subsurface damage created during the lapping/polishing process (Collier & Schuster 2005), as it progressively diminishes at each polishing step. The asymmetry in the radial profiles seen in Fig. 7 is consistent with the same amount of light being scattered into the central zone of the ring as is scattered outside the ring, but because the light is scattered into a physically smaller area inside the ring a higher intensity is observed; i.e. it is due to an area effect, caused by the 2π integration, and not due to asymmetry in the scattering process.
We found that the two-component model was required to obtain a good fit. If a pure Gaussian function is used (i.e. η = 0 in equation 8), then a good fit is obtained within the core region but a poor fit is obtained in the wings of the profile. If a pure Lorentzian function is used (i.e. η = 1 in equation 8), then the fit is only appropriate in the wings of the profile; this is demonstrated in Fig. 8 with a vertical linear scale.
Radial profile data for surface roughness 164-nm rms. (a) Gaussian fit (η = 0) and (b) Lorentzian fit (η = 1).
The results confirm that the end-face scattering function is Lorentzian, as calculated from the optical profiler PSD data in Section 3.2.
We have shown that the Voigt FRD model is valid given that the Gaussian component represents the diffraction and modal diffusion and the Lorentzian component represents the end-face scattering. The model can potentially be a powerful diagnostic tool when deconvolution is used to determine the relative contribution of all three FRD components; this is investigated in the following sections.
4.2 Surface roughness effects on FRD
In this section, we used the Voigt model to quantify the contributions of end-face scattering to FRD. This was done by taking the Voigt fits shown in the previous section and deconvolving them back into the individual Gaussian and Lorentzian components, where the Lorentzian component represents the scattering and the Gaussian component represents the diffraction and modal diffusion. To demonstrate the change in performance associated with the change in surface roughness, we also calculated the EE on output within the same cone angle as the input (f/3.6).
The data in Table 2 show that as the surface roughness decreases, the Lorentzian weighting and Lorentzian FWHM also decrease while the Gaussian weighting and FWHM increase. This corresponds to an EE performance improvement of 22 per cent from the roughest to the smoothest end face.
Deconvolved Voigt fits for the surface roughness data (V– Voigt, G – Gaussian, L – Lorentzian, θin = 8°=f/3.6, λ = 632.8 nm).
| Surface roughness (nm rms) | VFWHM ±0 03 03 | GFWHM ±0 02 02 | LFWHM ±0 02 02 | GWEIGHT (η− 1) | LWEIGHT (η) | f/3.6 EE per cent ±1 per cent |
| 245 | 0.80 | 0.52 | 0.45 | 0.36 | 0.64 | 64 |
| 164 | 0.90 | 0.67 | 0.38 | 0.49 | 0.51 | 69 |
| 12 | 0.81 | 0.67 | 0.25 | 0.61 | 0.39 | 75 |
| 8 | 0.78 | 0.66 | 0.22 | 0.65 | 0.35 | 78 |
| Surface roughness (nm rms) | VFWHM ±003 | GFWHM ±002 | LFWHM ±002 | GWEIGHT (η− 1) | LWEIGHT (η) | f/3.6 EE per cent ±1 per cent |
| 245 | 0.80 | 0.52 | 0.45 | 0.36 | 0.64 | 64 |
| 164 | 0.90 | 0.67 | 0.38 | 0.49 | 0.51 | 69 |
| 12 | 0.81 | 0.67 | 0.25 | 0.61 | 0.39 | 75 |
| 8 | 0.78 | 0.66 | 0.22 | 0.65 | 0.35 | 78 |
Deconvolved Voigt fits for the surface roughness data (V– Voigt, G – Gaussian, L – Lorentzian, θin = 8°=f/3.6, λ = 632.8 nm).
| Surface roughness (nm rms) | VFWHM ±003 | GFWHM ±002 | LFWHM ±002 | GWEIGHT (η− 1) | LWEIGHT (η) | f/3.6 EE per cent ±1 per cent |
| 245 | 0.80 | 0.52 | 0.45 | 0.36 | 0.64 | 64 |
| 164 | 0.90 | 0.67 | 0.38 | 0.49 | 0.51 | 69 |
| 12 | 0.81 | 0.67 | 0.25 | 0.61 | 0.39 | 75 |
| 8 | 0.78 | 0.66 | 0.22 | 0.65 | 0.35 | 78 |
Fig. 9 also shows that as the surface roughness increases, the Lorentzian FWHM (representing the scattering component) steadily increases. The Gaussian FWHM (representing diffraction and modal diffusion) remains fairly constant until the largest surface roughness of 245-nm rms where it drops. This drop in the Gaussian FWHM is caused by the dominance of the Lorentzian component in the pseudo-Voigt linear approximation. Correspondingly, the FWHM of the Voigt decreases as the scattering, which is described by the Lorentzian expression, becomes the dominant process such that there is more energy in the wings of the profile than there is in the core, as it becomes more Lorentzian in shape. This effect can lead to false FRD measurements when the Gaussian FRD model is used as it equates the increase or decrease of the FWHM with an increase and decrease in FRD, respectively, and does not take into account the scattering effects.
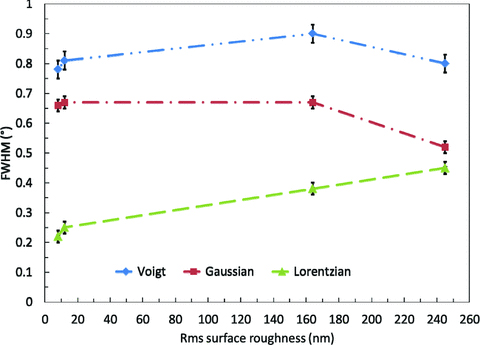
The effect of surface roughness on the far-field radial profile (Voigt) FWHM and the resulting Gaussian and Lorentzian FWHM components.
For fibre-based astronomical instruments, it is desirable to have ≥90 per cent EE on output within the input f-ratio; i.e. for an input of f/3.6, the output EE is ≥90 per cent within f/3.6. Therefore, it is important that all sources of loss are considered and minimized. The EE for the smoothest surface roughness of 8-nm rms is lower than expected and directly correlates with a larger than expected scattering component. This implies that other sources of scattering such as the cleaved output end face of the fibre and possible polishing-induced subsurface damage may also contribute significantly to the overall loss.
The data in Table 3 show that the Gaussian FWHM values remain constant and the Lorentzian (scattering) component decreases when the output fibre end face is immersed. The relative EE improves by 10 per cent when the cleaved end-face surface roughness is removed by immersion. This is a significant improvement confirming that the cleaved output ends are contributing to the elevated scattering level observed in the previous radial profiles.
Deconvolved Voigt fits for immersed and non-immersed (bare) cleaved fibre end (V – Voigt, G – Gaussian, L – Lorentzian, θin = 8°=f/3.6, λ = 632.8 nm).
| Output fibre end | VFWHM ±0 03 03 | GFWHM ±0 02 02 | LFWHM ±0 02 02 | GWEIGHT (η− 1) | LWEIGHT (η) | f/3.6 EE per cent ±1 per cent |
| Bare | 0.79 | 0.62 | 0.30 | 0.55 | 0.45 | 72 |
| Immersed | 0.72 | 0.62 | 0.18 | 0.68 | 0.32 | 79 |
| Output fibre end | VFWHM ±003 | GFWHM ±002 | LFWHM ±002 | GWEIGHT (η− 1) | LWEIGHT (η) | f/3.6 EE per cent ±1 per cent |
| Bare | 0.79 | 0.62 | 0.30 | 0.55 | 0.45 | 72 |
| Immersed | 0.72 | 0.62 | 0.18 | 0.68 | 0.32 | 79 |
Deconvolved Voigt fits for immersed and non-immersed (bare) cleaved fibre end (V – Voigt, G – Gaussian, L – Lorentzian, θin = 8°=f/3.6, λ = 632.8 nm).
| Output fibre end | VFWHM ±003 | GFWHM ±002 | LFWHM ±002 | GWEIGHT (η− 1) | LWEIGHT (η) | f/3.6 EE per cent ±1 per cent |
| Bare | 0.79 | 0.62 | 0.30 | 0.55 | 0.45 | 72 |
| Immersed | 0.72 | 0.62 | 0.18 | 0.68 | 0.32 | 79 |
| Output fibre end | VFWHM ±003 | GFWHM ±002 | LFWHM ±002 | GWEIGHT (η− 1) | LWEIGHT (η) | f/3.6 EE per cent ±1 per cent |
| Bare | 0.79 | 0.62 | 0.30 | 0.55 | 0.45 | 72 |
| Immersed | 0.72 | 0.62 | 0.18 | 0.68 | 0.32 | 79 |
4.3 Wavelength effects on FRD
In previous publications, it has been noted that FRD has either a very weak wavelength dependence or none at all (Schmoll, Roth & Laux 2003; Murphy et al. 2008). Using the Voigt FRD model, we investigate the wavelength dependence of FRD in terms of diffraction, scattering and modal diffusion.
For these tests, we used a test fibre of the same type (FBP140168198) with both input and output ends cleaved and a length of 1.2 m. We measured the fibre with its bare cleaved ends and also with both ends immersed to remove the end-face surface roughness effects. The FFPs were imaged using the experimental apparatus shown in Section 3.3 with laser light at wavelengths of 532 and 1064 nm.
First, we examine the Voigt model’s ability to analyse the wavelength dependency of surface roughness scattering. The data in Table 4 show that when the fibre ends were immersed, the scattering component (Lorentzian component) at 532 nm reduced and the EE increased. At 1064 nm, the Lorentzian component remained constant with little improvement in the EE. This result is consistent with surface roughness scattering theory which scales as  (where δ is the rms surface roughness and λ the wavelength of light) such that long wavelengths are less sensitive to small-scale surface structure. The data also show that there is still a significant scattering component remaining at both wavelengths when the ends are immersed, eliminating the surface scattering. One possible cause of this additional scattering is subsurface damage caused by the lapping/polishing process (Hed & Edwards 1987; Collier & Schuster 2005).
Deconvolved Voigt fits for wavelength data (V – Voigt, G – Gaussian, L – Lorentzian, A – Airy disc, D – modal diffusion).
| λ(nm) | Fibre end | VFWHM ±0 03 03 | GFWHM ±0 02 02 | LFWHM ±0 02 02 | GWEIGHT (1 −η) | LWEIGHT (η) | AFWHM (°) | DFWHM ±0 02 02 | f/3.6 EE per cent ±1 per cent |
| 532 | Bare | 0.79 | 0.65 | 0.24 | 0.63 | 0.37 | 0.22 | 0.61 | 77 |
| 532 | Immersed | 0.81 | 0.70 | 0.21 | 0.68 | 0.32 | 0.22 | 0.66 | 82 |
| 1064 | Bare | 1.52 | 1.27 | 0.46 | 0.63 | 0.37 | 0.44 | 1.19 | 75 |
| 1064 | Immersed | 1.45 | 1.20 | 0.45 | 0.62 | 0.38 | 0.44 | 1.11 | 76 |
| λ(nm) | Fibre end | VFWHM ±003 | GFWHM ±002 | LFWHM ±002 | GWEIGHT (1 −η) | LWEIGHT (η) | AFWHM (°) | DFWHM ±002 | f/3.6 EE per cent ±1 per cent |
| 532 | Bare | 0.79 | 0.65 | 0.24 | 0.63 | 0.37 | 0.22 | 0.61 | 77 |
| 532 | Immersed | 0.81 | 0.70 | 0.21 | 0.68 | 0.32 | 0.22 | 0.66 | 82 |
| 1064 | Bare | 1.52 | 1.27 | 0.46 | 0.63 | 0.37 | 0.44 | 1.19 | 75 |
| 1064 | Immersed | 1.45 | 1.20 | 0.45 | 0.62 | 0.38 | 0.44 | 1.11 | 76 |
Deconvolved Voigt fits for wavelength data (V – Voigt, G – Gaussian, L – Lorentzian, A – Airy disc, D – modal diffusion).
| λ(nm) | Fibre end | VFWHM ±003 | GFWHM ±002 | LFWHM ±002 | GWEIGHT (1 −η) | LWEIGHT (η) | AFWHM (°) | DFWHM ±002 | f/3.6 EE per cent ±1 per cent |
| 532 | Bare | 0.79 | 0.65 | 0.24 | 0.63 | 0.37 | 0.22 | 0.61 | 77 |
| 532 | Immersed | 0.81 | 0.70 | 0.21 | 0.68 | 0.32 | 0.22 | 0.66 | 82 |
| 1064 | Bare | 1.52 | 1.27 | 0.46 | 0.63 | 0.37 | 0.44 | 1.19 | 75 |
| 1064 | Immersed | 1.45 | 1.20 | 0.45 | 0.62 | 0.38 | 0.44 | 1.11 | 76 |
Diffraction effects can play an important role in FRD, particularly in small core fibres. For example, the FWHM of the diffraction-limited Airy disc at 1064 nm is double of that at 532 nm (AFWHM in Table 4). This can be the main reason for greater FRD at longer wavelengths. Excess scattering and modal diffusion would need to occur at shorter wavelengths to have an equivalent FRD measurement.
The data in Table 4 show that DFWHM at 532 nm is three times the Airy FWHM and at 1064 nm it is 2.5 times the Airy FWHM. This indicates that there is more modal diffusion occurring at 532 nm, the likely cause being Rayleigh scattering.
We have shown that the major FRD contributors (scattering, diffraction and modal diffusion) are wavelength dependent, and therefore FRD is indeed wavelength dependent. Out test fibres show a small increase in FRD at the longer wavelength (1064 nm) due to diffraction and modal diffusion.
4.4 Fibre length effects on FRD
Early work on fibre characterization demonstrated a strong length dependence associated with modal diffusion (Gloge 1972), but fibre manufacturing techniques have improved significantly over the last 30 yr such that there are very few intrinsic defects over very long lengths of fibre. We investigated the length dependence of FRD in modern astronomical-grade fibre using our Voigt model.
For the tests we used two test fibres of the same type (FBP140168198) with both input and output ends cleaved, one of 1.2 m in length and the other of 70 m in length. We measured the fibres with bare cleaved ends and also with both ends immersed to remove the end-face surface roughness effects. The FFPs were imaged using the experimental apparatus shown in Section 3.3 with laser light at wavelengths of 532 and 1064 nm. The deconvolved Voigt data are presented in Table 5.
Deconvolved Voigt data for fibre length dependence (V – Voigt, G – Gaussian, L – Lorentzian, D – modal diffusion).
| λ (nm) | Fibre length (m) | VFWHM ±0 03 03 | GFWHM ±0 02 02 | LFWHM ±0 02 02 | GWEIGHT (1 −η) | LWEIGHT (η) | DFWHM ±0 02 02 | f/3.6 EE per cent ±1 per cent |
| 532 | 1.2 | 0.81 | 0.70 | 0.21 | 0.68 | 0.32 | 0.66 | 82 |
| 532 | 70 | 1.08 | 0.94 | 0.25 | 0.70 | 0.30 | 0.91 | 80 |
| 1064 | 1.2 | 1.45 | 1.20 | 0.45 | 0.62 | 0.38 | 1.11 | 76 |
| 1064 | 70 | 1.46 | 1.22 | 0.43 | 0.64 | 0.36 | 1.13 | 76 |
| λ (nm) | Fibre length (m) | VFWHM ±003 | GFWHM ±002 | LFWHM ±002 | GWEIGHT (1 −η) | LWEIGHT (η) | DFWHM ±002 | f/3.6 EE per cent ±1 per cent |
| 532 | 1.2 | 0.81 | 0.70 | 0.21 | 0.68 | 0.32 | 0.66 | 82 |
| 532 | 70 | 1.08 | 0.94 | 0.25 | 0.70 | 0.30 | 0.91 | 80 |
| 1064 | 1.2 | 1.45 | 1.20 | 0.45 | 0.62 | 0.38 | 1.11 | 76 |
| 1064 | 70 | 1.46 | 1.22 | 0.43 | 0.64 | 0.36 | 1.13 | 76 |
Deconvolved Voigt data for fibre length dependence (V – Voigt, G – Gaussian, L – Lorentzian, D – modal diffusion).
| λ (nm) | Fibre length (m) | VFWHM ±003 | GFWHM ±002 | LFWHM ±002 | GWEIGHT (1 −η) | LWEIGHT (η) | DFWHM ±002 | f/3.6 EE per cent ±1 per cent |
| 532 | 1.2 | 0.81 | 0.70 | 0.21 | 0.68 | 0.32 | 0.66 | 82 |
| 532 | 70 | 1.08 | 0.94 | 0.25 | 0.70 | 0.30 | 0.91 | 80 |
| 1064 | 1.2 | 1.45 | 1.20 | 0.45 | 0.62 | 0.38 | 1.11 | 76 |
| 1064 | 70 | 1.46 | 1.22 | 0.43 | 0.64 | 0.36 | 1.13 | 76 |
On examination of the data in Table 5, it can be seen that there is very little change in the modal diffusion component (DFWHM) at the longer wavelength demonstrating that the FRD is dominated by the end effects and diffraction with no significant intrinsic length dependency. At the shorter wavelength of 532 nm, there is an increase in the modal diffusion (DFWHM) component such that the profile broadens enough to increase FRD by a small amount. These results once again indicate that the intrinsic modal diffusion process is more prolific at the shorter wavelength with the most likely cause being Rayleigh scattering.
From the length dependency data, we can also study how the modal intensity distribution of the light changes as it moves through the fibre. The data for the short length of fibre exhibit a relatively large Lorentzian component for both wavelengths. When the fibre length increases, the Lorentzian component decreases (LWEIGHT) as the modal diffusion increases. If the modal diffusion continues to increase, then the modal intensity profile would evolve towards a Gaussian as the high order wings of the Lorentzian component are stripped away (Chaikina et al. 2005). At the output end face, the light encounters end effects again and the intensity profile can become Voigt shaped again due to contributions from a scattering structure with a Lorentzian profile.
Modern fibre designed for use in astronomical instrumentation has very few perturbations over long fibre lengths and therefore has a very weak FRD length dependency. The fibre end-face preparation and external environment are likely to have a bigger impact on FRD than the fibre length; this supports the current literature (Poppett & Allington-Smith 2010).
4.5 Microbending effects on FRD
Environmentally induced microbending (stressing the fibre) caused by fibre mounts, temperature variation and cable design can have a devastating impact on FRD (Lee et al. 2001; Oliverira et al. 2005).
We used the Voigt model to analyse the modal intensity distribution when external microbending is induced. We used the same short fibre as used in the previous tests with both ends cleaved and immersed. The microbending was induced by placing a stainless steel ferrule (outer diameter of ∼600 μm) across the fibre with a weight (∼200 g) on top of it. The FFPs of the fibre with and without induced microbending were imaged with 532- and 1064-nm light sources while the induced microbending remained constant. The deconvolved Voigt data are shown in Table 6.
Deconvolved Voigt data for induced microbending (V – Voigt, G – Gaussian, L – Lorentzian, D – modal diffusion).
| λ (nm) | Micro- bending | VFWHW ±0 03 03 | GFWHM ±0 02 02 | LFWHM ±0 02 02 | GWEIGHT (1 −η) | LWEIGHT (η) | DFWHM ±0 02 02 | f/3.6 EE per cent ±1 per cent |
| 532 | No | 0.81 | 0.70 | 0.21 | 0.68 | 0.32 | 0.66 | 82 |
| 532 | Yes | 1.41 | 1.23 | 0.33 | 0.70 | 0.30 | 1.21 | 77 |
| 1064 | No | 1.45 | 1.20 | 0.45 | 0.62 | 0.38 | 1.11 | 76 |
| 1064 | Yes | 1.84 | 1.55 | 0.52 | 0.65 | 0.35 | 1.48 | 74 |
| λ (nm) | Micro- bending | VFWHW ±003 | GFWHM ±002 | LFWHM ±002 | GWEIGHT (1 −η) | LWEIGHT (η) | DFWHM ±002 | f/3.6 EE per cent ±1 per cent |
| 532 | No | 0.81 | 0.70 | 0.21 | 0.68 | 0.32 | 0.66 | 82 |
| 532 | Yes | 1.41 | 1.23 | 0.33 | 0.70 | 0.30 | 1.21 | 77 |
| 1064 | No | 1.45 | 1.20 | 0.45 | 0.62 | 0.38 | 1.11 | 76 |
| 1064 | Yes | 1.84 | 1.55 | 0.52 | 0.65 | 0.35 | 1.48 | 74 |
Deconvolved Voigt data for induced microbending (V – Voigt, G – Gaussian, L – Lorentzian, D – modal diffusion).
| λ (nm) | Micro- bending | VFWHW ±003 | GFWHM ±002 | LFWHM ±002 | GWEIGHT (1 −η) | LWEIGHT (η) | DFWHM ±002 | f/3.6 EE per cent ±1 per cent |
| 532 | No | 0.81 | 0.70 | 0.21 | 0.68 | 0.32 | 0.66 | 82 |
| 532 | Yes | 1.41 | 1.23 | 0.33 | 0.70 | 0.30 | 1.21 | 77 |
| 1064 | No | 1.45 | 1.20 | 0.45 | 0.62 | 0.38 | 1.11 | 76 |
| 1064 | Yes | 1.84 | 1.55 | 0.52 | 0.65 | 0.35 | 1.48 | 74 |
The data in Table 6 show a greater increase in the modal diffusion component (ΔDFWHM= ) at 532 nm with a corresponding decrease in EE. The change at the longer wavelength of 1064 nm is less ΔDFWHM=
 , but the FRD is still greater due to the combined diffraction and modal diffusion effects. However, it is possible to have greater FRD at the shorter wavelength by increasing modal diffusion through environmentally induced microbending. This has been observed when astronomical-type fibres have been cryogenically cooled (Poppett & Allington-Smith 2007). When the fibres are cooled, there is sufficient differential shrinkage of the buffer material with respect to the core/cladding material to cause an increase in microbending. The increased microbending results in greater modal diffusion at the shorter wavelengths; this could be why Poppett & Allington-Smith (2007) observed a reverse in the FRD wavelength characteristics when the fibres were cooled.
5 SUMMARY
We have shown for the first time that fibre end-face surface roughness produces a Lorentzian scattering profile and that this, convolved with the effects of circular aperture diffraction and modal diffusion, results in a Voigt-shaped far-field intensity profile. The fibre far-field intensity profile also represents the amount of FRD in a multimode fibre. We propose a Voigt FRD model where the diffraction and modal diffusion are modelled by the Gaussian component and the end-face scattering is modelled by the Lorentzian component. The Voigt FRD model can be deconvolved into its Gaussian and Lorentzian components and used to analyse the contribution of each of the three major components (diffraction, modal diffusion and scattering).
We use the Voigt FRD model to analyse the FRD of modern astronomical grade fibre for variations in (i) end-face surface roughness, (ii) wavelength, (iii) fibre length and (iv) external fibre stress (microbending). The analysis shows that surface scattering can significantly alter the FRD at short wavelengths for surface roughness values as little as 25-nm rms (typical value for a cleaved multimode fibre), but has little effect at longer wavelengths. We demonstrate that FRD does vary with a change in wavelength and show that at short wavelengths FRD is dominated by surface scattering and modal diffusion, whereas at longer wavelengths FRD is dominated by diffraction and modal diffusion. Our study also shows that FRD has a very weak length dependence in modern astronomical fibre and that the small increase in modal diffusion associated with increasing fibre length is greater at shorter wavelengths. Modal diffusion caused by externally induced microbending also increases more rapidly at shorter wavelengths, but the total FRD was greater at the longer wavelength of 1064 nm because of diffraction and modal diffusion. Given the quality of modern astronomical grade fibre, it is likely that the FRD is always greater at longer wavelengths if the fibre end effects are minimized; however, it is possible to have the reverse whereby the FRD is greater at shorter wavelengths. This has been observed when astronomical-type fibres have been cryogenically cooled and there is sufficient differential shrinkage of the buffer material with respect to the core/cladding material to cause an increase in microbending, thereby increasing modal diffusion at the shorter wavelengths such that the FRD increases.
In conclusion, our study has shown that modern astronomical grade fibre has intrinsically very little FRD. The elevated FRD that we observe is entirely due to external factors, i.e. fibre end effects such as surface roughness, subsurface damage and environmentally induced microbending caused by the epoxy, ferrules and fibre cable design.
The Voigt FRD model has numerous applications, such as a diagnostic tool for current fibre instrumentation that shows elevated FRD, as a quality control method for fibre manufacture and fibre cable assembly and as a research and development tool for the characterization of new fibre technologies.
The authors wish to thank Michael Goodwin, Simon Ellis, Joss Bland-Hawthorn, Scott Smedley, Will Saunders, Rob Sharp and Scott Croom for their invaluable input during the course of this research. In addition, we wish to acknowledge support from Martin Roth, Bernadette Rambold, innoFSPEC-AIP and the German federal government programme ‘Wirtschaft trifft Wissenschaft’ under contract no. 03WWBB105.
REFERENCES
