-
PDF
- Split View
-
Views
-
Cite
Cite
F. Kemper, A. J. Markwick, Paul M. Woods, The crystalline fraction of interstellar silicates in starburst galaxies, Monthly Notices of the Royal Astronomical Society, Volume 413, Issue 2, May 2011, Pages 1192–1199, https://doi.org/10.1111/j.1365-2966.2011.18204.x
Close - Share Icon Share
Abstract
We present a model using the evolution of the stellar population in a starburst galaxy to predict the crystallinity of the silicates in the interstellar medium of this galaxy. We take into account dust production in stellar ejecta, and amorphization and destruction in the interstellar medium and find that a detectable amount of crystalline silicates may be formed, particularly at high star formation rates, and in case supernovae are efficient dust producers. We discuss the effect of dust destruction and amorphization by supernovae, and the effect of a low dust-production efficiency by supernovae, and find that when taking this into account, crystallinity in the interstellar medium becomes hard to detect. Levels of 6.5–13 per cent crystallinity in the interstellar medium of starburst galaxies have been observed and thus we conclude that not all these crystalline silicates can be of stellar origin, and an additional source of crystalline silicates associated with the active galactic nucleus must be present.
1 INTRODUCTION
Silicates are among the most commonly found dust species in the interstellar medium (ISM) of galaxies. Their presence is established through the detection of the mid-infrared resonances due to the Si–O stretching and the O–Si–O bending mode at 9.7 and 18 μm, respectively. In galaxies, these bands are seen in absorption (Gillett et al. 1975; Sturm et al. 2000), as well as in emission (Hao et al. 2005; Siebenmorgen et al. 2005). Most of these silicates show the broad resonances characteristic of amorphous silicates, i.e. silicates showing a large degree of lattice defects, and it is generally assumed that silicates in the ISM are predominantly amorphous. In particular, the degree of crystallinity x, defined as the mass fraction of silicates that is crystalline, x=MX/(MX+MA), in the Galactic diffuse ISM is found to be of the order of 1 per cent (Kemper, Vriend & Tielens 2004, 2005). This contrasts sharply with the much higher degree of crystallinity seen in silicates in the circumstellar environments of pre- and post-main-sequence stars (see e.g. Molster & Kemper 2005, and references herein). Generally speaking, the galactic cycle of dust starts with its formation in evolved stars, followed by processing in the ISM and eventually ends with incorporation in stars and planets during star formation. The silicates observed around asymptotic giant branch (AGB) stars can have significant crystalline fractions, in particular for the high mass-loss rate OH/IR stars (up to ∼20 per cent; Sylvester et al. 1999; Kemper et al. 2001; de Vries et al. 2010). For lower mass-loss rate AGB stars, such as Miras, the crystallinity is not well established, but is consistent with a value that does not vary with mass-loss rate (Kemper et al. 2001). For more massive stars, such as red supergiants (RSGs), the crystallinity of the silicates in the stellar ejecta is not well known, although isolated studies report high crystalline fractions (e.g. Molster et al. 1999), while low crystalline fractions seem to be more common (Verhoelst et al. 2009). Spoon et al. (2006) adopt a crystallinity of 15 per cent for RSGs and luminous blue variables.
In contrast to the low crystallinity in the Galactic ISM, significant amounts of crystalline silicates have been detected in the infrared spectra of ultraluminous infrared galaxies (ULIRGs; Spoon et al. 2006). In a sample of 77 ULIRGs, 12 were found to show crystallinity, with crystalline-to-amorphous silicate mass ratios ranging from 0.07 to 0.15, corresponding to crystallinities of 6.5–13 per cent.
The degree of crystallinity of a population of silicate grains provides a record of the processing history of those grains (see e.g. Molster & Kemper 2005). A high crystalline fraction points to a relatively high formation or processing temperature (∼1000–1500 K), while a large amorphous fraction indicates that the population of grains has undergone the damaging effects of cosmic ray hits (Bringa et al. 2007), grain–grain collisions or atomic impacts in shocks (Demyk et al. 2001; Brucato et al. 2003; Jäger et al. 2003); or that it is formed at lower temperatures. Crystalline silicates may thus form in dense circumstellar environments, where the vicinity of the central star provides the required heating. The mass-loss processes of evolved stars subsequently spread these crystalline silicates into the ISM. The fact that the silicates in the ISM of the Milky Way are almost entirely amorphous (Kemper et al. 2004) suggests that the amorphization processes in the ISM are more important than the injection of fresh crystalline silicates into the interstellar reservoir by evolved stars. For the Galaxy, an amorphization time-scale of 40 Myr has been derived from observations (Kemper et al. 2004; Kemper et al. 2005), which is close to the experimental value of 70 Myr (Bringa et al. 2007).
Spoon et al. (2006) argue that in starburst galaxies ultraviolet (UV) photons from either the active galactic nuclei (AGN) or massive stars are the only potential sources of UV photons to anneal or form the crystalline silicate mass observed. Crystallization due to UV photons originating from the AGN is dismissed by Spoon et al. (2006), because of the observed lack of crystalline silicates in the inner 2 pc of NGC 1068 (Jaffe et al. 2004), and the fact that the crystalline silicates are only seen in absorption and can therefore not be very warm. Spoon et al. (2006) hypothesize that the crystalline silicates must be produced by massive stars originating from the starburst. In this paper, we will investigate the viability of the build-up of crystalline silicates due to the starburst activity in ULIRGS as proposed by Spoon et al. (2006), and compare the crystalline fraction to the levels observed by these authors. The alternative formation of crystalline silicates due to AGN activity will be the subject of a separate future study. This future work will be based on the predicted formation of dust in the quasar wind rising from the accretion disc (Elvis, Marengo & Karovska 2002), where conditions may be similar to those present in AGB star winds, a class of very efficient dust producers. Crystalline silicates may form in quasar winds if the conditions are right. Indeed, we have already observed crystalline silicates in the quasar wind of PG 2112+059 (Markwick-Kemper et al. 2007).
2 THE MODEL
2.1 Injection of mass in the ISM of starburst galaxies
When a starburst occurs, a large fraction of the gas available in molecular clouds will be triggered into forming stars.

We find that N0 = 0.663 satisfies this equation. Since the duration of the starburst will be much shorter than the lifetime of the Sun (τ⊙), we do not need to consider mass-loss for low-mass stars, so the exact shape of the ISM below M < 1 M⊙ is irrelevant. Naturally, setting the upper integration boundary to m=∞ results in unrealistically high stellar masses, but since the IMF is a very steep power law, the numerical contribution from hypothetical stars with M > 120 M⊙ is negligible.
The time that a star spends on the main sequence is approximated by τMS∝M/L, while the mass–luminosity relation states that L∝Mη, with η≈ 3.35 for stars with 1 M⊙ < M < 40 M⊙ (e.g. Kippenhahn & Weigert 1990). Thus we find for the lifetime of a star on the main sequence – using solar units, e.g. m(M⊙) and t(τ⊙)– that τm=m1−η.


2.2 The remnant mass function
 , with fw and
  determined in each category to be
2.3 A starburst of finite duration
In order to calculate the ejection rate, we can distinguish two different eras: during the starburst (0 < t < σ) and after the starburst (t > σ). Within each era, we can subdivide into three different regimes, corresponding to the lifetimes of the stellar mass ranges described by Dabringhausen et al. (2009), defined by the boundaries τ8 = 81−ητ⊙ = 7.5 × 10⁻³ τ⊙ and τ25 = 251−ητ⊙ = 5.2 × 10⁻⁴ τ⊙. We assume that σ > τ8.
2.3.1 During the starburst: 0 < t < σ
Phase I: t < τ25
Only the most massive stars (m > 25) have started losing mass, and for these objects the remnant mass is given by wm = 0.1 m (equation 4), thus equation (3) becomeswhich simplifies to5 with N0 = 0.663 and fw = 0.1 and mt = (t/τ⊙)1/1−η.6
Phase II: τ25 < t < τ8
During this phase, two components contribute to the ejection rate: E(t) =E1+E2(t), with E1 a constant value due to the ejection rate by the most massive stars (m > 25), and E2(t) an increasing component due to the ejection by intermediate mass stars (8 < m < 25). To obtain E1, we integrate equation (5) between m = 25 and ∞, and find thatwhich, for fw = 0.1, N0 = 0.663, and a = 1.3 results in E1 = 0.76 ψ0.7 To obtain E2(t), we integrateand find8
 with wm = 1.35.9
Phase III: τ8 < t < σ, with σ < τ⊙
During this phase, the ejection rate can be written as E(t) =E1+E2+E3(t), with E1 given by equation (7) and E2 obtained by substituting mt = 8 into equation (8). This yieldswhich, for wm = 1.35 gives E2 = 0.47 ψ0.10 The ejection rate by low-mass stars (m < 8) E3(t) can be obtained from equation (3):with11
 . This can be rewritten as 12
2.3.2 After the starburst: t > σ
When a starburst of duration σ has stopped, there are no longer any stars with m > [(t−σ)/τ⊙]1/(1−η) in the galaxy, thus constraining the upper limit of the integration to obtain the ejection rate.
Phase IV: t−σ < τ25
Shortly after the starburst has stopped stars with m > 25 still exist, and we can write for the ejection rate: E(t) =E′1(t) +E2+E3(t). E2 and E3(t) are given by equations (10) and (12). For E′1(t) we can write, with mt−σ=[(t−σ)/τ⊙]1/(1−η),which we can rewrite as13 14
14
Phase V: τ25 < t−σ < τ8
In this phase, high-mass stars (m > 25) are extinct and no longer contribute to the ejection rate, which has now become E(t) =E′2(t) +E3(t), with E3(t) again equal to the result of equation (12). For E′2(t) we can writewith mt−σ=[(t−σ)/τ⊙]1/(1−η).15
Phase VI: t−σ > τ8
At this late time after the starburst, only low-mass stars with m < 8 are still in existence, and thus16
2.4 Mass ejection rates and dust production
In Fig. 1 the resulting ejection rate E(t) throughout phases I–VI is shown for a starburst of 1000 M⊙ yr−1 and a duration of 100 Myr, as well as the ejection by high-, intermediate- and low-mass stars specifically. It is clear that during the burst of star formation, supernovae ejecta from the most massive stars (m > 25) dominate the mass return to the ISM, but that after the starburst has ended, intermediate- and low-mass stars are important.
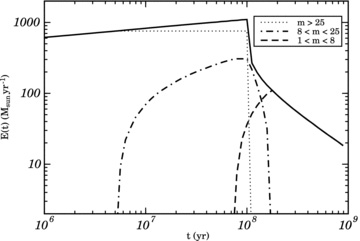
Stellar mass ejection rate into the ISM of a starburst galaxy with a star formation rate ψ = 1000 M⊙ yr−1, as a function of time after the beginning of the starburst (solid line). The duration of the starburst is 100 Myr. The dotted, dot–dashed and dashed lines indicate the contributions by high-, intermediate- and low-mass stars, respectively.
For each of the regimes, the dust production rate D(t) is related to the mass ejection rate by D(t) =E(t) d, in which d is the dust-to-gas ratio. In the simplest scenario, we assume that low-, intermediate- and high-mass stars are all equally efficient dust producers, for which we use the commonly used value of d = 0.01. This gives rise to the solid line labelled D(t) in Fig. 2. The dust-production efficiency of supernovae is a hot topic in research because of its implications for the presence of dust at high redshift, and the consensus seems to be that dust production in supernova ejecta is not as efficient as in the outflows of lower mass stars (e.g. Sugerman et al. 2006; Fox et al. 2010). We have thus also considered values of 0.001 and 0.0001 for d, for the ejecta of high- and intermediate-mass stars (m > 8), all of which produce supernovae. The resulting D(t) is shown in Fig. 2, by the dashed and dotted lines, respectively.
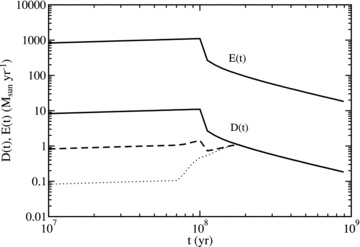
Dust production rate D(t) in a starburst galaxy, compared to the stellar mass ejection rate E(t), both indicated by solid lines. The dust-to-gas ratio d is assumed to be 0.01 in all ejecta. The dashed and dotted lines show the dust production rates in cases where supernovae produce dust at 10 or 100 times lower efficiencies, respectively.
2.5 The dust budget in the ISM of a galaxy
In our model, we will consider two separate dust reservoirs to be present in a galaxy: a crystalline silicate reservoir with a mass MX and an amorphous silicate reservoir with a mass MA. The injection of new silicate material D(t), as described in Section 2.4, affects both reservoirs, although not in equal amounts. We use x★ to denote the fraction of silicate mass in crystalline form produced by stars. Another possible source of silicates is dust formation in the ISM itself, which can be generally expressed as FA(t) and FX(t) for amorphous and crystalline silicates, respectively.
We include the transitions between both reservoirs due to annealing or destruction of the lattice structure, which occur at a rate k1 for the amorphization of crystalline material and k2 for the crystallization of amorphous silicates.
Finally, the processes that remove material from both dust reservoirs include grain destruction by supernova shocks and cosmic ray hits, but also astration and incorporation in planet-forming discs. We summarize these terms as dust destruction, occurring at rates of k3 and k4 for crystalline and amorphous silicates respectively.

In interstellar conditions, the crystallization rate k2 will be negligible, as annealing requires the grains to be heated to ≳1000 K, which is unlikely to occur. We also assume that the destruction rates for both types of silicates are equal: k3=k4 = 2 × 10⁻⁹ yr−1 (Kemper et al. 2004), and that dust formation in the ISM can be ignored: FX(t) =FA(t) = 0. For the amorphization rate of crystalline silicates, we take the rate k1 = 2.5 × 10⁻⁸ yr−1, in accordance with Kemper et al. (2005).
Equation (17) allows us to investigate the time dependence of the crystalline and amorphous silicate masses, and compare the results with the observational constraints (Spoon et al. 2006). Instantaneous mixing of the silicates is assumed.
2.6 Fitting parameters
The values for the fixed parameters and the fitting ranges for the free parameters required to reproduce the observed crystallinities are set as follows. The star formation rate ψ0 is allowed to vary between 10 and 1000 M⊙ yr−1. The total initial dust mass in a galaxy is varied between 107 and 108 M⊙, with an initial crystalline fraction xISM≤ 0.01. It should be noted that both the initial dust mass and the star formation rate are related to the gas mass in the galaxy, and both will go up for a larger gas reservoir. The crystallinity in the stellar ejecta x* is taken to be 0.10–0.20. The duration of the starburst is allowed to run until 0.01 τ⊙, or 100 Myr, which is well beyond the commonly accepted value of 5–10 Myr for the duration of starburst, although recent work on dwarf galaxies suggests that starburst may last a few 100 Myr (McQuinn et al. 2010).
3 RESULTS
We have numerically evolved the system using equation (17). The results of a run with an initial dust mass MX+MA = 108 M⊙, star formation rate ψ0 = 1000 M⊙ yr−1 and crystallinity x* = 0.2 for the silicates in the stellar ejecta in Fig. 3. In this case, supernovae are considered equally efficient dust producers as low-mass stars, with d = 0.01 over the entire stellar mass range. Panel (a) shows the silicate ejection rate throughout time for a starburst of 0.01 τ⊙ in duration. Due to the contribution of these ejecta, the total silicate mass MX+MA in the galaxy increases (panel b), and levels off after the end of the starburst (dashed line). The dashed-triple-dotted line indicates the destruction time-scale of 400 Myr, which is due to rates k3 and k4. At this point, the total dust mass has decreased significantly from its peak during the starburst. The mass MX contained in crystalline silicates (panel c) closely follows the ejection rate, since the amorphization time-scale is short (40 Myr, based on k1, indicated with a dotted line). The crystallinity in the ISM xISM=MX/(MX+MA) (Kemper et al. 2004) is plotted in panel (d) and appears to peak before the amorphization time-scale has elapsed, at around 20 Myr. A significant level of crystallinity may build up for a brief period of time. In this particular example, we find levels of xISM≈ 10–11 per cent.
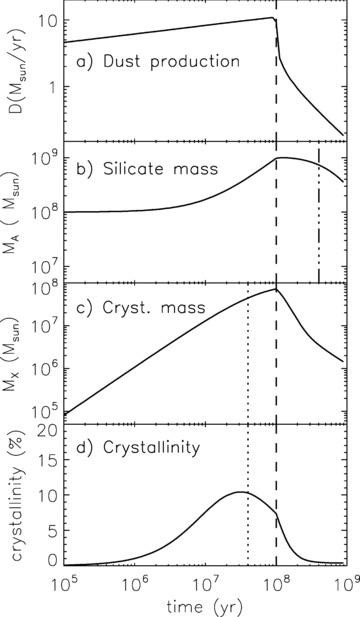
Results from model calculations, with the initial interstellar silicate mass MX+MA = 108 M⊙, the star formation rate ψ0 = 1000 M⊙ yr−1, the stellar crystallinity x* = 0.2 and the dust-to-gas ratio d = 0.01 for all stars. Panel (a) displays the total injection rate of stellar dust into the ISM as a function of time after the beginning of the starburst. In panel (b) the total silicate mass in the galaxy is shown. Panel (c) shows the crystalline silicate mass in solar masses, and finally, in panel (d) we show the crystallinity, defined as the crystalline silicate mass divided by the total silicate mass. The dashed line indicates the end of the starburst t1 = 108 yr. The dashed-triple-dotted and the dotted lines indicate destruction and amorphization time-scales in the ISM, respectively.
The definition of crystallinity used here is based on the work presented in an earlier paper (Kemper et al. 2004), and differs from the crystalline-to-amorphous ratio Ncr/Nam measured by Spoon et al. (2006). Their ratios of 0.07–0.15 therefore translate to crystallinities xISM of 6.5–13 per cent for the interstellar silicates in these ULIRGs, experiencing starbursts. The peak crystallinity in our calculation of ∼10–11 per cent falls within this range.
However, a star formation rate of ψ0 = 1000 M⊙ yr−1 is on the high end of the range seen in starburst galaxies (e.g. Weedman & Houck 2008), and values of 10–100 seem to be more common (e.g. Kennicutt 1998). When these lower values are used in the model calculations, the crystallinity of the silicates in the ISM builds up more slowly (Fig. 4), and peaks at values below the measurements by Spoon et al. (2006).
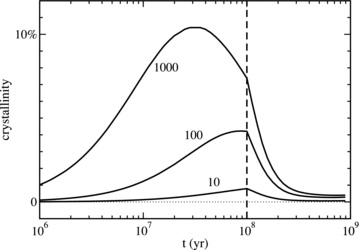
Crystallinity in models with star formation rates ψ0 of 1000, 100 and 10 M⊙ yr−1 (solid lines). The other model parameters are set as described in the beginning of Section 3. The dashed line indicates the end of the starburst.
3.1 The effect of supernovae
As Figs 3 and 4 demonstrate, the levels of crystallinity reached in starburst galaxies with high (1000 M⊙ yr−1; Fig. 3) and intermediate (>100 M⊙ yr−1; Fig. 4) star formation rates are in line with the range of x = 6.5–13 per cent that is observed by Spoon et al. (2006). However, these calculations were performed under the assumption that the dust production by supernovae is efficient, with a dust-to-gas mass ratio d in the stellar ejecta of 0.01, independent of initial stellar mass. However, when we, following work by e.g. Sugerman et al. (2006) and Fox et al. (2010) confirming that supernova are not efficient dust producers, consider a 10 or 100 times lower dust formation efficiency in the supernovae ejecta (affecting all stars with m > 8), a different picture arises.
The top two panels of Fig. 5 show the amorphous and crystalline silicate mass in the starburst galaxy, using values of d = 0.01 (solid lines), 0.001 (dashed lines) and 0.0001 (dotted lines) describing the supernova dust productivity, while the dust production efficiency of low-mass stars (m < 8) is kept at d = 0.01. The two sets of lines in the top panel of Fig. 5 arise from different initial dust masses in the ISM (see caption). These plots show that the overall dust production dramatically decreases, and that the peak in dust mass shifts to a later time. The crystalline silicate mass is even 1 or 2 orders of magnitude lower during the starburst phase, and is no longer dependent on the supernova dust productivity 20 Myr after the starburst. This is due to the fact that the amorphization time-scale is very short, and all crystalline silicates present at this time are freshly produced by low-mass stars.
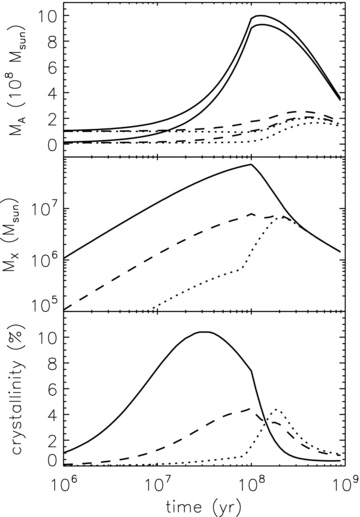
The amorphous and crystalline dust masses in a starburst over time, for three different supernova dust production efficiencies: d = 0.01 (solid lines), d = 0.001 (dashed lines) and d = 0.0001 (dotted lines). The first panel shows the amorphous silicate mass MA in the ISM of a starburst galaxy, with the two curves in each line style representing the initial ISM dust masses of 107 M⊙ (lower lines) and 108 M⊙ (upper lines). The second panel shows the crystalline silicate mass MX, and the third panel the crystalline fraction x=MX/(MX+MA) of silicates in the ISM of a starburst galaxy as a function of time. For all models, ψ0 is set to 1000 M⊙ yr−1.
The crystallinity x, in the bottom panel of Fig. 5 shown for ψ0 = 1000 M⊙ yr−1 and an initial dust mass of 108 M⊙, evolves differently with time for different dust production efficiencies in supernova; however the width of the curve is determined by the amorphization rate k1. At the lowest efficiency we considered, d = 0.0001, the crystalline fraction is in fact dominated by the produce of low-mass stars, which peaks after the end of the starburst, in this case. The peak crystalline fraction is also considerably lower for low dust production efficiencies, and for this very high star formation rate only a level of 4 per cent is reached, just below the lowest values of 6.5 per cent observed by Spoon et al. (2006). After 5–10 Myr, the generally accepted value for the duration of a starburst, only small amounts of crystallinity have built up, even for the most favourable set of parameters.
4 DISCUSSION
Through constructing an ISM dust evolution model, we have been able to explain the crystallinities observed by Spoon et al. (2006) in a sample of 12 ULIRGs, out of a larger set of 77 analysed. The observed crystallinities range from 6.5 to 13 per cent. We remark, however, that the derived crystallinity is high, due to the use of the 16.5 μm forsterite feature. This is intrinsically one of the weaker forsterite resonances (Jäger et al. 1998), and thus a large amount of forsterite is required to explain the optical depth in this feature. Spoon et al. (2006) chose this feature for their analysis because it was the only feature clearly observed in all 12 objects. Using fig. 5 and equation (1) from their paper, we estimate that the crystallinity could be a factor of ∼3 or ∼4.5 lower, when using the 18 or 23 μm features, respectively. This should, however, be compared to the lack of a crystalline silicate detection in the ISM of the Milky Way (Kemper et al. 2004). Additionally, crystallinities in the ULIRG sample can only be derived for all sources using the 16.5-μm feature, and we therefore use the results presented by Spoon et al. (2006) at face value.
Using the relatively high values of 1000 M⊙ yr−1 for the star formation rate and a crystallinity of 20 per cent in the stellar ejecta, we achieve interstellar crystallinities of >10 per cent, under the assumption that supernovae are efficient dust producers, with a dust-to-gas ratio d = 0.01 in their ejecta. As the time-dependent plots show, detectable levels of crystallinity are only a temporary condition, which is consistent with only seeing it in part of the ULIRG sample studied, with the timing and the duration of detectable levels depending on the model parameters. In the case that supernovae are important dust producers, the crystallinity of the silicates in the ISM peaks shortly after the starburst on a time-scale shorter than the amorphization time-scale of 40 Myr. For the parameters used in our fiducial model, we find that the crystallinity is highest some 10–20 Myr after the starburst and that crystalline silicates can make up ≈11 per cent of the silicate material.
4.1 Evaluation of the input parameters
The input parameters used are on the extreme end of the range observed, particularly for the star formation rate ψ0, the crystallinity x* of the silicates in stellar ejecta and the (supernova) dust formation efficiency d. We also discuss the role of supernovae in general.
First, for more typical star formation rates of ψ0 = 10–100 M⊙ yr−1 the interstellar crystallinity is much less enhanced during the starburst (see Fig. 4), making it harder to explain the observed values.
Secondly, the interstellar crystallinity scales linearly with the crystallinity of stellar ejecta used, where x* = 20 per cent is on the high side. More typical values are around 10 per cent (Kemper et al. 2001), although de Vries et al. (2010) have shown that the forsterite abundance (one of the species contributing to the crystallinity) is closer to 12 per cent. Unfortunately, the crystallinity can only be measured in stars with the densest winds (Sylvester et al. 1999); crystallinities up to about 20 per cent in the more numerous low-density winds would remain undetected (Kemper et al. 2001). Thus, 20 per cent could be regarded as an upper limit to the crystallinity in stellar ejecta, for classes of objects where no specific measurements exist.
4.1.1 The role of supernovae
The role of supernovae in the mineralogical evolution of a galaxy remains uncertain, for a number of reasons. First, little is known about the mineralogy of supernovae ejecta. The small number of studies available (e.g. Rho et al. 2009) do not establish the crystallinity of the produced silicates. Secondly, the dust production efficiency d of supernovae has been shown to be low (e.g. Sugerman et al. 2006; Fox et al. 2010) compared to lower mass stars. On the other hand, studies of the Cas A and Kepler supernova remnants suggest significant amounts of dust may have formed (Morgan et al. 2003; Dunne et al. 2003), although in one of these particular studies foreground emission may have been interpreted as coming from the supernova remnant itself (Krause et al. 2004). Thus, d may range from 0.0001 to 0.01. In Fig. 5, the effect of a low dust formation efficiency in supernovae on the dust population in a galaxy shows that the crystallinity does peak at much later times and at lower values due to his effect. Indeed, at a supernova dust production rate of d = 0.0001, the dust production, and thus the crystallinity, is dominated by low-mass stars (m < 8, with d = 0.01), and by the time the crystallinity peaks these galaxies are no longer recognizable as starburst galaxies.
Thirdly, the higher supernova rate has its effect on the amorphization rate. The values used for k1 are derived for Galactic conditions but these may be significantly higher in starburst galaxies due to the enhanced rate of shocks and cosmic ray hits. We have investigated the effect of an enhanced supernova rate, by increasing k1 up to a factor of 100. Increasing these rates is detrimental to the crystalline fraction, with an increase of a factor 100 reducing the crystalline fraction in the ISM to ≪1 per cent (Fig. 6).
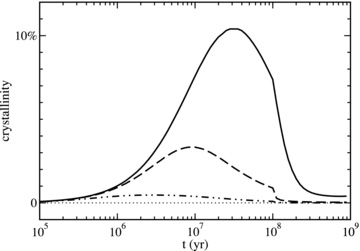
Crystalline fraction of silicates x=MX/(MX+MA) in the ISM of a starburst galaxy as a function of time, for three different amorphization rates k1 = 2.5 × 10⁻⁸ (solid line), k1 = 2.5 × 10⁻⁷ (dashed line) and k1 = 2.5 × 10⁻⁶ yr−1 (dot–dashed line). The curves shown are for the initial dust mass of 108 M⊙, and a star formation rate of 1000 M⊙ yr−1.
Finally, as Spoon et al. (2006) argue, supernova progenitors, such as RSGs and luminous blue variables, may produce significant amount of crystalline silicates (e.g. Molster et al. 1999; Voors et al. 1999), and thus contribute to the interstellar crystallinity. However, the subsequent supernova shocks travelling through these earlier ejecta will destroy a large fraction of the grains by sputtering (Jones et al. 1994; Jones, Tielens & Hollenbach 1996). The crystalline and amorphous silicate materials (assumed to be affected in equal amounts) will be returned to the gas phase. Thus, the ISM will be enriched by the atomic building blocks of silicates, but in gaseous form. Moreover, the high supernova rate in starburst galaxies will affect the dust destruction rates k3 (=k4), returning even more dust to the gas phase.
4.1.2 Dust formation in the ISM
The (re-)condensation of dust from the gas phase in the ISM will also affect the crystallinity. In our model calculations, we assumed that the dust formation in the ISM itself is negligible as a source of dust, hence FA=FX = 0. However, calculations by Zhukovska, Gail & Trieloff (2008) show that it can be the most important process that contributes to the dust content of the Milky Way. Since dust formation and dust growth at the low temperatures prevalent in molecular clouds yields only amorphous silicates, inclusion of this factor will further reduce the crystallinity of interstellar silicates.
4.2 Low crystallinities in typical starbursts
Although our models are successful in explaining the crystallinity observed in ULIRGs (Spoon et al. 2006), we find that this is only the case for an extreme set of input parameters. For more usual values for the star formation rate and the dust formation efficiency in supernovae, and when the effect of supernovae on grain destruction and amorphization is taken into account, we find that the observed crystallinity of silicates cannot be explained by a starburst driven model only. Thus, we conclude that the high level of crystallinity derived by Spoon et al. (2006) is inconsistent with the formation of crystalline silicates in stellar ejecta only. However their observations are also consistent with crystallinities, a factor of ∼3–4.5 lower than what is reported in their paper when different resonances are used, in which case our model calculations show that stellar sources could indeed explain the observed crystallinity, using reasonable parameters.
5 CONCLUSION
In order to explain the high crystalline fraction of silicates in ULIRGs, as reported by Spoon et al. (2006), we find that an additional source of crystalline silicates (or crystallization of amorphous silicates) must be present, related to the AGN itself, rather than the starburst activity. In this case, the crystallization will occur due to heating by (UV) photons from the AGN environment, rather than (massive) stars. A potential scenario may include the formation of (crystalline) silicates in quasar winds (Elvis et al. 2002). In addition, further observational studies are useful to better establish the crystalline fraction of silicates in ULIRGs, and validate the conclusions presented here.
We thank Sacha Hony and Svitlana Zhukovska for careful reading of the manuscript. Their comments and suggestions have led to a considerable improvement of this work. This research benefited from the award of a Leverhulme Research Fellowship to FK.
REFERENCES


